---
title: "Pre-Calculate Growth"
---
```{r include=FALSE}
library(tidyverse)
library(ggpubr)
library(egg)
```
**Purpose:** Precalculate growth to look-up growth rates based on weight, temperature, and ration.
Source dependencies
```{r include=FALSE}
#| cache: false
source("Habitat.R")
source("Functions.R")
```
## Set-up
Set parameters for *O. mykiss*
```{r}
spp <- "stealhead"
numFish <- 500 #number of fish in a network per scenario
Constants <- fncReadConstants()
st.wt <- 100 #starting weight
ration.lo <- 0.02
ration.hi <- ration.lo + 0.05
pred.en.dens <- 5900 #predator energy density
oxy <- 13560 #oxygen consumed
pff <- 0.1 #percent indigestible prey
prey.en.dens <- 3500 # see Railsback and Rose 1999, Beauchamp et al. 2007
```
Set up arrays. Very big to allow much wider range of and more accurate values of rations and weights
```{r}
#| cache: false
waterTemps <- cbind("pid" = seq(1, length(seq(0.1, 25, 0.1))),"WT" = seq(0.1, 25, 0.1))
rations <- seq(0.001, 0.4, 0.001)
weights <- seq(0.25, 1500, 0.25)
wt.growth <- array(NA, dim = c(nrow(waterTemps), length(rations), length(weights))) #dim = c(250 WTs, 400 rations, 6000 weights)
p.values <- respiration <- consumption <- wastes <- cmax <- pvals_derived <- wt.growth
```
## Calculate growth
Loop through arrays to record growth for each case
```{r eval=FALSE}
for(w in 1:dim(wt.growth)[3]){
  ww <- weights[w]
  for(r in 1:dim(wt.growth)[2]){
    rr <- rations[r]
    Input<- fncGetBioEParms("stealhead", pred.en.dens, prey.en.dens, oxy, pff,
                            waterTemps,
                            startweights = rep(ww, nrow(waterTemps)),
                            pvals = rep(1, nrow(waterTemps)),
                            ration = rep(rr, nrow(waterTemps)))


    Results <- BioE(Input, Constants) #run BioE code given input and constants
    wt.growth[,r,w] <- c(Results$Gg_WinBioE) # growth in g/g/d...growth standardized by fish weight
    # p.values[,r,w] <- c(Results$pp) # these are always constant, by definition
    consumption[,r,w] <- c(Results$Consumption)
    wastes[,r,w] <- c(Results$Egestion + Results$Excretion + Results$S.resp)
    respiration[,r,w] <- c(Results$Respiration)
    cmax[,r,w] <- c(Results$Consumption_max)
    pvals_derived[,r,w] <- c(Results$Pvalue)

    ## In Joules instead of grams:
    # wt.growth[,r,w] <- c(Results$Growth_j)
    # consumption[,r,w] <- c(Results$Consumption_j)
    # wastes[,r,w] <- c(Results$Egestion_j + Results$Excretion_j + Results$Sj.resp)
    # respiration[,r,w] <- c(Results$Respiration_j)
  }
  if (w %% 100 == 0) print(w)
}
```
Save outputs. Only 'wt.growth' is needed for simulations. The others are merely for plotting below.
```{r eval=FALSE}
save("wt.growth", file = "data/wt.growth.array.RData")
save("respiration", file = "data/respiration.array.RData")
save("wastes", file = "data/wastes.array.RData")
save("consumption", file = "data/consumption.array.RData")
save("pvals_derived", file = "data/pvalsderived.array.RData")
save("cmax", file = "data/cmax.array.RData")
```
Load back in to plot
```{r}
load("data/wt.growth.array.RData")
load("data/consumption.array.RData")
load("data/wastes.array.RData")
load("data/respiration.array.RData")
load("data/pvalsderived.array.RData")
load("data/cmax.array.RData")
# fncGetBioEParms("stealhead", pred.en.dens, prey.en.dens, oxy, pff,
#                             waterTemps,
#                             startweights = rep(ww, nrow(waterTemps)),
#                             pvals = rep(1, nrow(waterTemps)),
#                             ration = rep(rr, nrow(waterTemps)))
```
## Plot output
### Growth rate
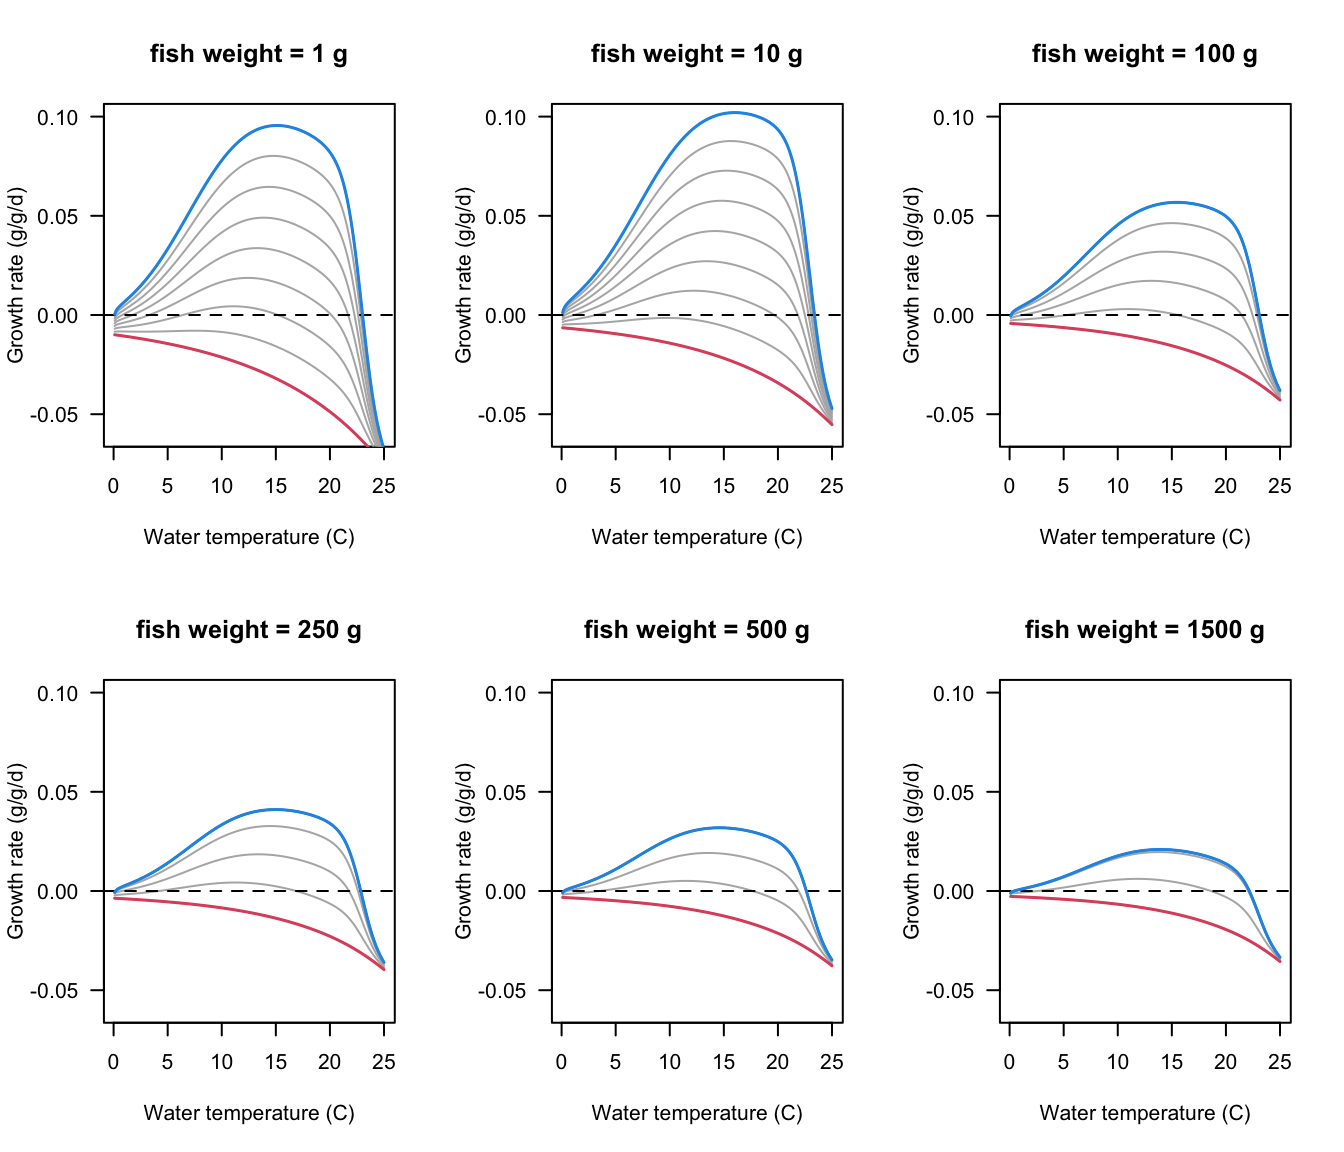
**Note that because of the range of values we used for ration, growth of small fish (<5g) is constrained even at the highest rations (max ration < allometric C~max~). So it only appears as if max growth increases with size for fish between 0.5 a 5g.**
Plot growth rate by temperature for fish of varying masses, variable ration sizes.
```{r fig.width=7, fig.height=6}
par(mfrow = c(2, 3), las = 1)
ylb <- "Growth rate (g/g/d)"
for(fish.mass in c(1, 10, 100, 250, 500, 1500)){
  plot(waterTemps[,"WT"], wt.growth[, 400, fish.mass], type='l', ylab = ylb, xlab = "Water temperature (C)",
       col = 4, ylim = c(-0.06, 0.1), main = paste0("fish weight = ", fish.mass," g")) #max ration
  for(i in seq(1, length(rations), by = 50)){ lines(waterTemps[,"WT"], wt.growth[,i, fish.mass], col = "gray70")}
  abline(h = 0, lty = 2)
  lines(waterTemps[,"WT"], wt.growth[, 1, fish.mass], col = 2, lwd = 1.5) # min ration
  lines(waterTemps[,"WT"], wt.growth[, 400, fish.mass], col = 4, lwd = 1.5) # max ration
}
```
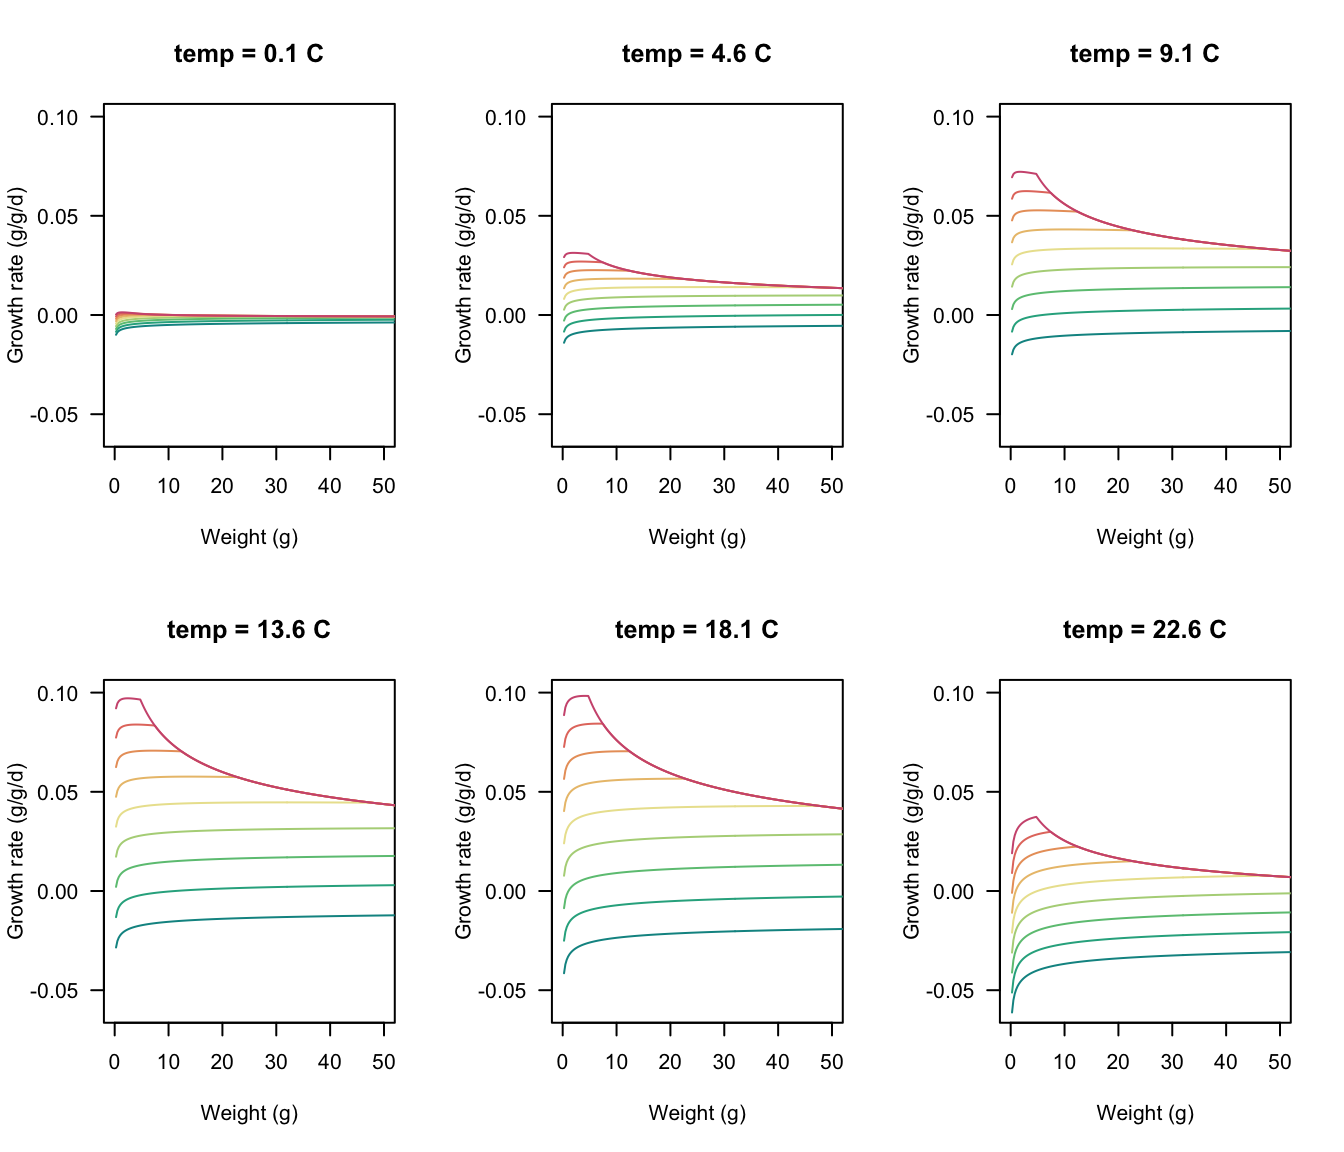
Plot growth potential by weight under different temperatures (panels) and ration sizes (line color: red = high, blue = low).
```{r fig.width=7, fig.height=6}
par(mfrow = c(2, 3), las = 1)
speccols <- hcl.colors(9, "Temps")
ratiseq <- seq(1, length(rations), by = 49)
tempseq <- seq(1, length(waterTemps[,"WT"]), by = 45)

for (i in 1:length(tempseq)) {
  plot(wt.growth[tempseq[i],1,] ~ weights, type = "n", ylim = c(-0.06, 0.1), xlim = c(0,50),
       ylab = "Growth rate (g/g/d)", xlab = "Weight (g)",
       main = paste0("temp = ", waterTemps[tempseq[i], "WT"]," C"))

  for (r in 1:length(ratiseq)) {
    lines(wt.growth[tempseq[i],ratiseq[r],] ~ weights, col = speccols[r])
    # print(range(wt.growth[i,ratiseq[r],]))
  }
  abline(v = 100, lty = 2)
  }
```
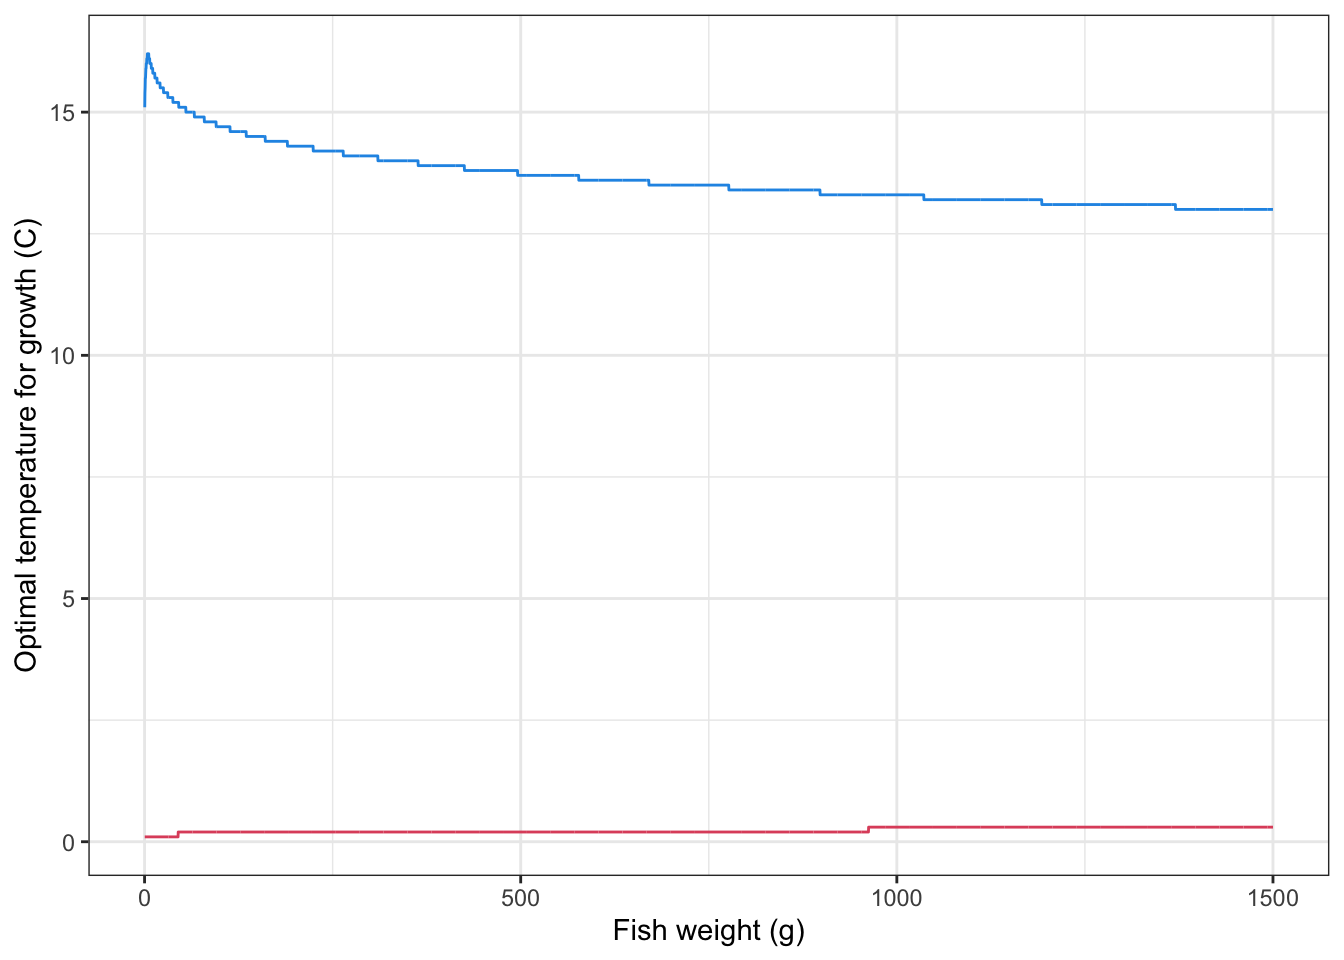
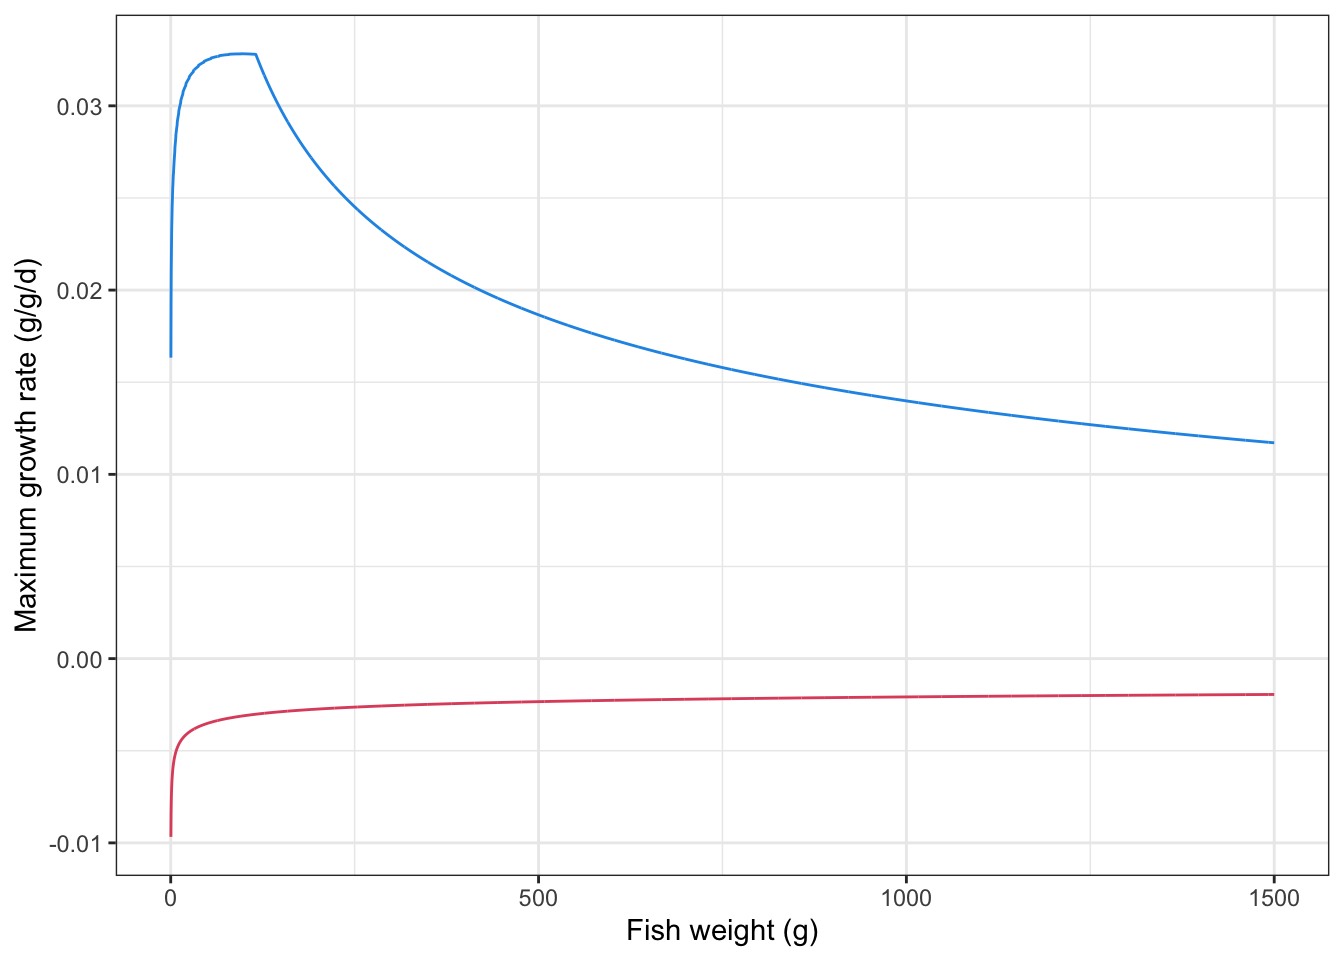
Plot optimal growth temperature and maximum growth rate by fish size: blue = maximum ration, grey = (nearly) minimum ration
```{r}
# dim(wt.growth)[3]
opttemptib <- tibble(weight = weights,
                     opttemp_ratlo = NA, opttemp_rathi = NA,
                     growth_ggd_ratlo = NA, growth_ggd_rathi = NA)

for (i in 1:dim(wt.growth)[3]) {
  opttemptib$opttemp_ratlo[i] <- waterTemps[which.max(wt.growth[,10,i]),2]
  opttemptib$opttemp_rathi[i] <- waterTemps[which.max(wt.growth[,400,i]),2]
  opttemptib$growth_ggd_ratlo[i] <- wt.growth[which.max(wt.growth[,10,i]),10,i]
  opttemptib$growth_ggd_rathi[i] <- wt.growth[which.max(wt.growth[,400,i]),151,i]
}

opttemptib %>% ggplot() +
  geom_line(aes(x = weight, y = opttemp_ratlo), color = 2) +
  geom_line(aes(x = weight, y = opttemp_rathi), color = 4) +
  theme_bw() + xlab("Fish weight (g)") + ylab("Optimal temperature for growth (C)")
opttemptib %>% ggplot() +
  geom_line(aes(x = weight, y = growth_ggd_ratlo), color = 2) +
  geom_line(aes(x = weight, y = growth_ggd_rathi), color = 4) +
  theme_bw() + xlab("Fish weight (g)") + ylab("Maximum growth rate (g/g/d)")
```
Compare raw growth (g/g/d) to g/g/d derived from J/g/d (as in Fullerton)
```{r fig.width=7, fig.height=6, eval=FALSE}
par(mfrow = c(2, 3), las = 1)
for(fish.mass in c(1, 10, 100, 250, 500, 1500)){
  plot(wt.growth.raw[, 151, fish.mass] ~ wt.growth[, 151, fish.mass], type='l', ylab = "Raw g/g/d", xlab = "g/g/d calculated from J/g/d\n(Fullerton method)",
       col = 4, ylim = c(-0.03, 0.08), main = paste0("fish weight = ", fish.mass," g")) #max ration
  for(i in seq(2, length(rations)-1, by = 10)){ lines(wt.growth.raw[,i, fish.mass] ~ wt.growth[,i, fish.mass], col = "gray70")}
  abline(h = 0, lty = 2)
  abline(v = 0, lty = 2)
  lines(wt.growth.raw[, 1, fish.mass] ~ wt.growth[, 1, fish.mass], col = 2, lwd = 1.5) # min ration
  lines(wt.growth.raw[, 151, fish.mass] ~ wt.growth[, 151, fish.mass], col = 4, lwd = 1.5) # max ration
}
```
Show raw growth
```{r fig.width=7, fig.height=6, eval=FALSE}
par(mfrow = c(2, 3), las = 1)
ylb <- "Growth rate (g/g/d)"
for(fish.mass in c(1, 10, 100, 250, 500, 1500)){
  plot(waterTemps[,"WT"], wt.growth.raw[, 151, fish.mass], type='l', ylab = ylb, xlab = "Water temperature (C)",
       col = 4, ylim = c(-0.025, 0.08), main = paste0("fish weight = ", fish.mass," g")) #max ration
  for(i in seq(2, length(rations)-1, by = 10)){ lines(waterTemps[,"WT"], wt.growth.raw[,i, fish.mass], col = "gray70")}
  abline(h = 0, lty = 2)
  lines(waterTemps[,"WT"], wt.growth.raw[, 1, fish.mass], col = 2, lwd = 1.5) # min ration
  lines(waterTemps[,"WT"], wt.growth.raw[, 151, fish.mass], col = 4, lwd = 1.5) # max ration
}
```
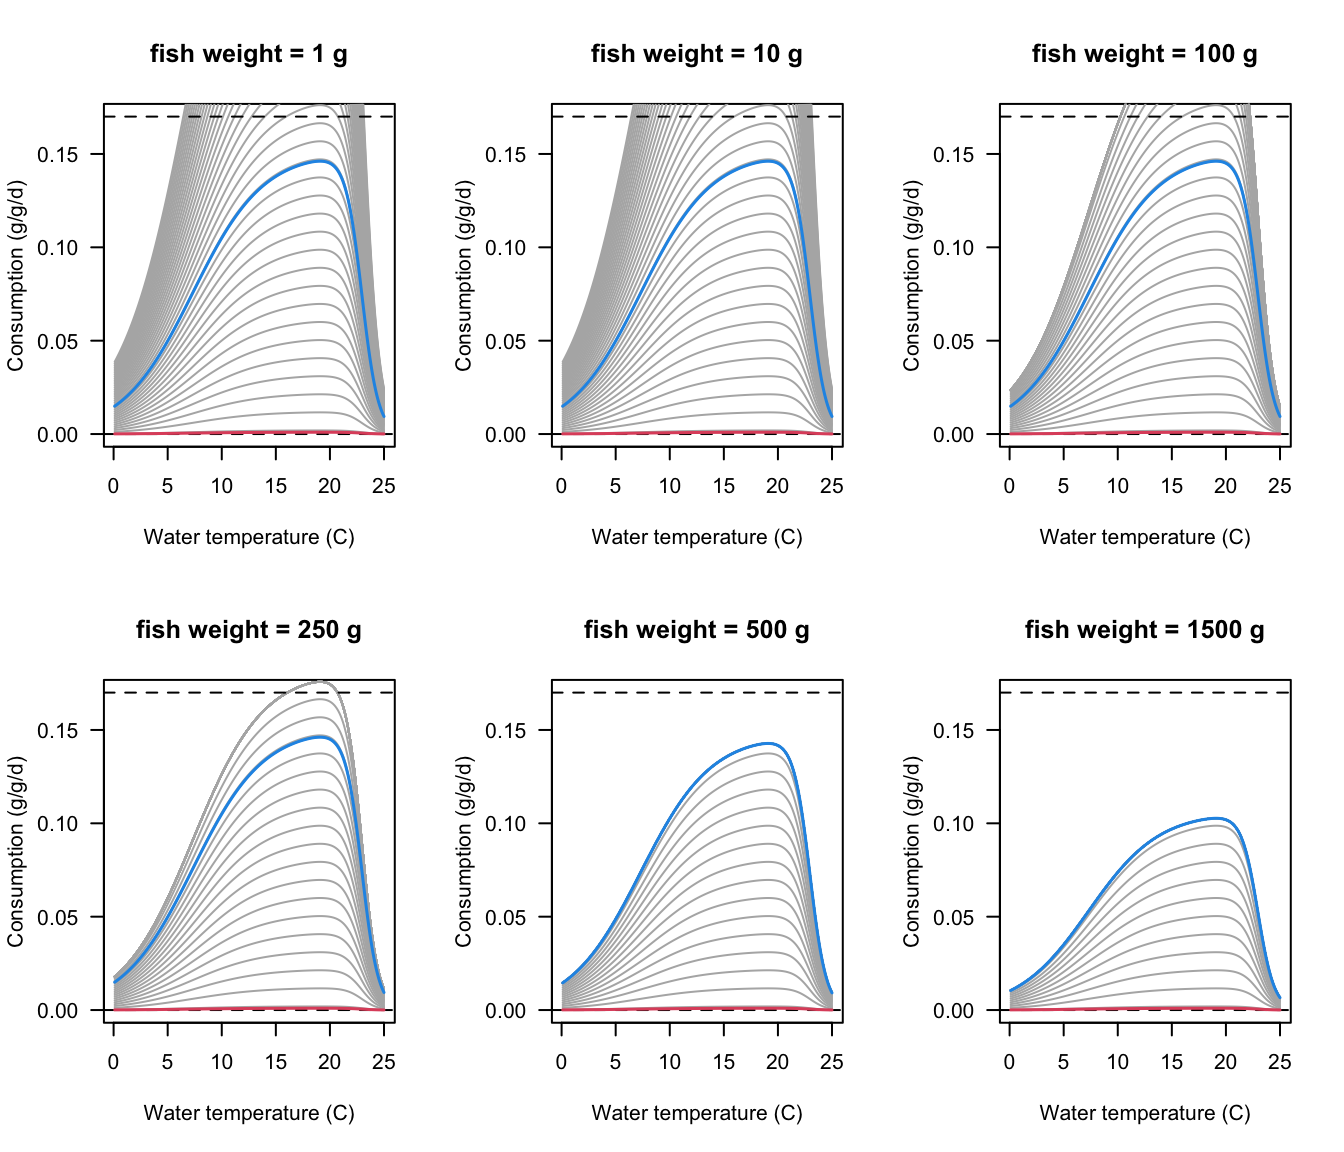
### Consumption
Consumption:
```{r fig.width=7, fig.height=6}
par(mfrow = c(2, 3), las = 1)
for(fish.mass in c(1, 10, 100, 250, 500, 1500)){
  plot(waterTemps[,"WT"], consumption[, 151, fish.mass], type='l', ylab = "Consumption (g/g/d)", xlab = "Water temperature (C)",
       col = 4, ylim = c(0, 0.17), main = paste0("fish weight = ", fish.mass," g")) #max ration
  for(i in seq(2, length(rations)-1, by = 10)){ lines(waterTemps[,"WT"], consumption[,i, fish.mass], col = "gray70")}
  abline(h = 0, lty = 2)
  lines(waterTemps[,"WT"], consumption[, 1, fish.mass], col = 2, lwd = 1.5) # min ration
  lines(waterTemps[,"WT"], consumption[, 151, fish.mass], col = 4, lwd = 1.5) # max ration
  abline(h = 0.17, lty = 2)
}
```
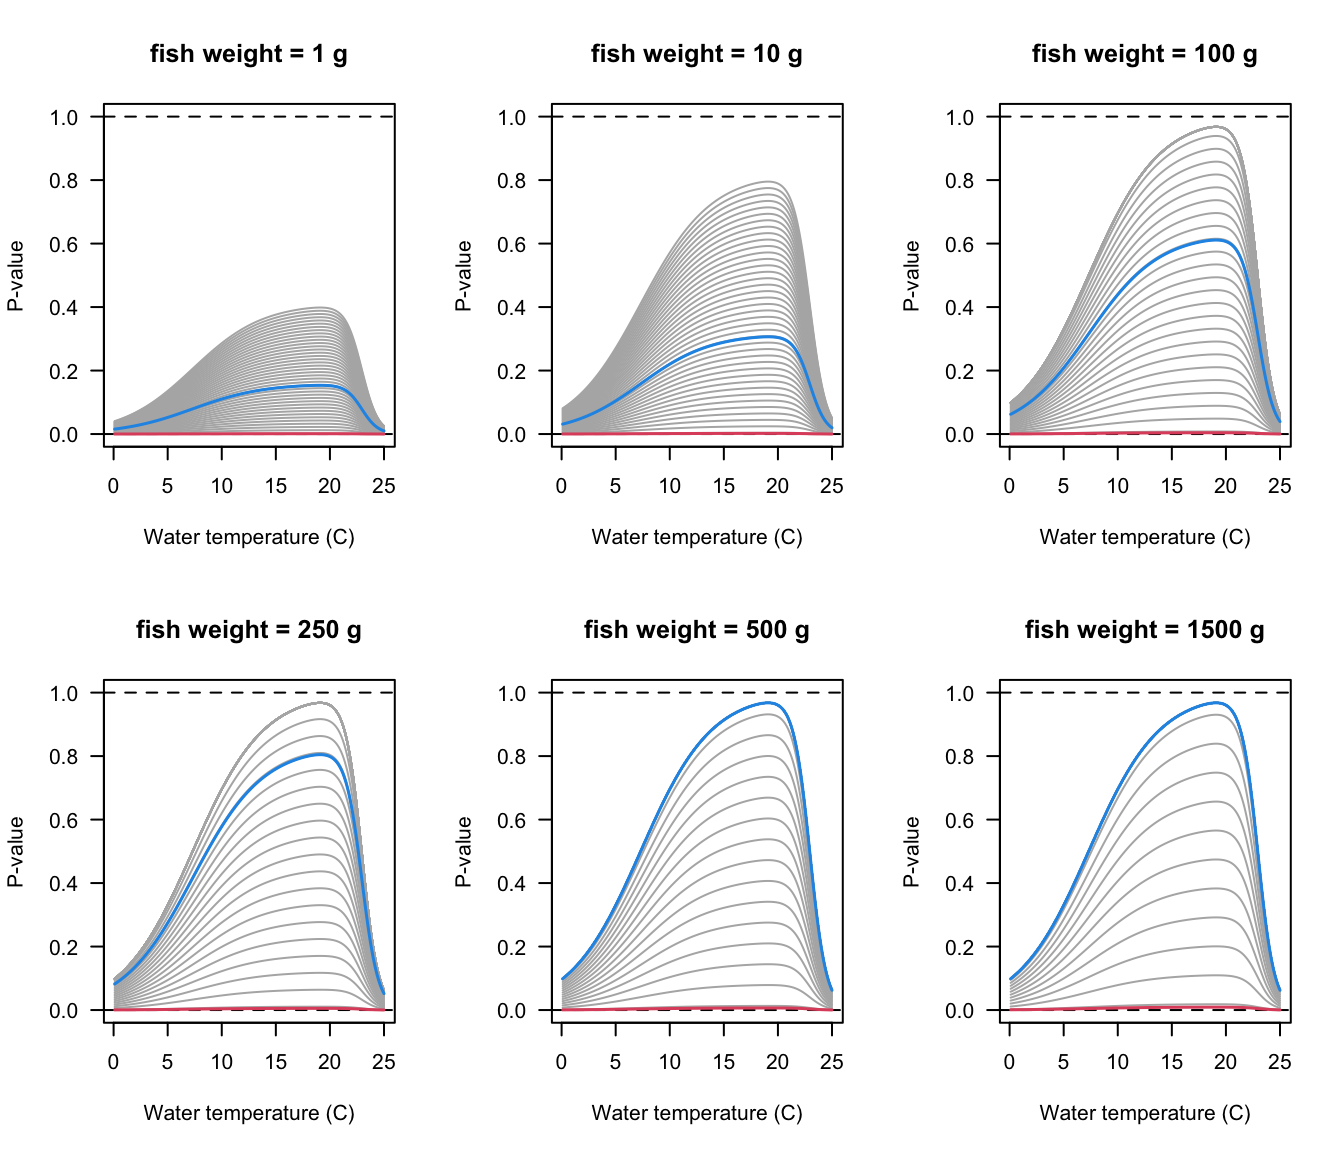
P-values: proportion of maximum consumption
```{r fig.width=7, fig.height=6}
par(mfrow = c(2, 3), las = 1)
for(fish.mass in c(1, 10, 100, 250, 500, 1500)){
  plot(waterTemps[,"WT"], pvals_derived[, 151, fish.mass], type='l', ylab = "P-value", xlab = "Water temperature (C)",
       col = 4, ylim = c(0, 1), main = paste0("fish weight = ", fish.mass," g")) #max ration
  for(i in seq(2, length(rations)-1, by = 10)){ lines(waterTemps[,"WT"], pvals_derived[,i, fish.mass], col = "gray70")}
  abline(h = 0, lty = 2)
  abline(h = 1, lty = 2)
  lines(waterTemps[,"WT"], pvals_derived[, 1, fish.mass], col = 2, lwd = 1.5) # min ration
  lines(waterTemps[,"WT"], pvals_derived[, 151, fish.mass], col = 4, lwd = 1.5) # max ration
}
```
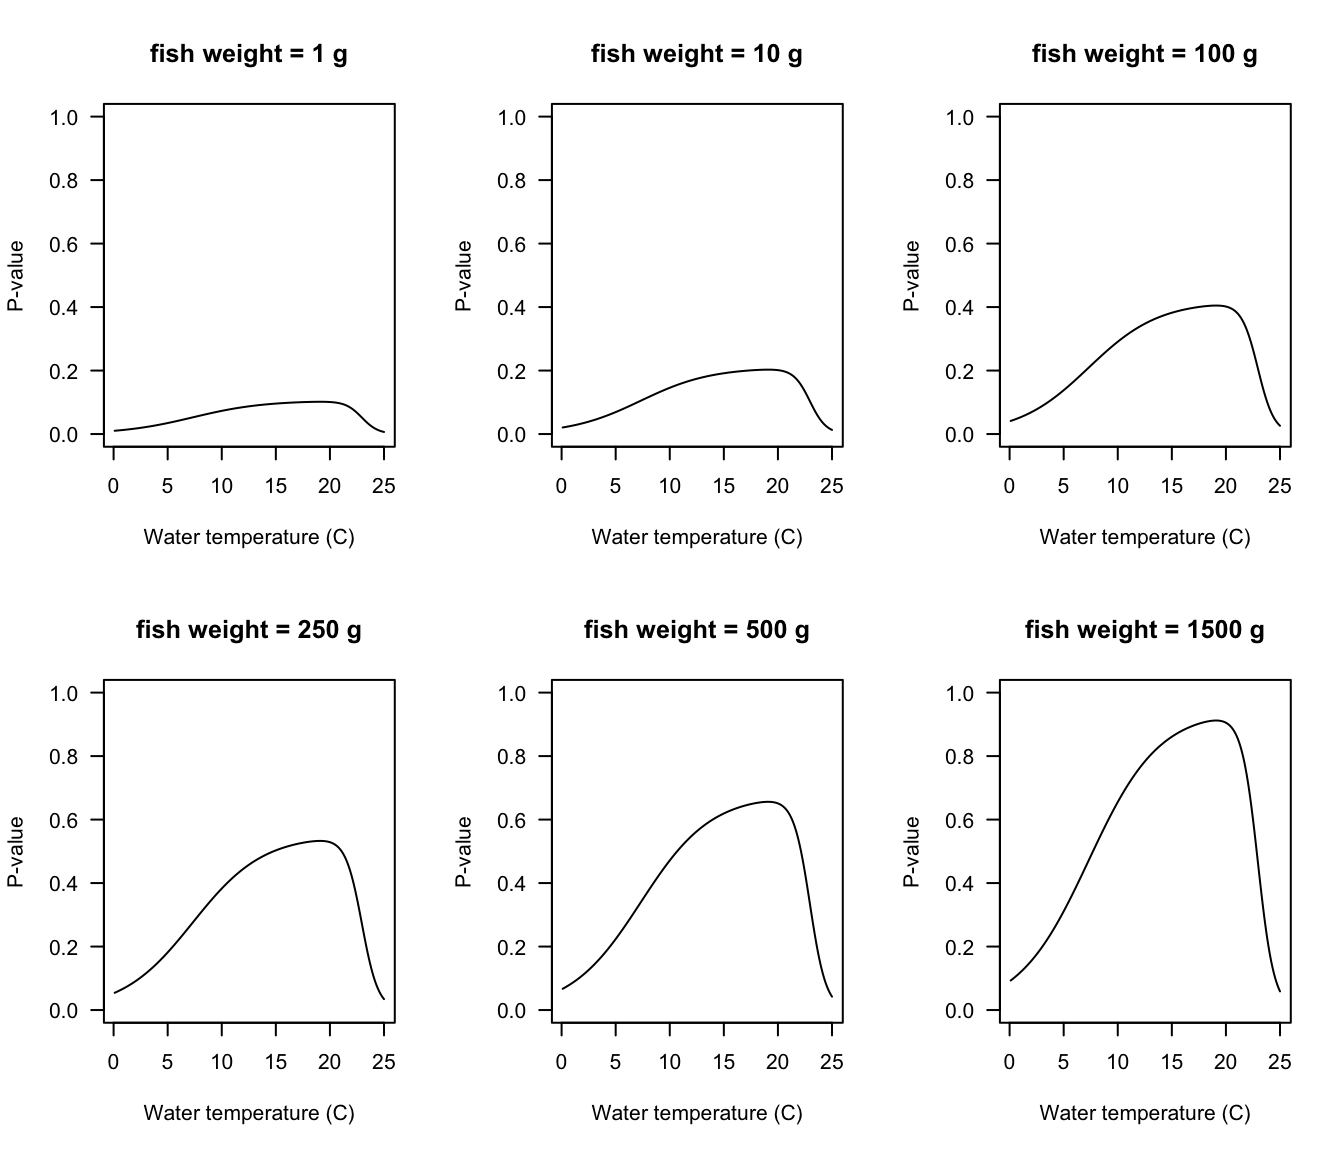
Same as above, but only show lines for ration size = 0.1g, the value we set for patch-level daily food availability (see `Habitat.qmd`)
```{r fig.width=7, fig.height=6}
focal_ration <- 0.1
par(mfrow = c(2, 3), las = 1)
for(fish.mass in c(1, 10, 100, 250, 500, 1500)){
  plot(waterTemps[,"WT"], pvals_derived[, which.min(abs(rations - focal_ration)), fish.mass],
       type='l', ylab = "P-value", xlab = "Water temperature (C)",
       ylim = c(0, 1), main = paste0("fish weight = ", fish.mass," g"))
}
```
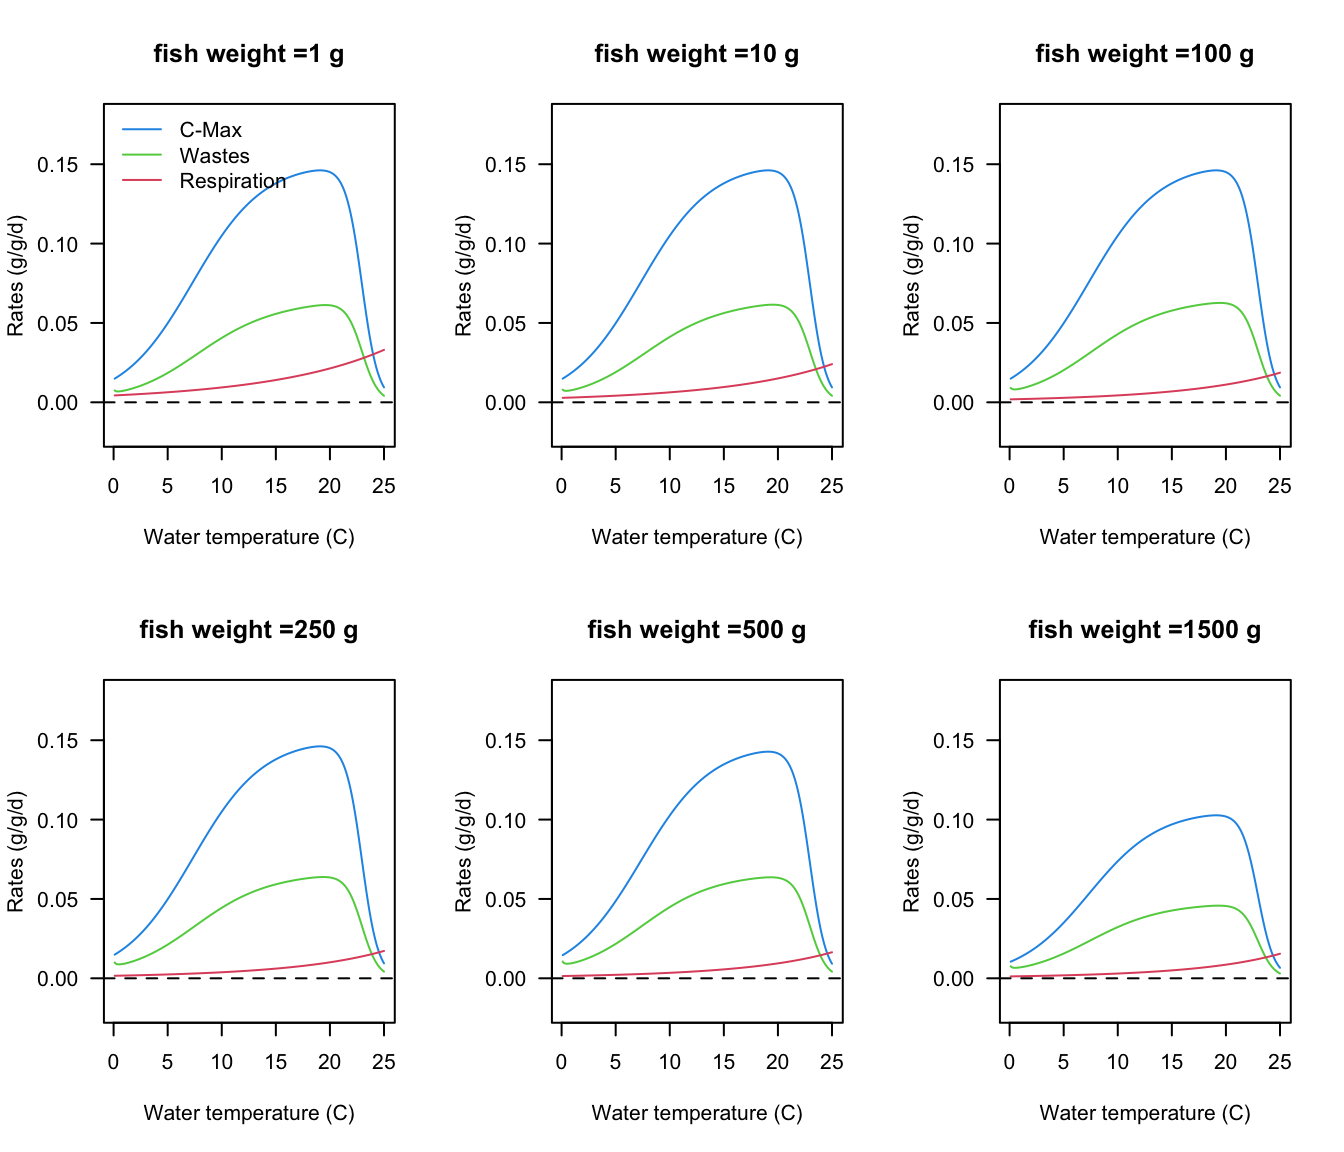
### Energy budget
Create multi-panel energy budget plots for different sized fish: *Consumption* = *metabolism* + *wastes* + *growth*
Scope for growth is thus the difference between *Consumption* and (*metabolism* + *wastes*), i.e., the space between the green and red lines:
```{r fig.width=7, fig.height=6}
# png("growth.banana.png", 8, 6, "in", res = 300)
par(mfrow = c(2,3), las = 1)
ylb <- "Rates (g/g/d)"
for(fish.mass in c(1, 10, 100, 250, 500, 1500)){
  plot(waterTemps[,"WT"], consumption[,151, fish.mass], type='l', ylab = ylb, xlab="Water temperature (C)",
       col = 4, ylim = c(-0.02, 0.18), main = paste0("fish weight =", fish.mass," g")) #max ration
  lines(waterTemps[,"WT"], wastes[,151, fish.mass], col = 3) #min ration
  lines(waterTemps[,"WT"], respiration[,151, fish.mass], col = 2) #min ration
  abline(h = 0, lty = 2)
  if(fish.mass == 1) legend("topleft", legend = c("C-Max", "Wastes", "Respiration"), lty = 1, col = c(4, 3 , 2), bty = 'n')
}
# dev.off()
```
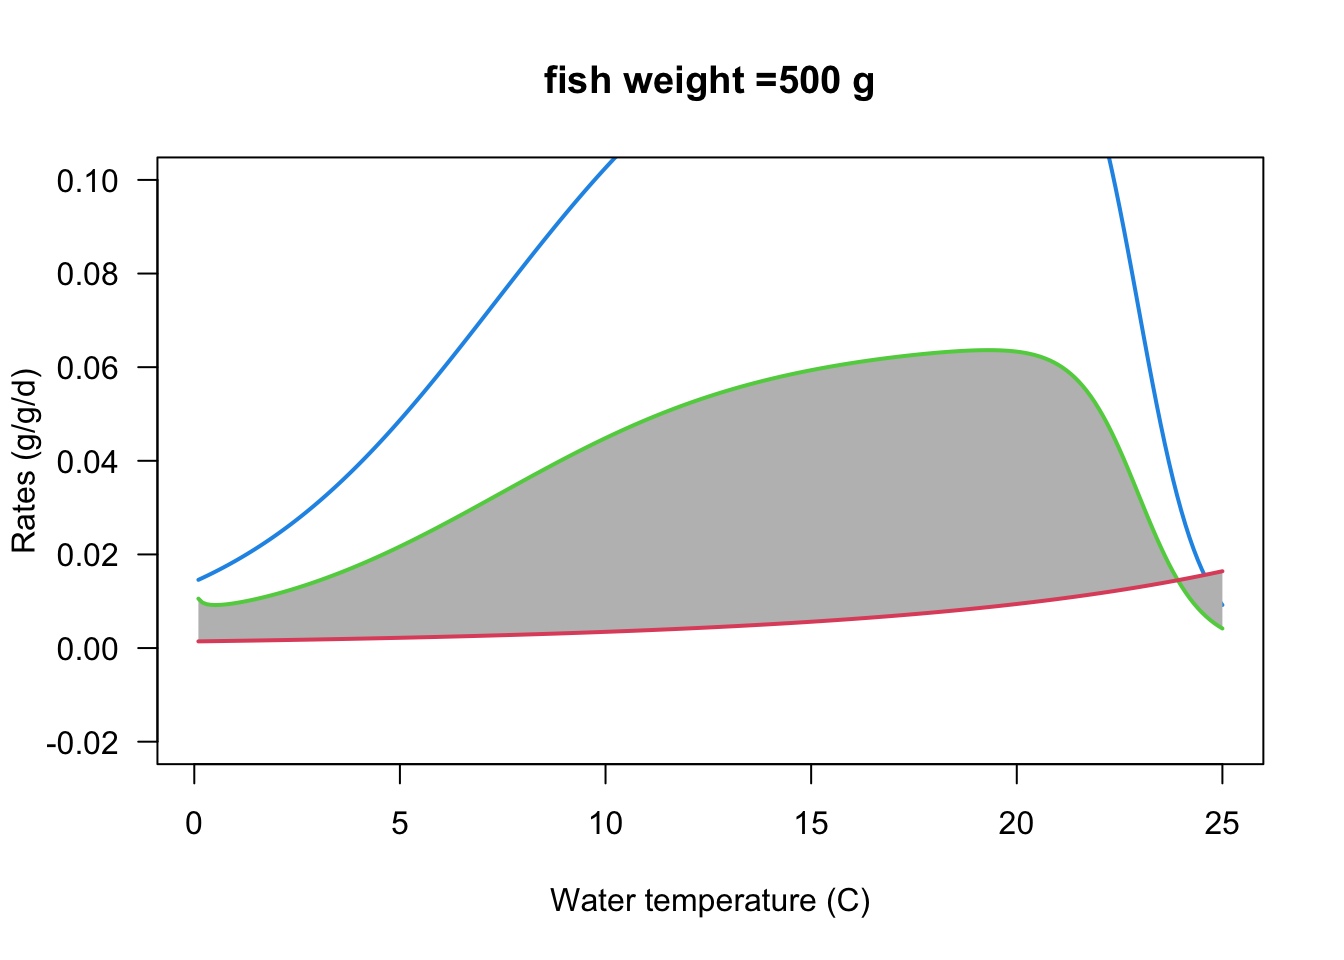
Create single panel plot of 'growth banana': shaded region is the scope for growth
```{r}
par(mfrow = c(1,1), las = 1)
ylb <- "Rates (g/g/d)"
fish.mass <- 500
plot(waterTemps[,"WT"], consumption[,151, fish.mass], type = 'l', ylab = ylb, xlab = "Water temperature (C)",
     ylim = c(-0.02, 0.1), main = paste0("fish weight =", fish.mass," g"), col = 4, lwd = 2) #max ration
polygon(c(waterTemps[, "WT"], rev(waterTemps[, "WT"])), c(wastes[, 151, fish.mass], rev(respiration[, 151, fish.mass])),
        border = NA, col = "grey")
lines(waterTemps[,"WT"], wastes[,151, fish.mass], col = 3, lwd = 2) #min ration
lines(waterTemps[,"WT"], respiration[,151, fish.mass], col = 2, lwd = 2) #min ration
```