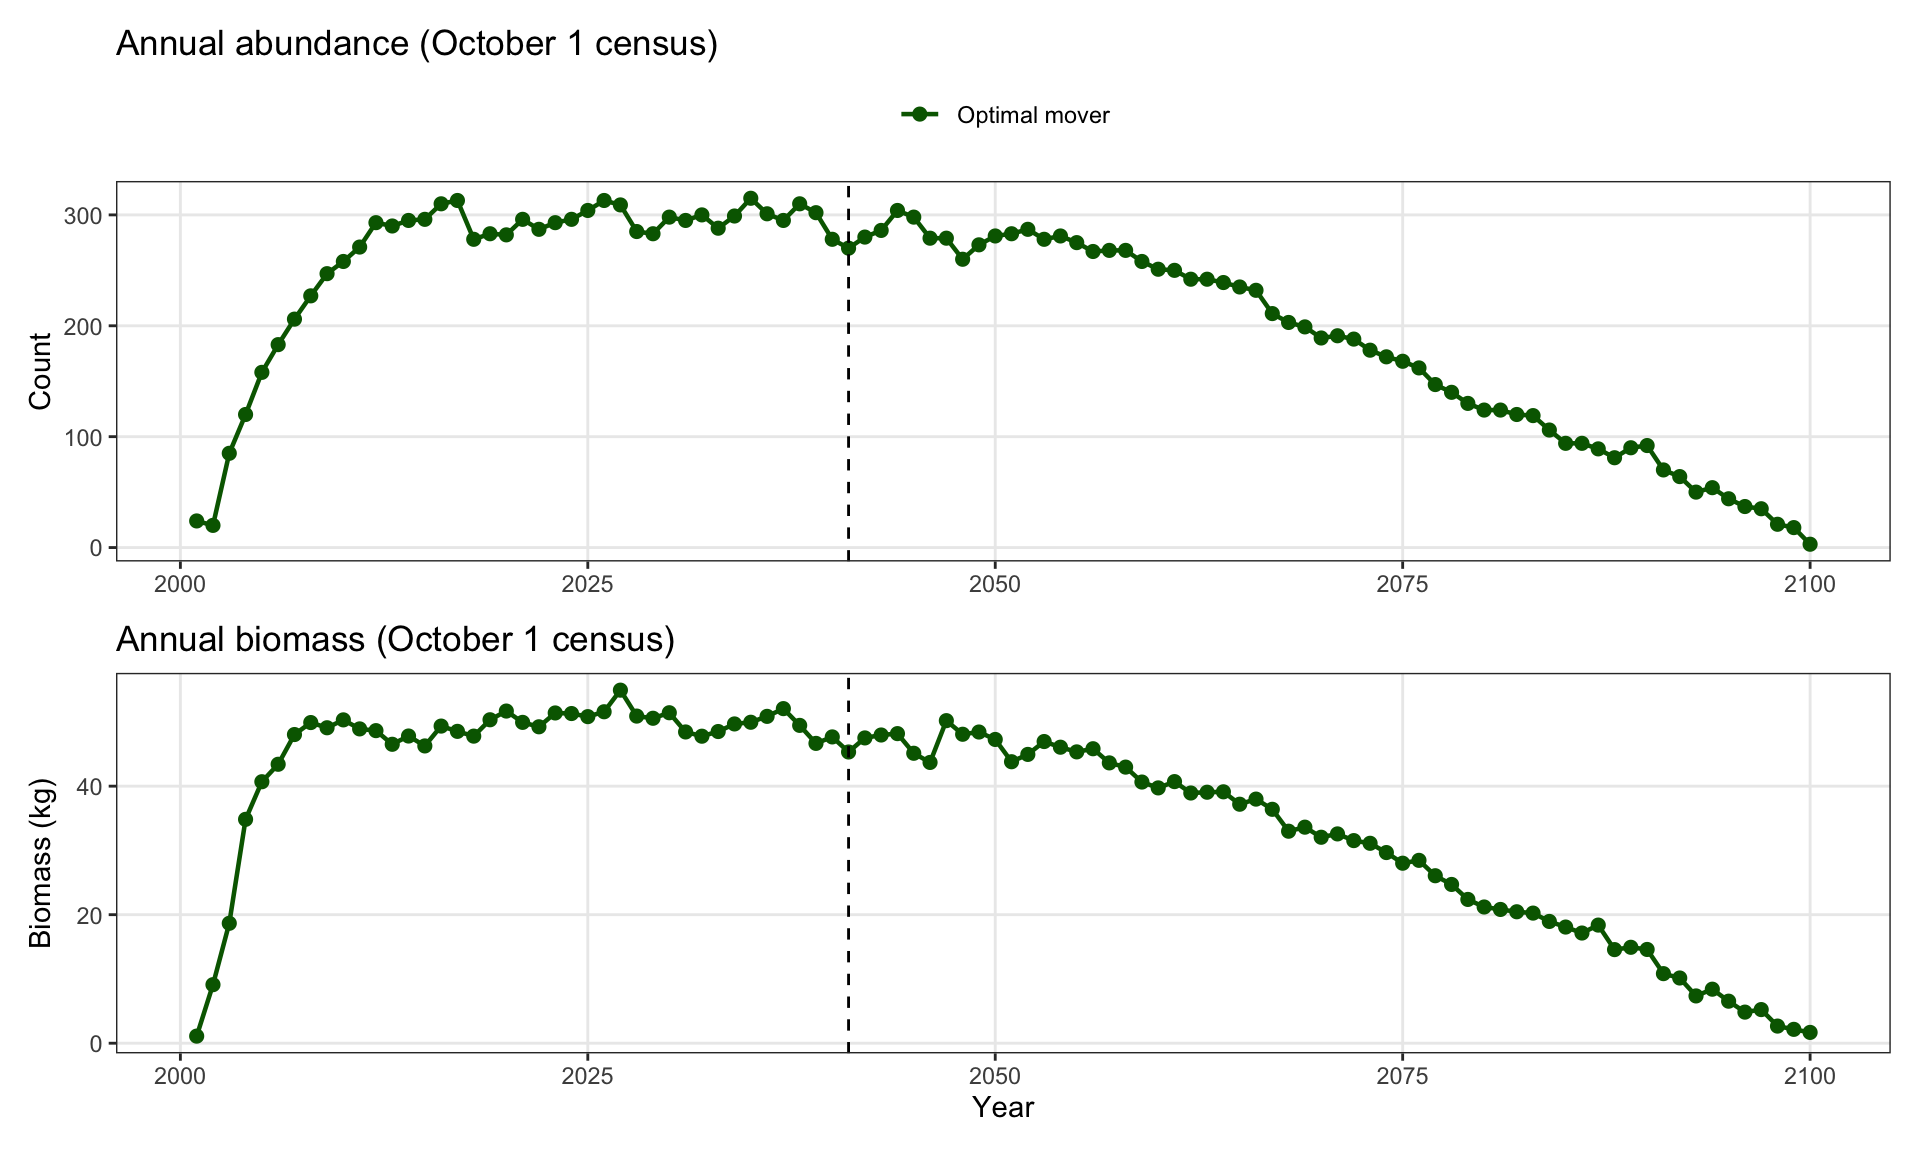
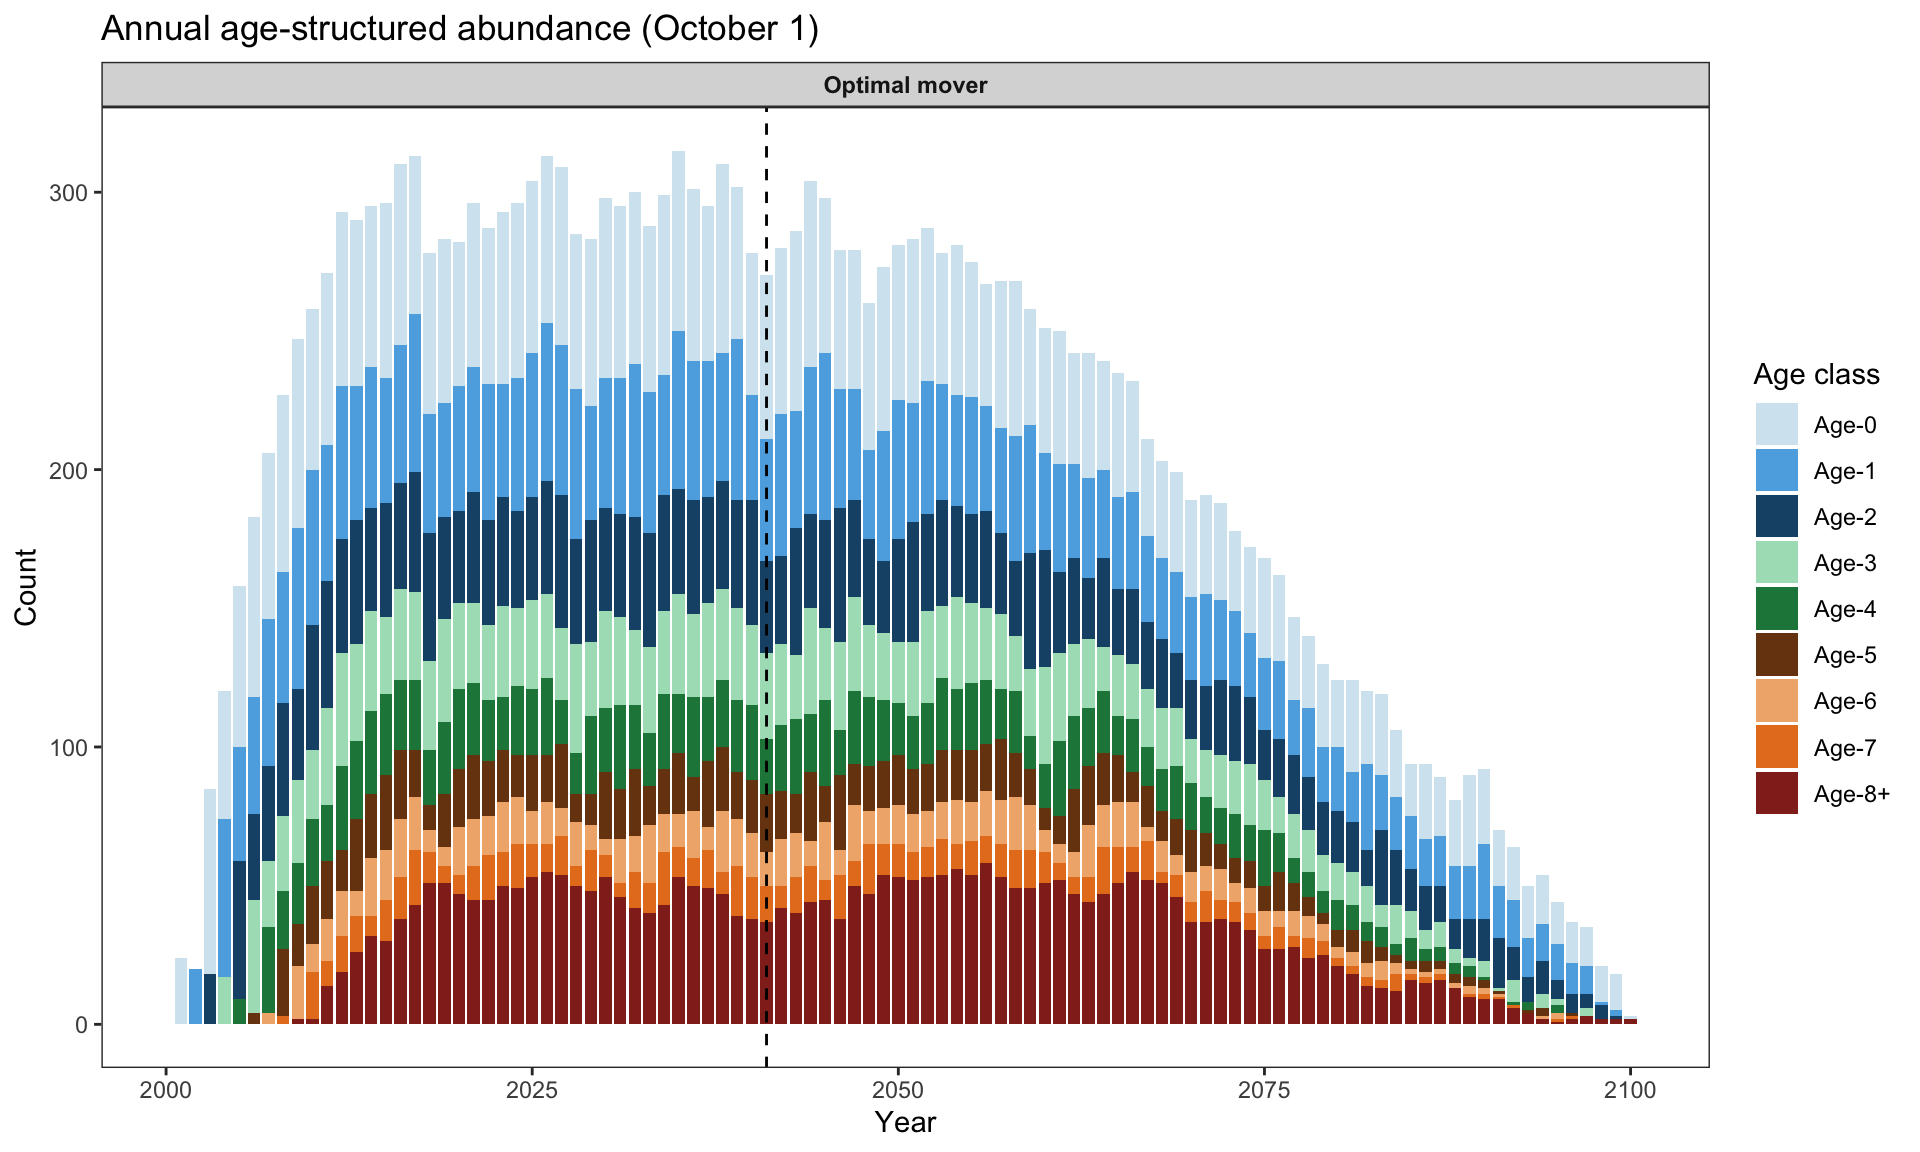
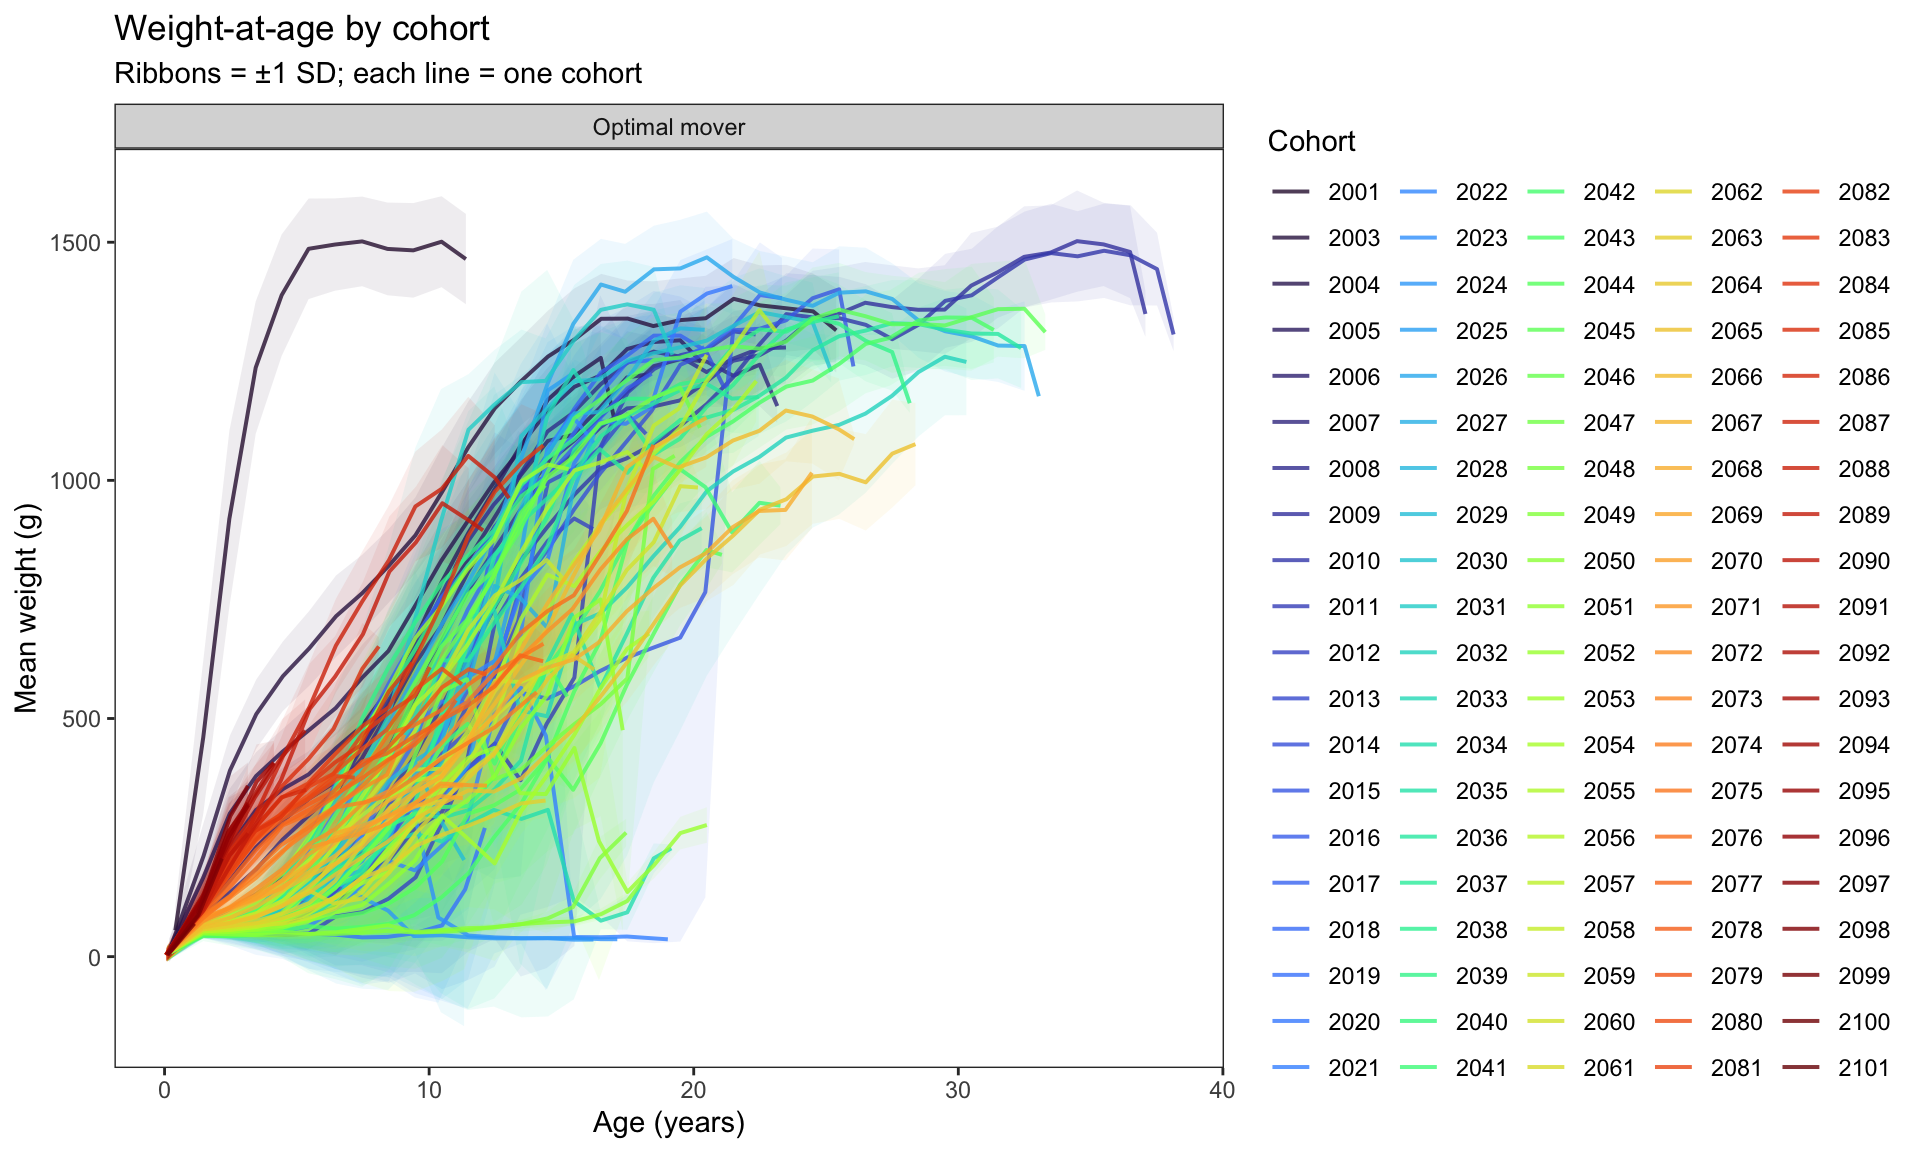
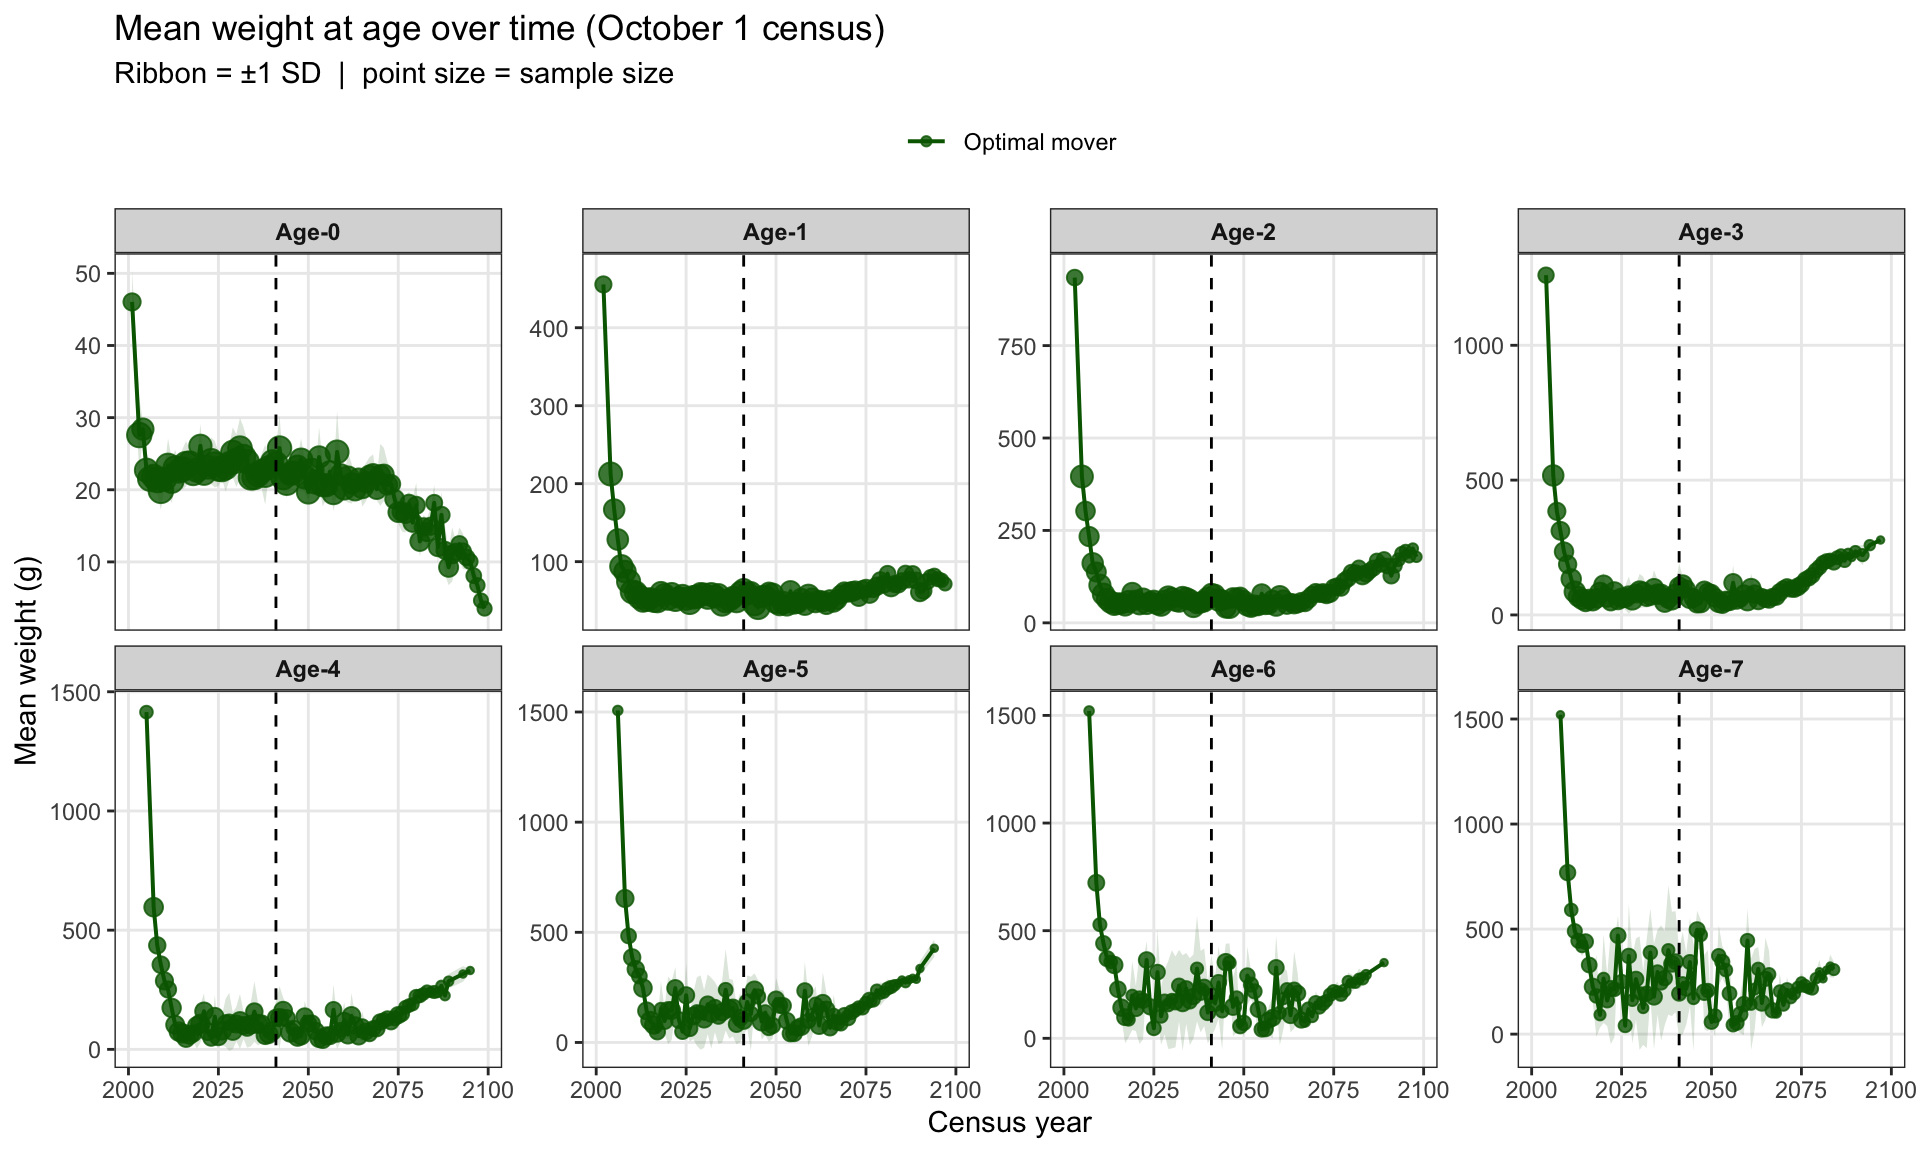
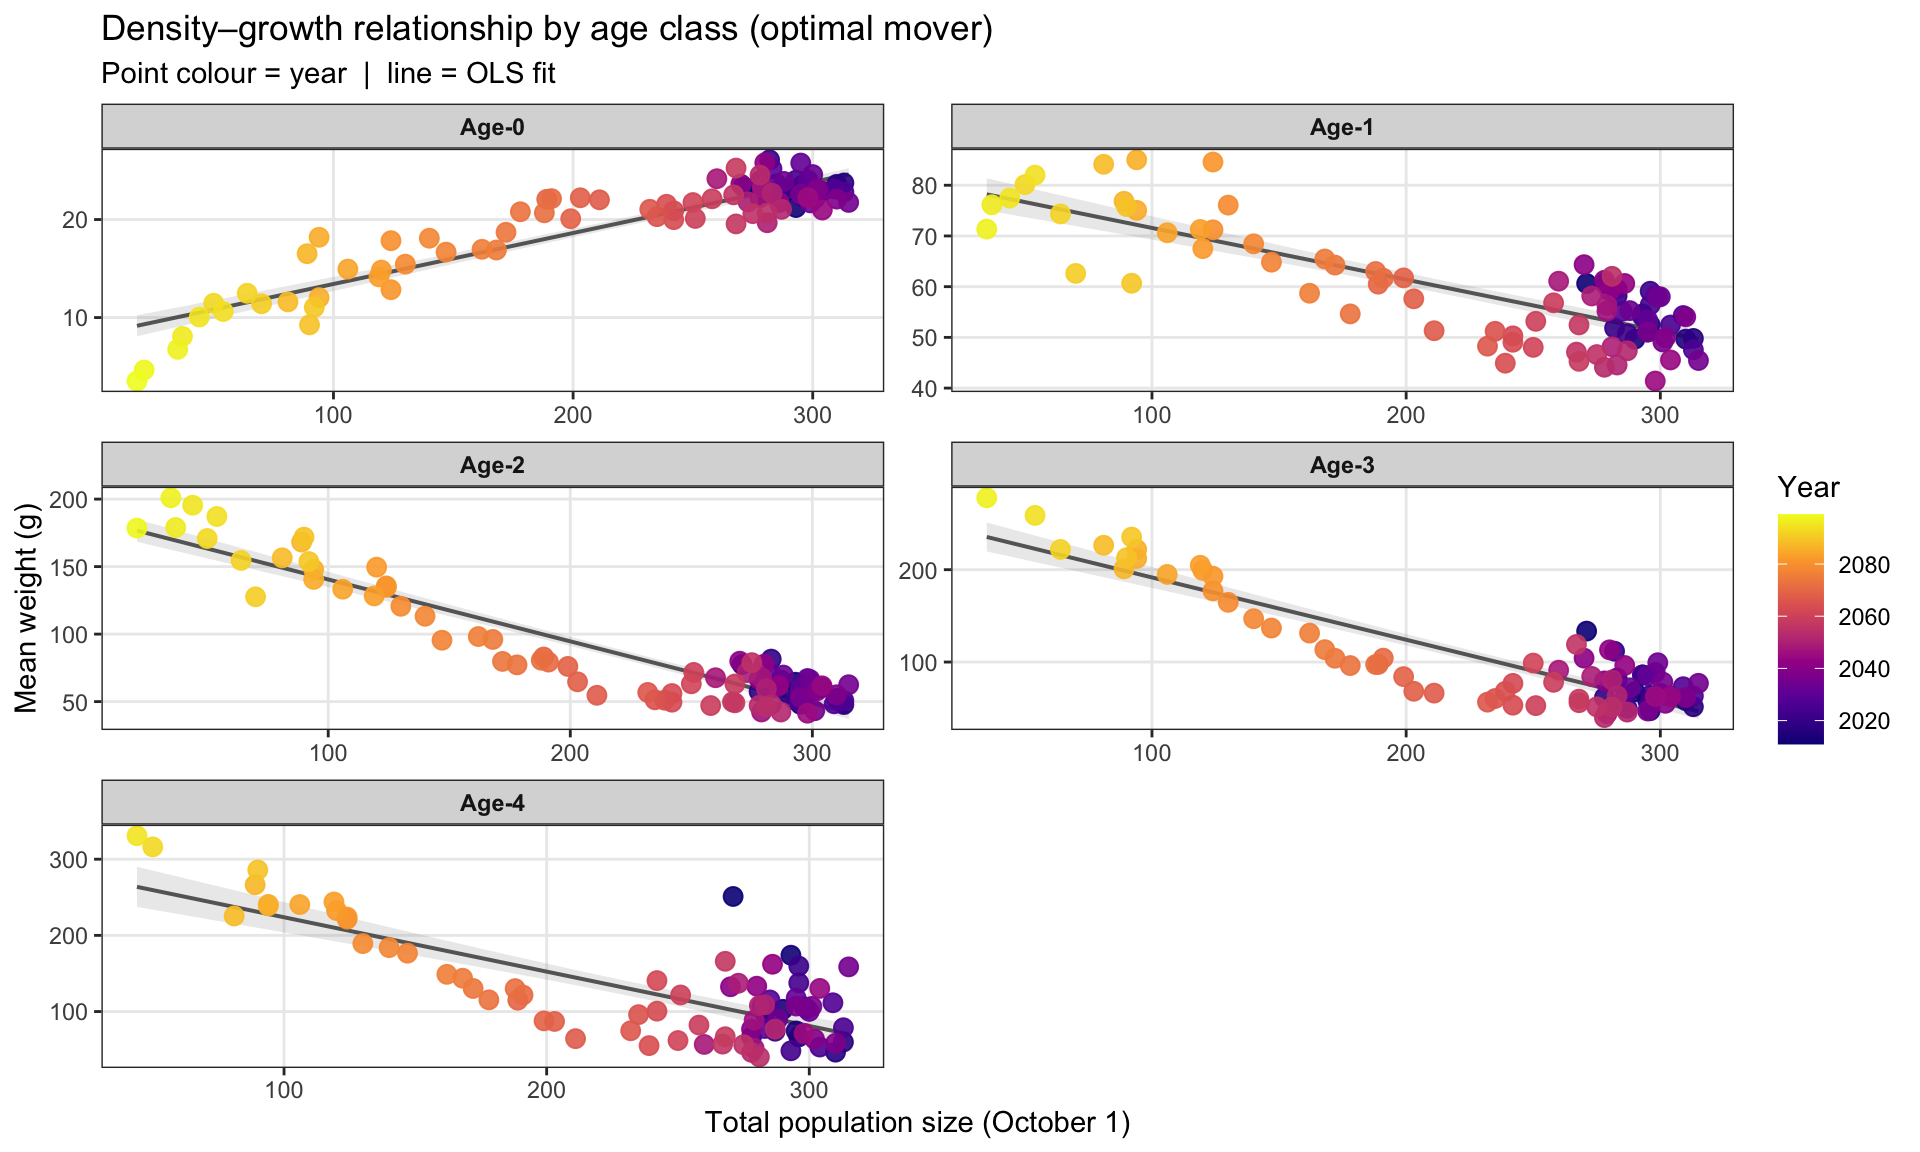
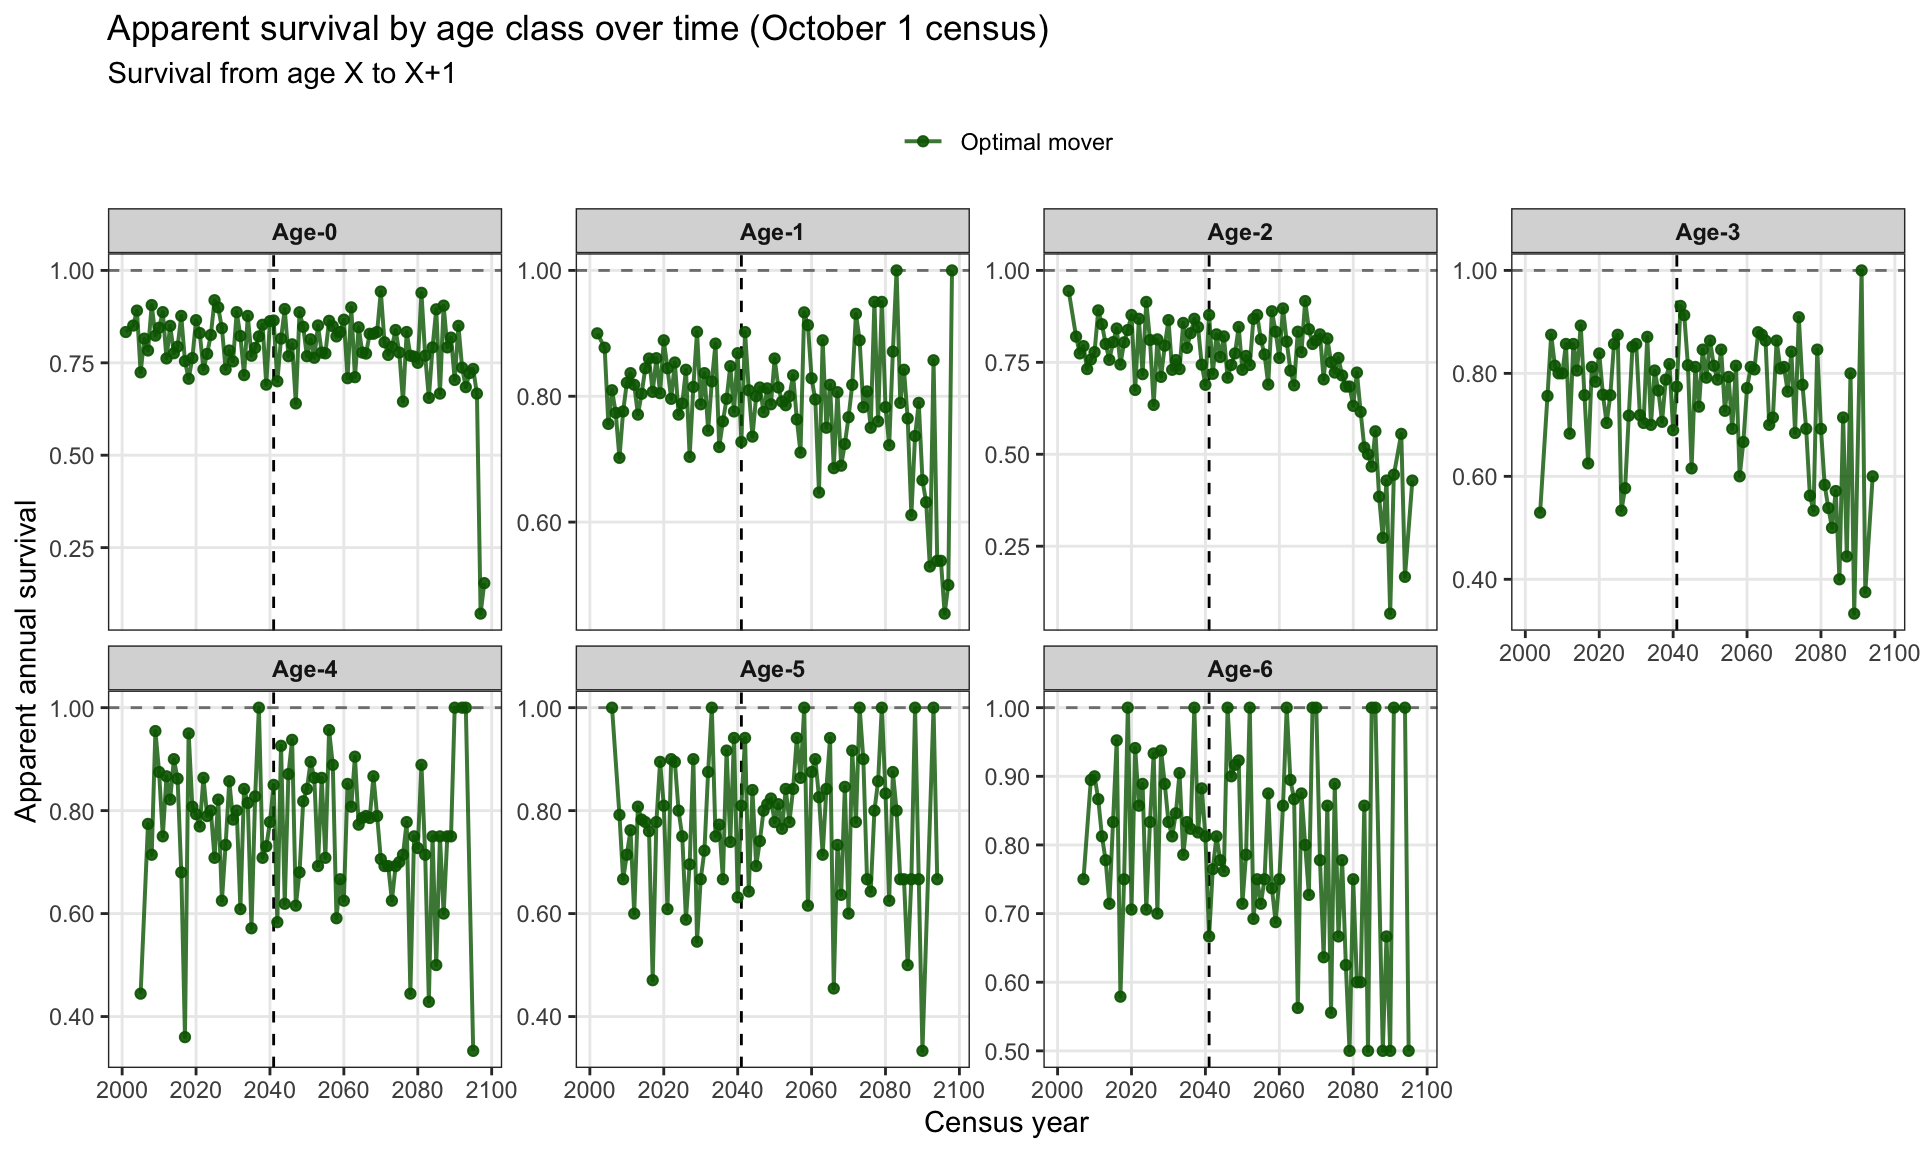
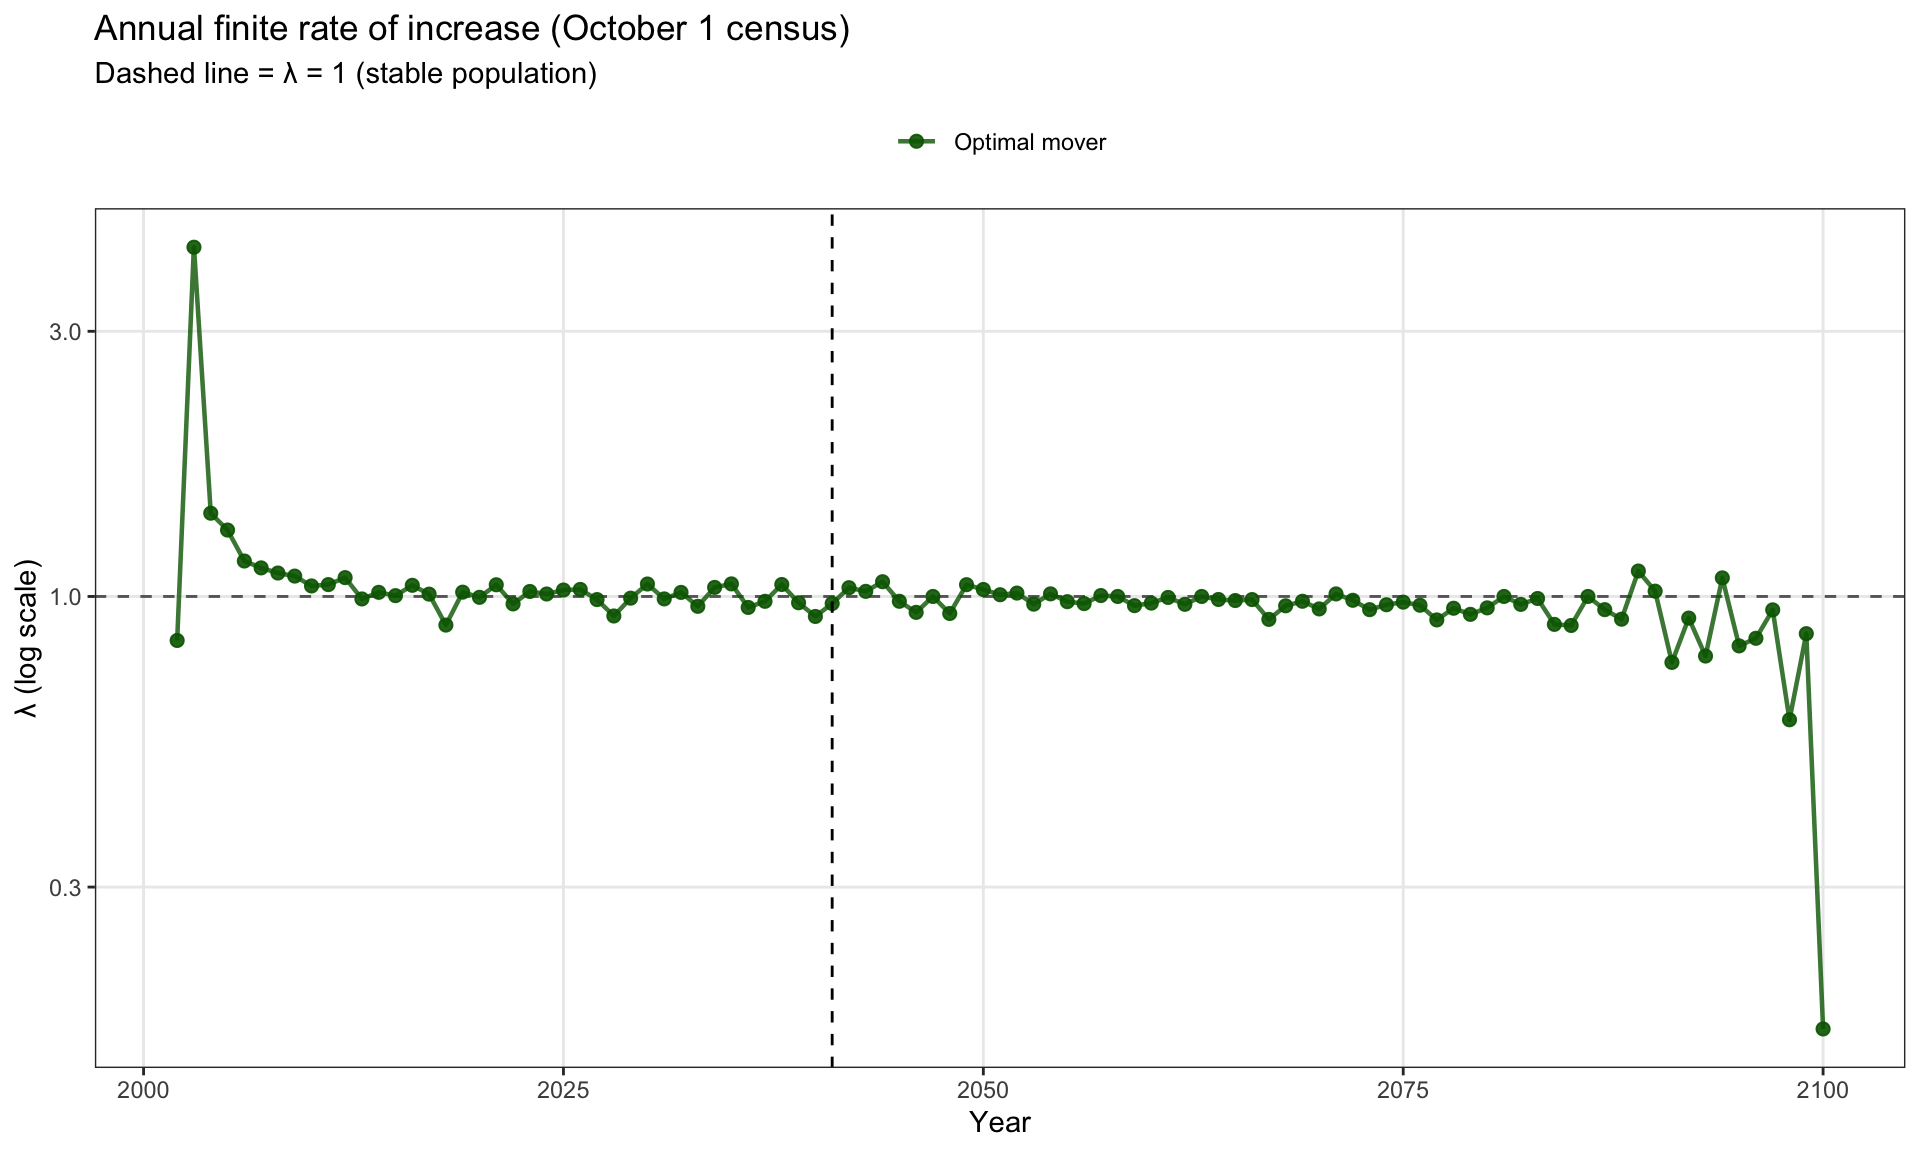
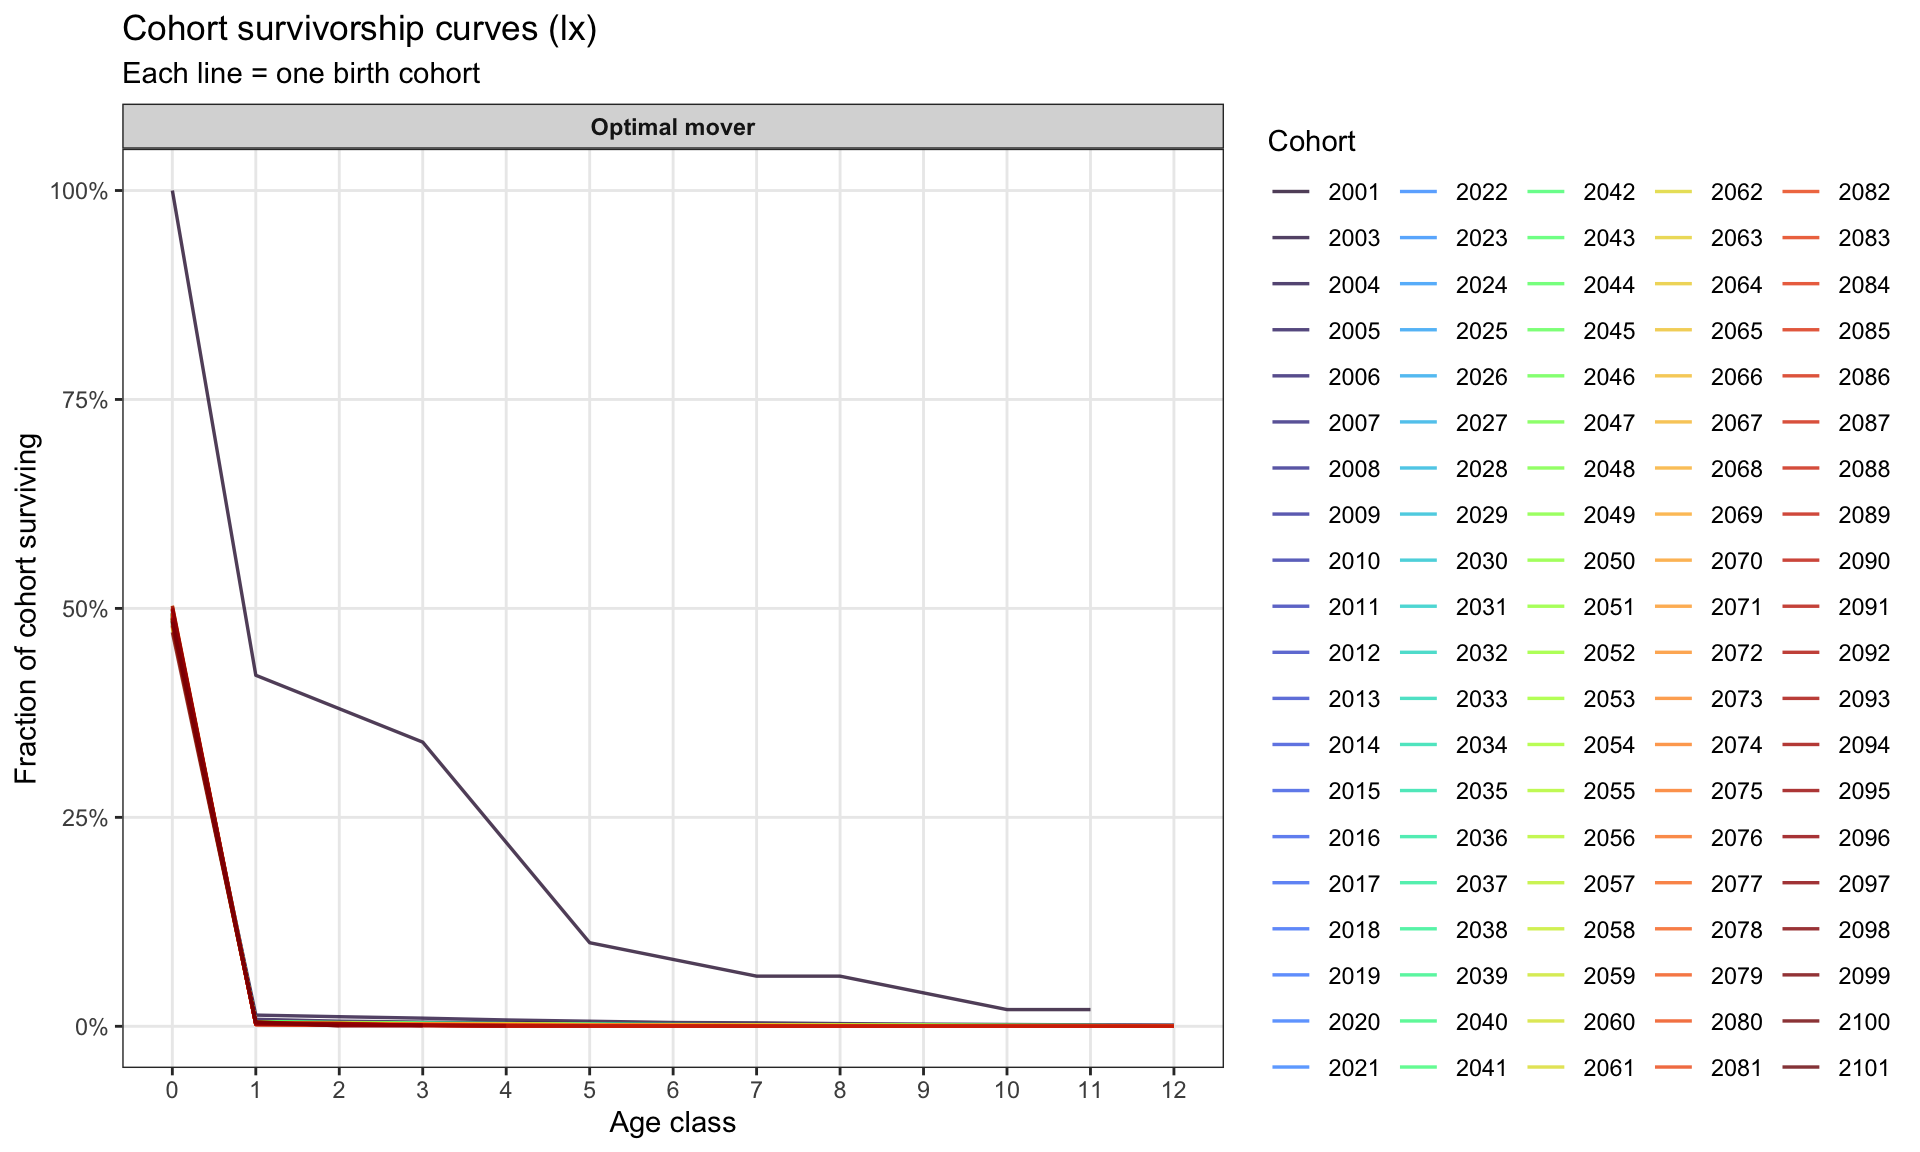
Individual-level bioenergetics, temperature and growth experienced, size trajectories, age structure, survival decomposition, movement, and reproduction.
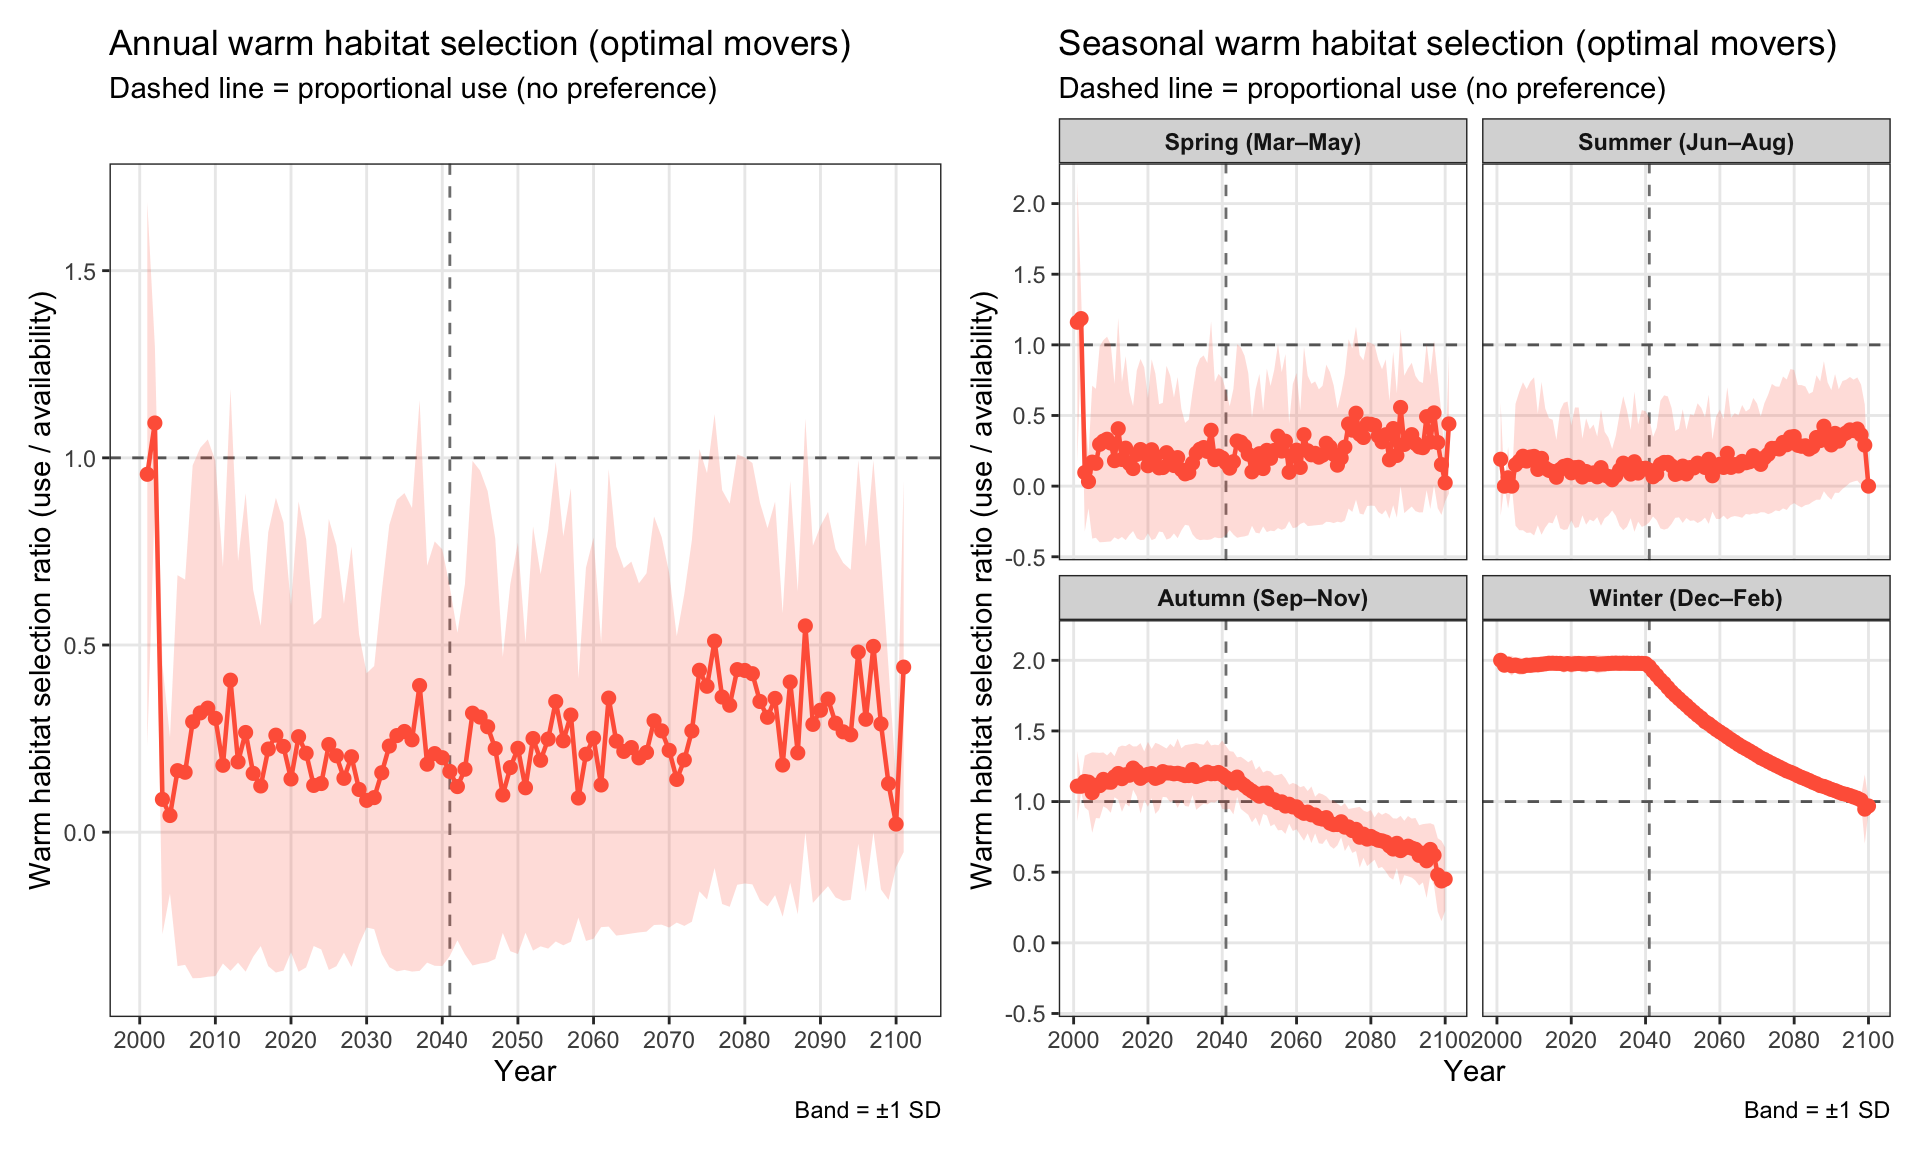
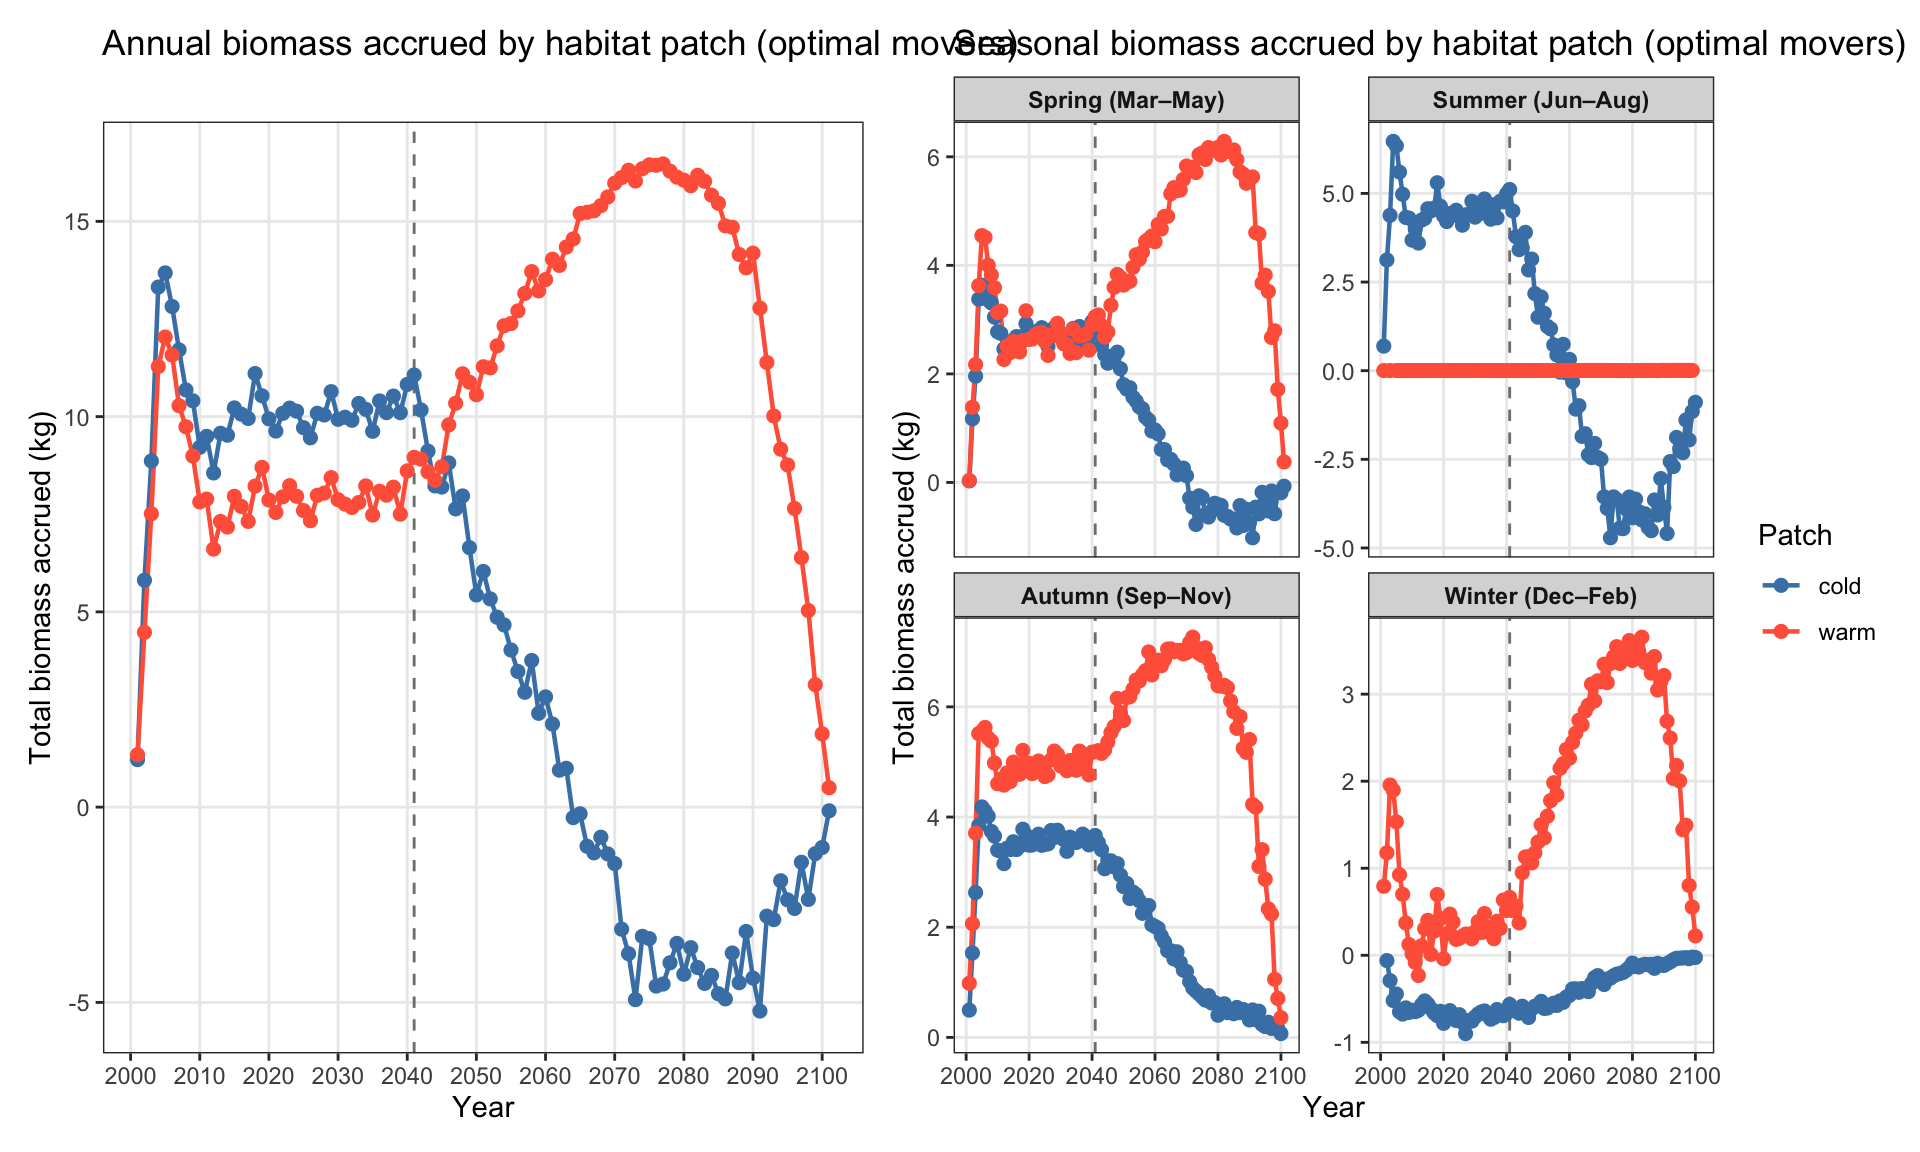
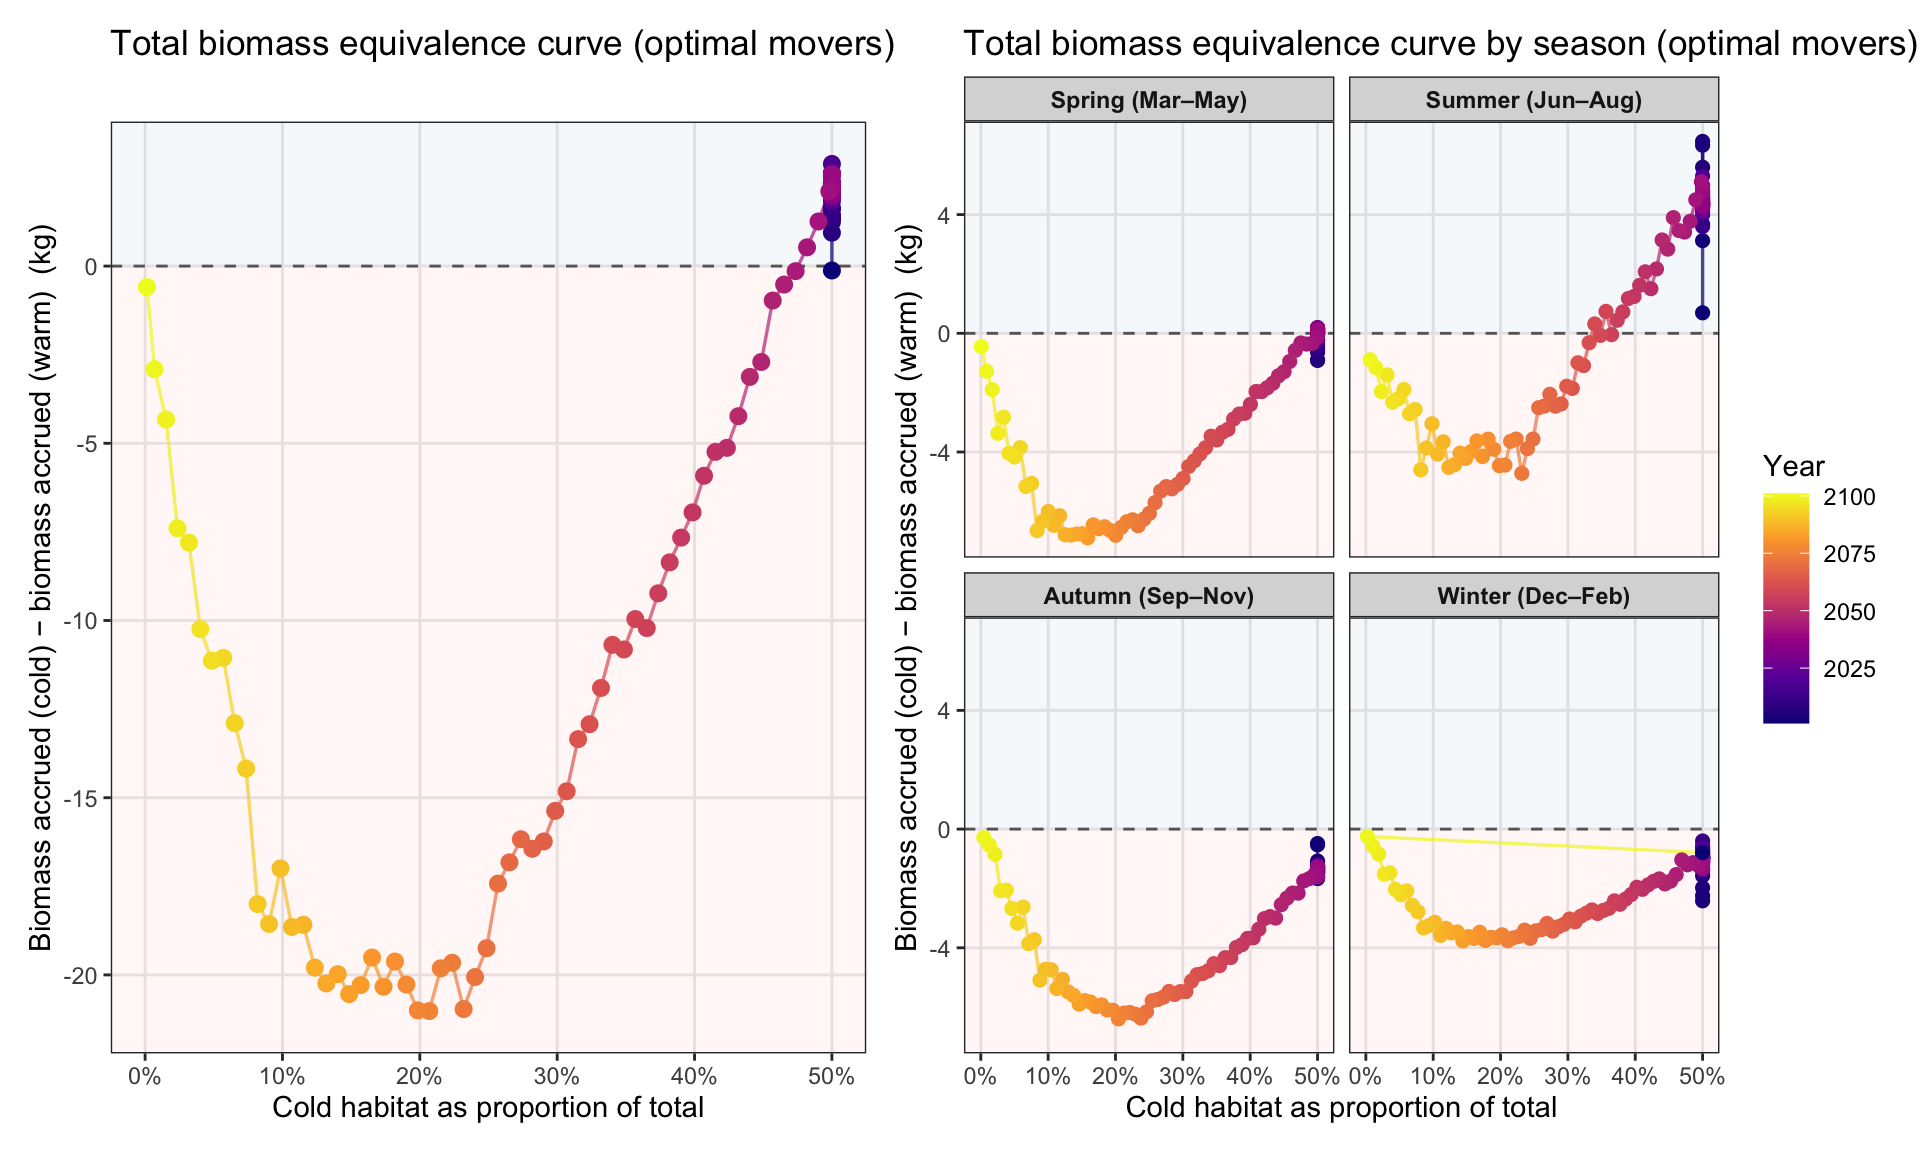
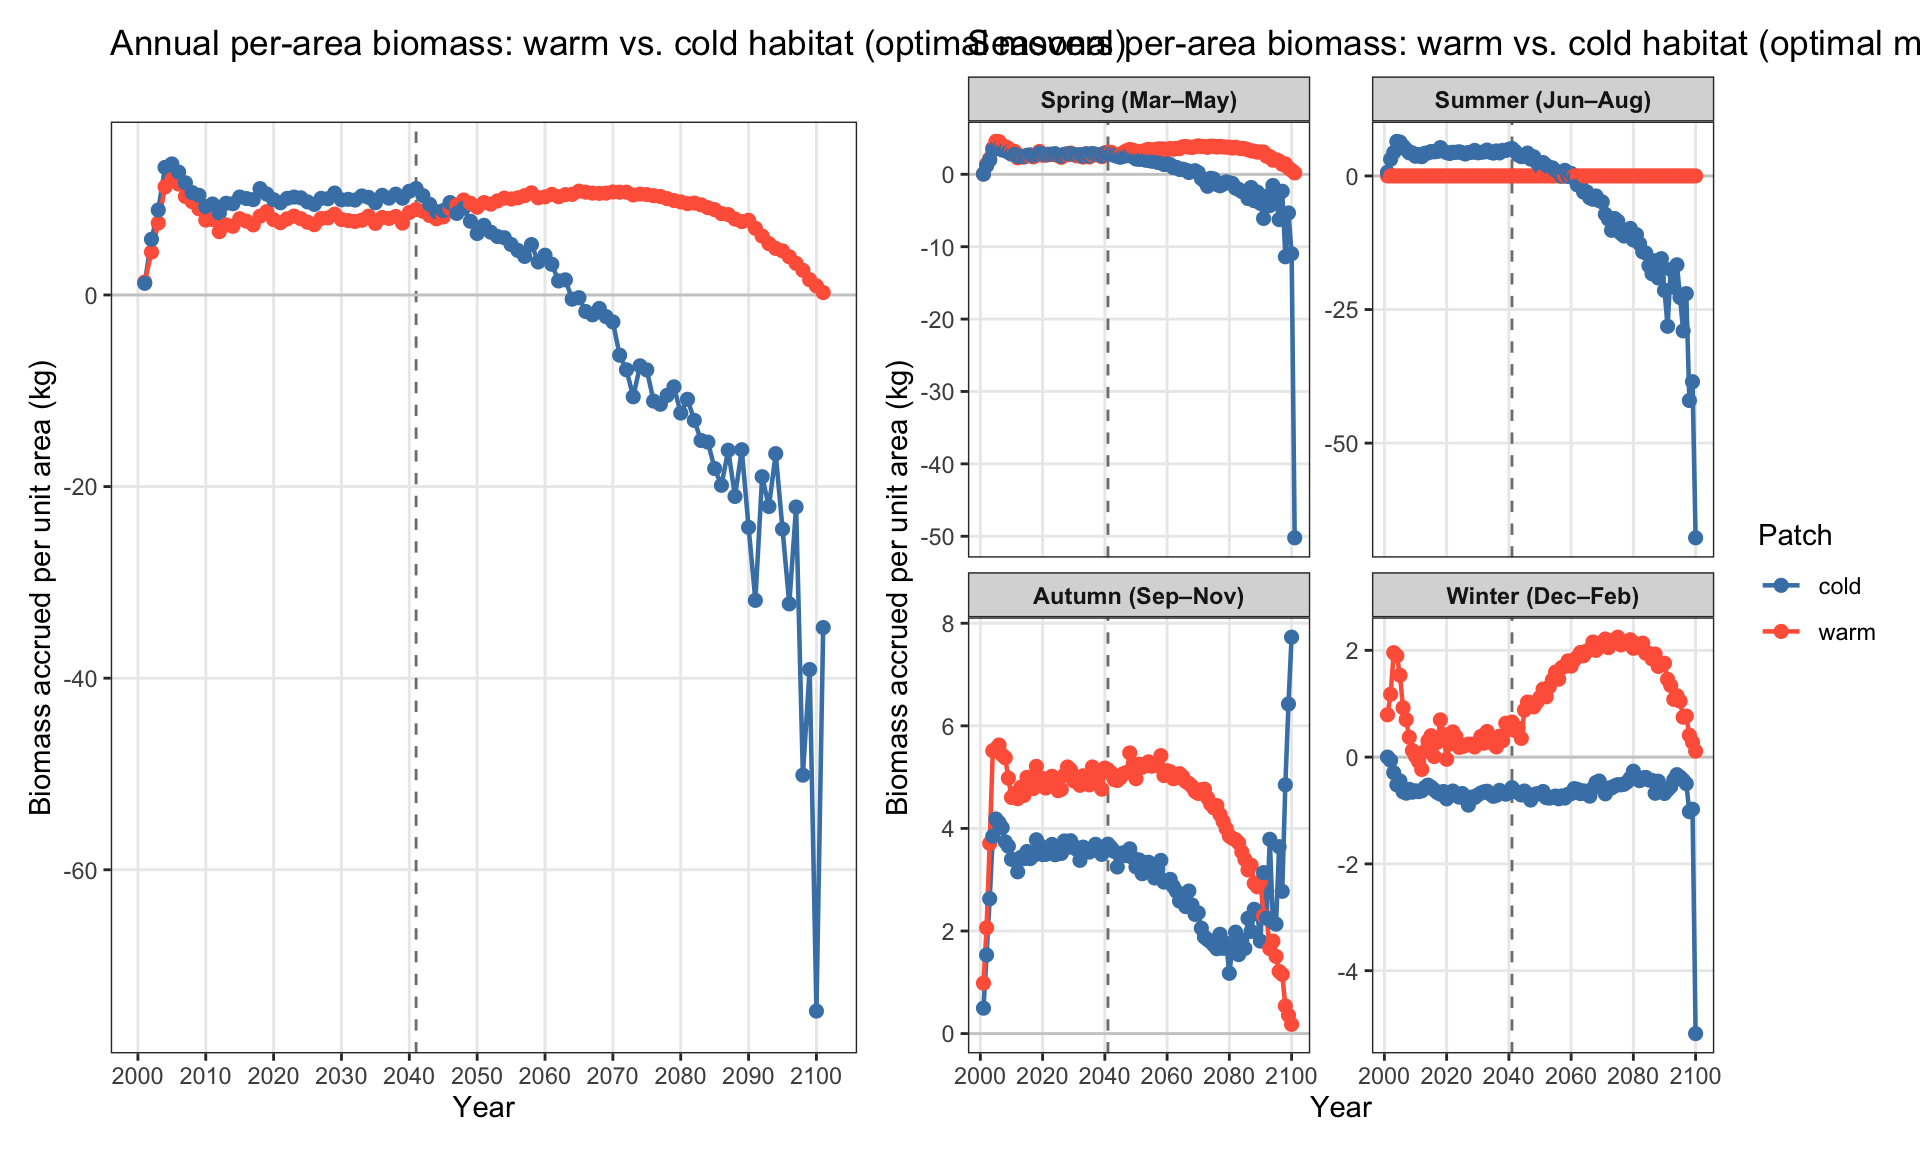
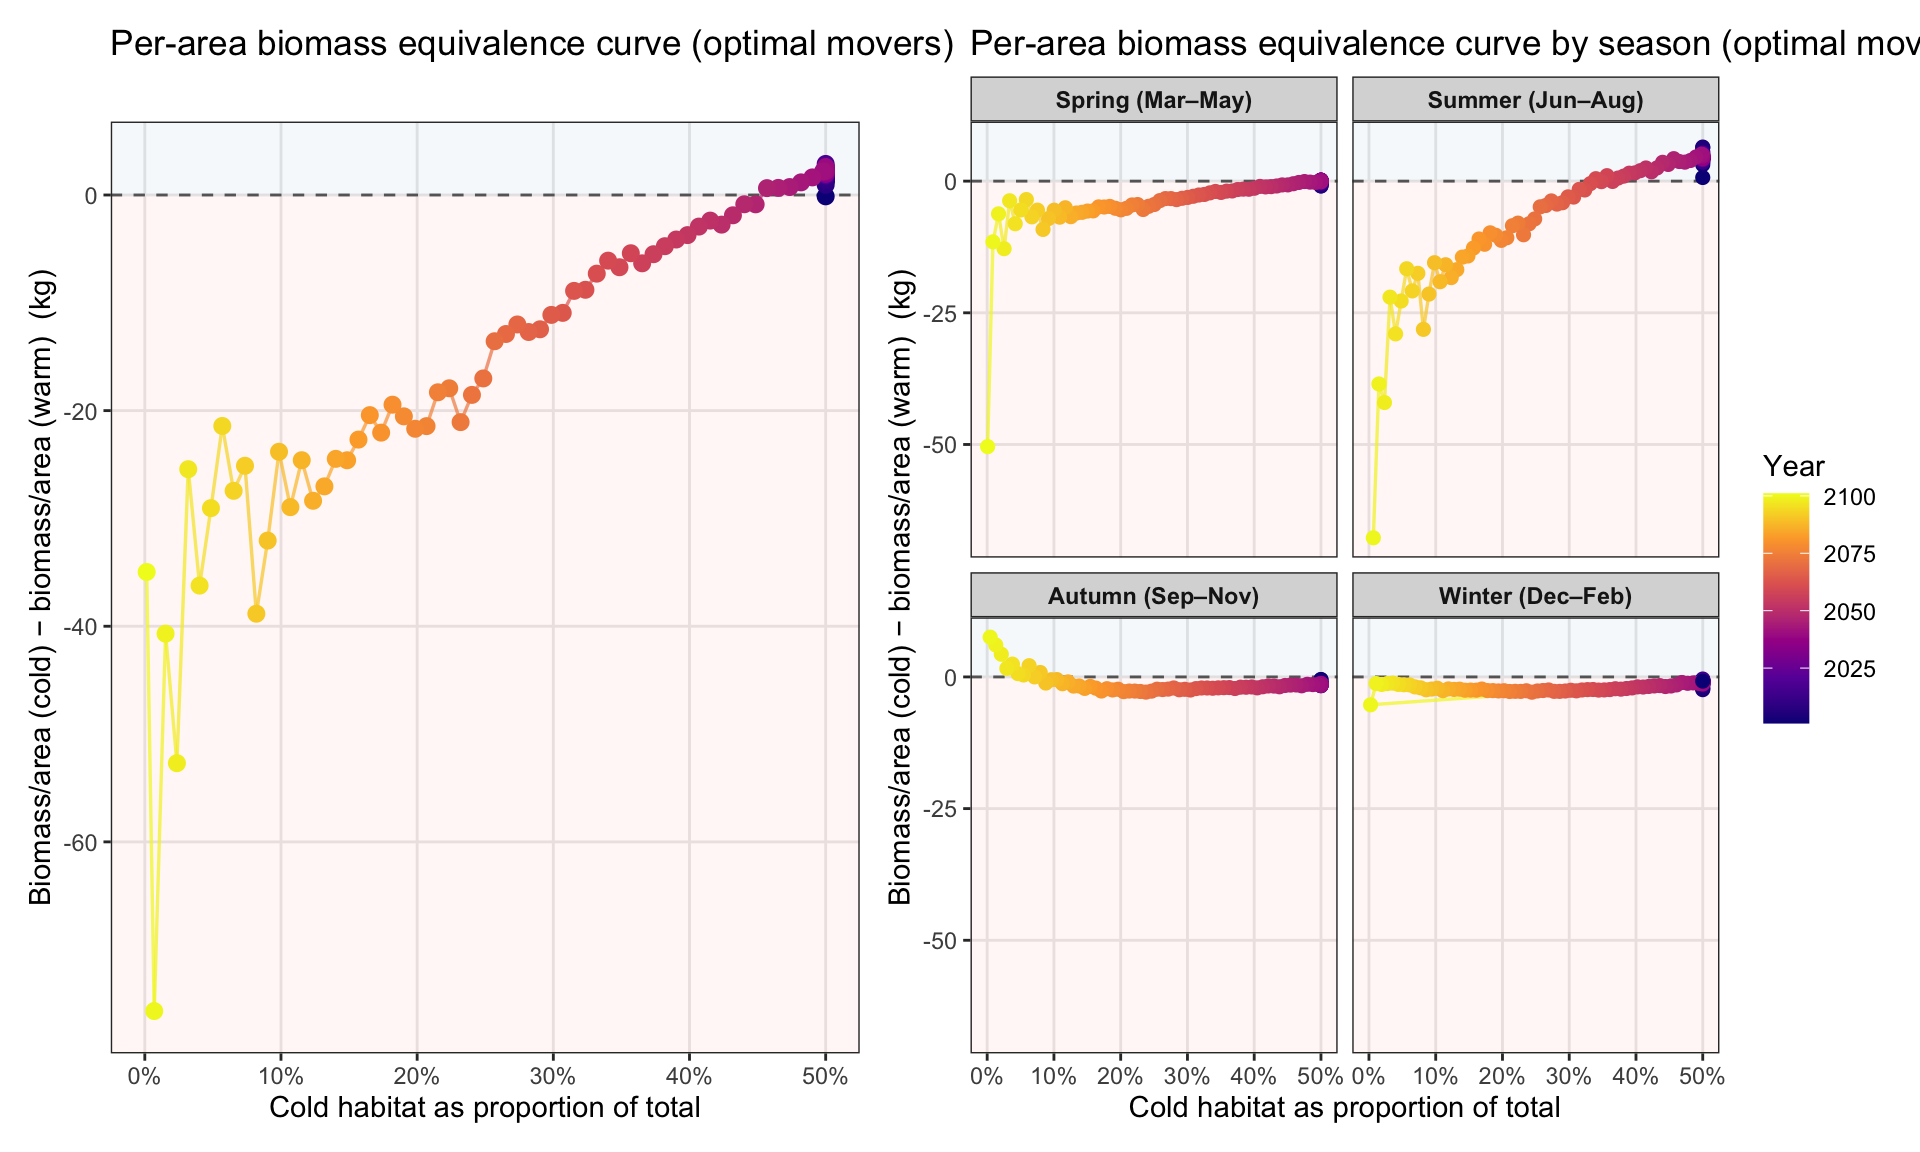
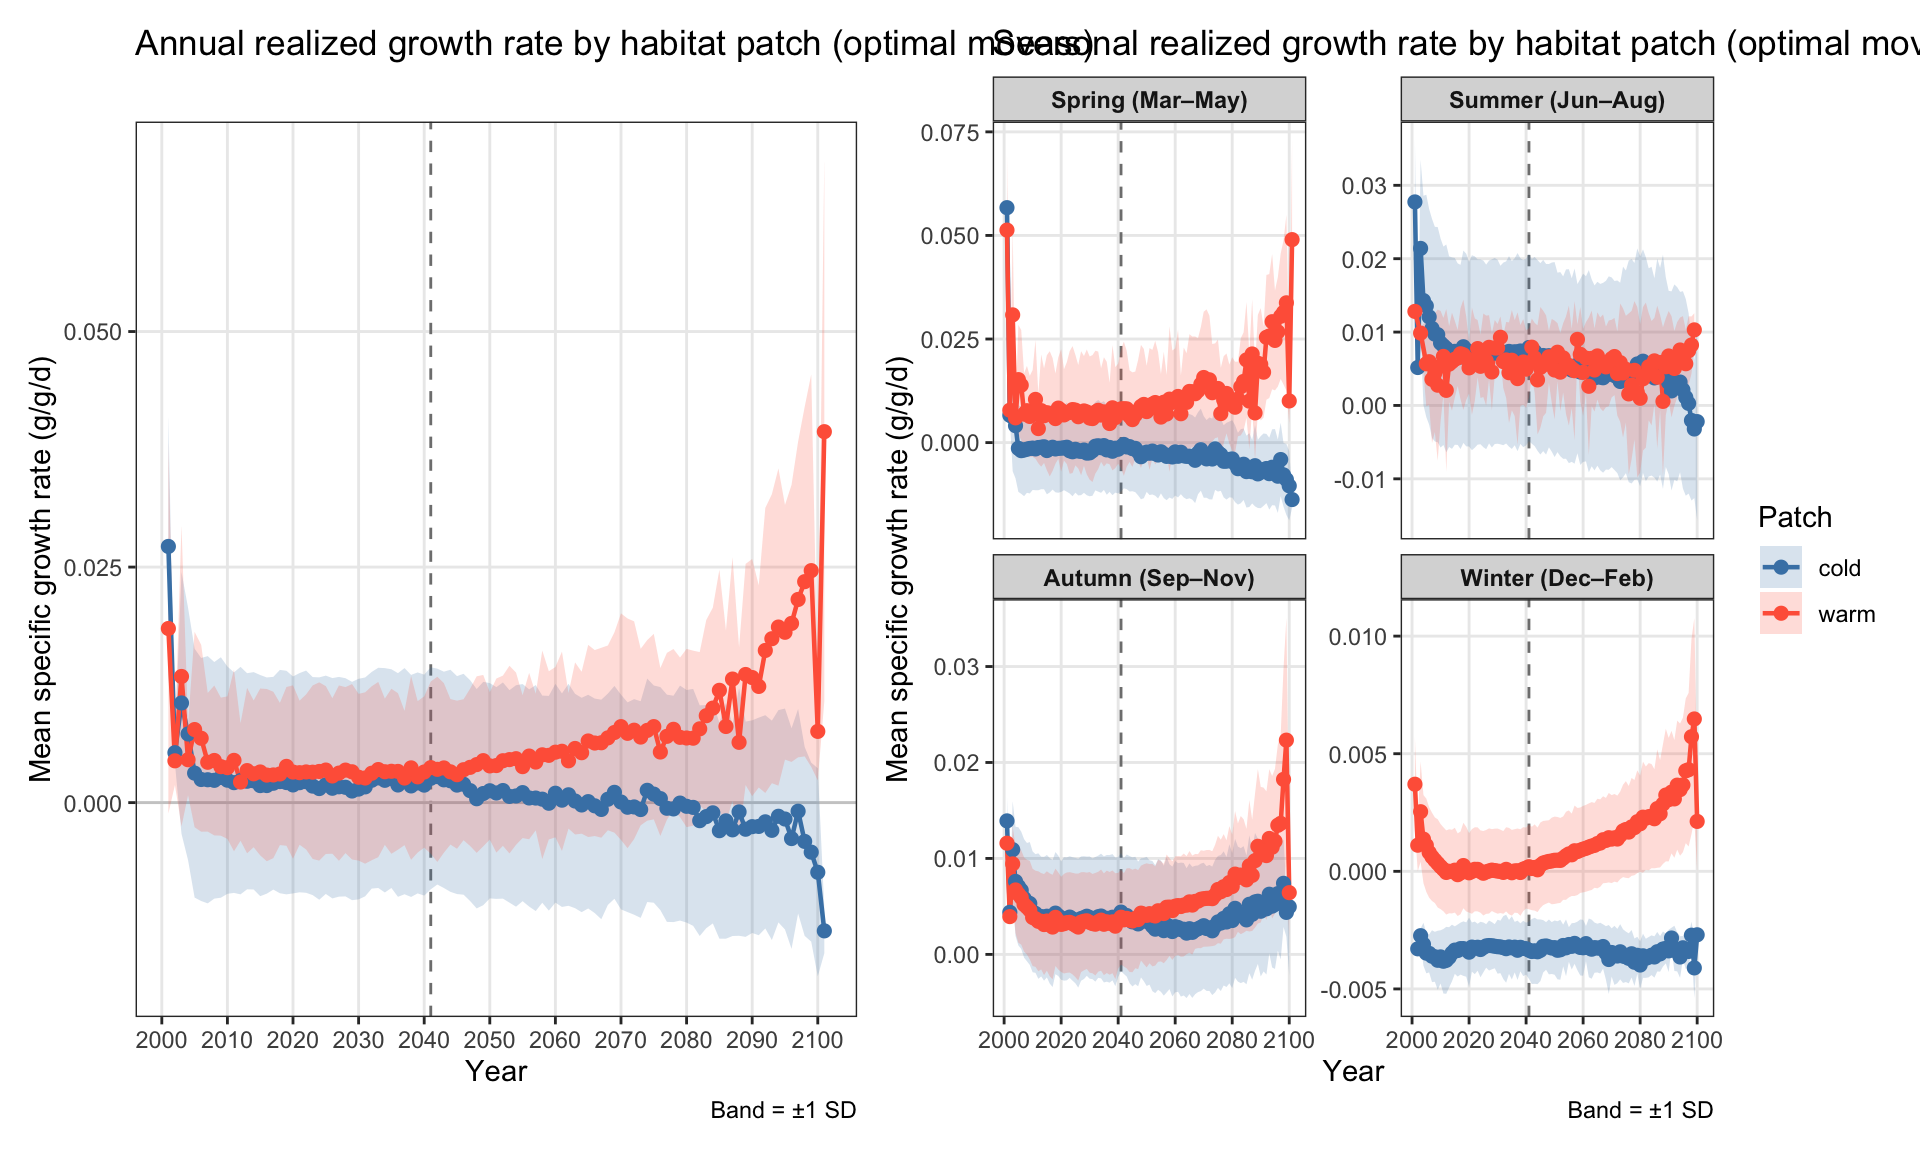
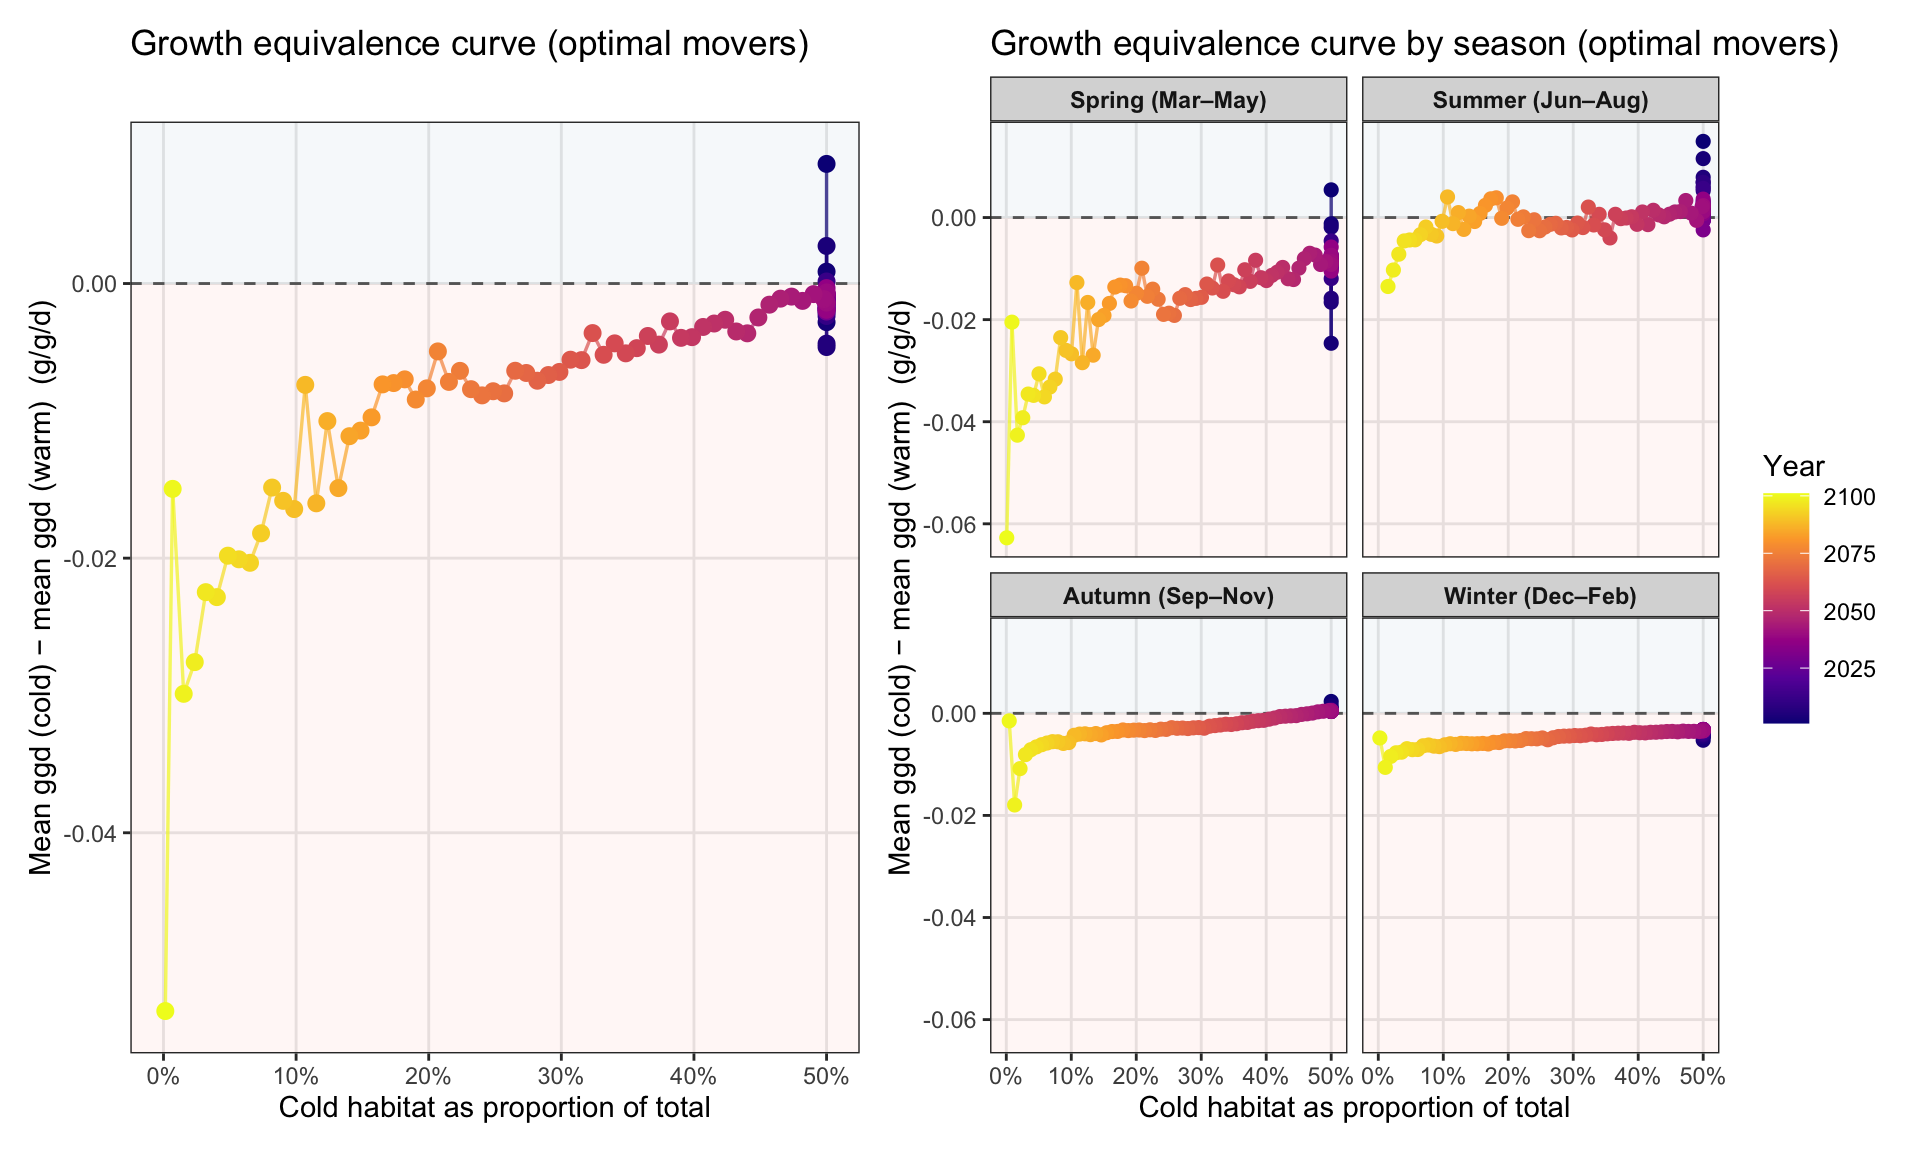
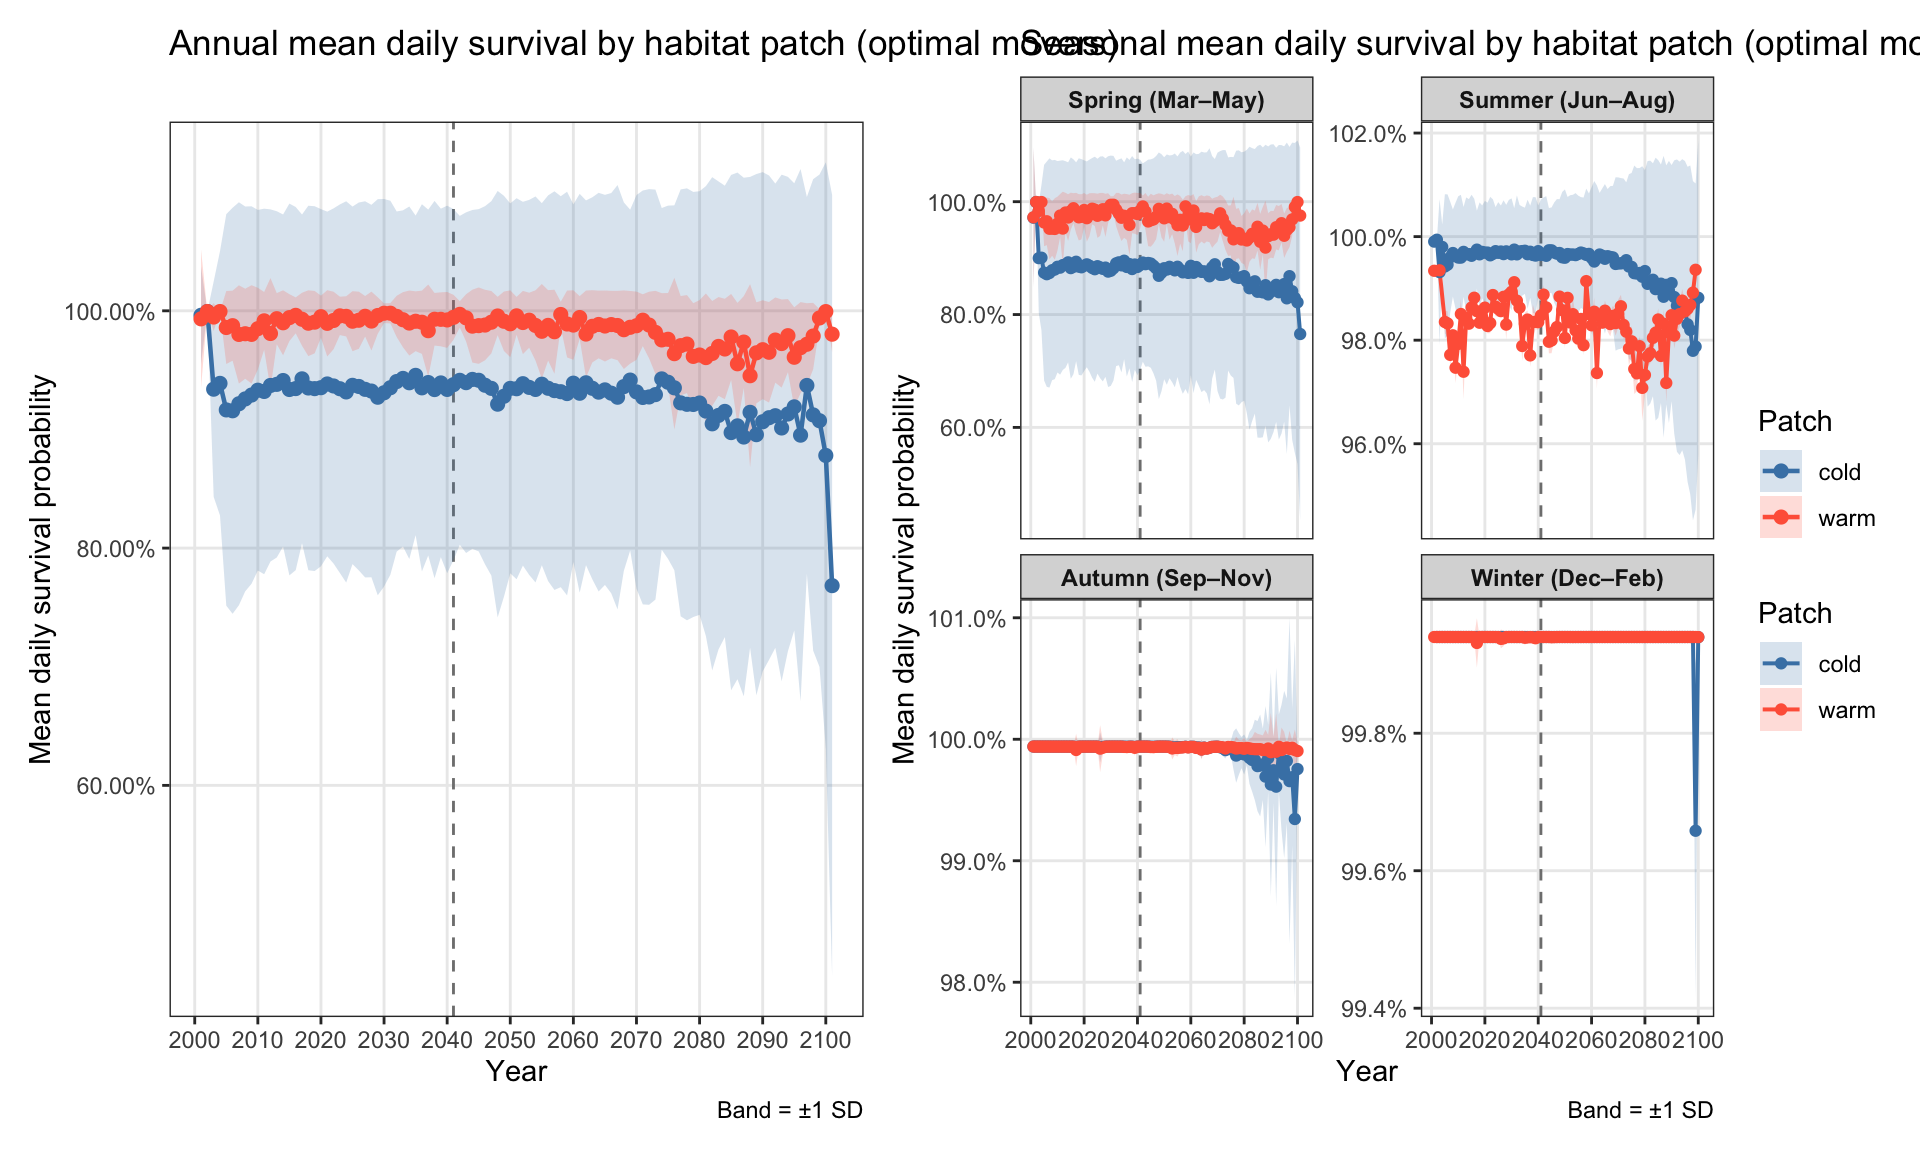
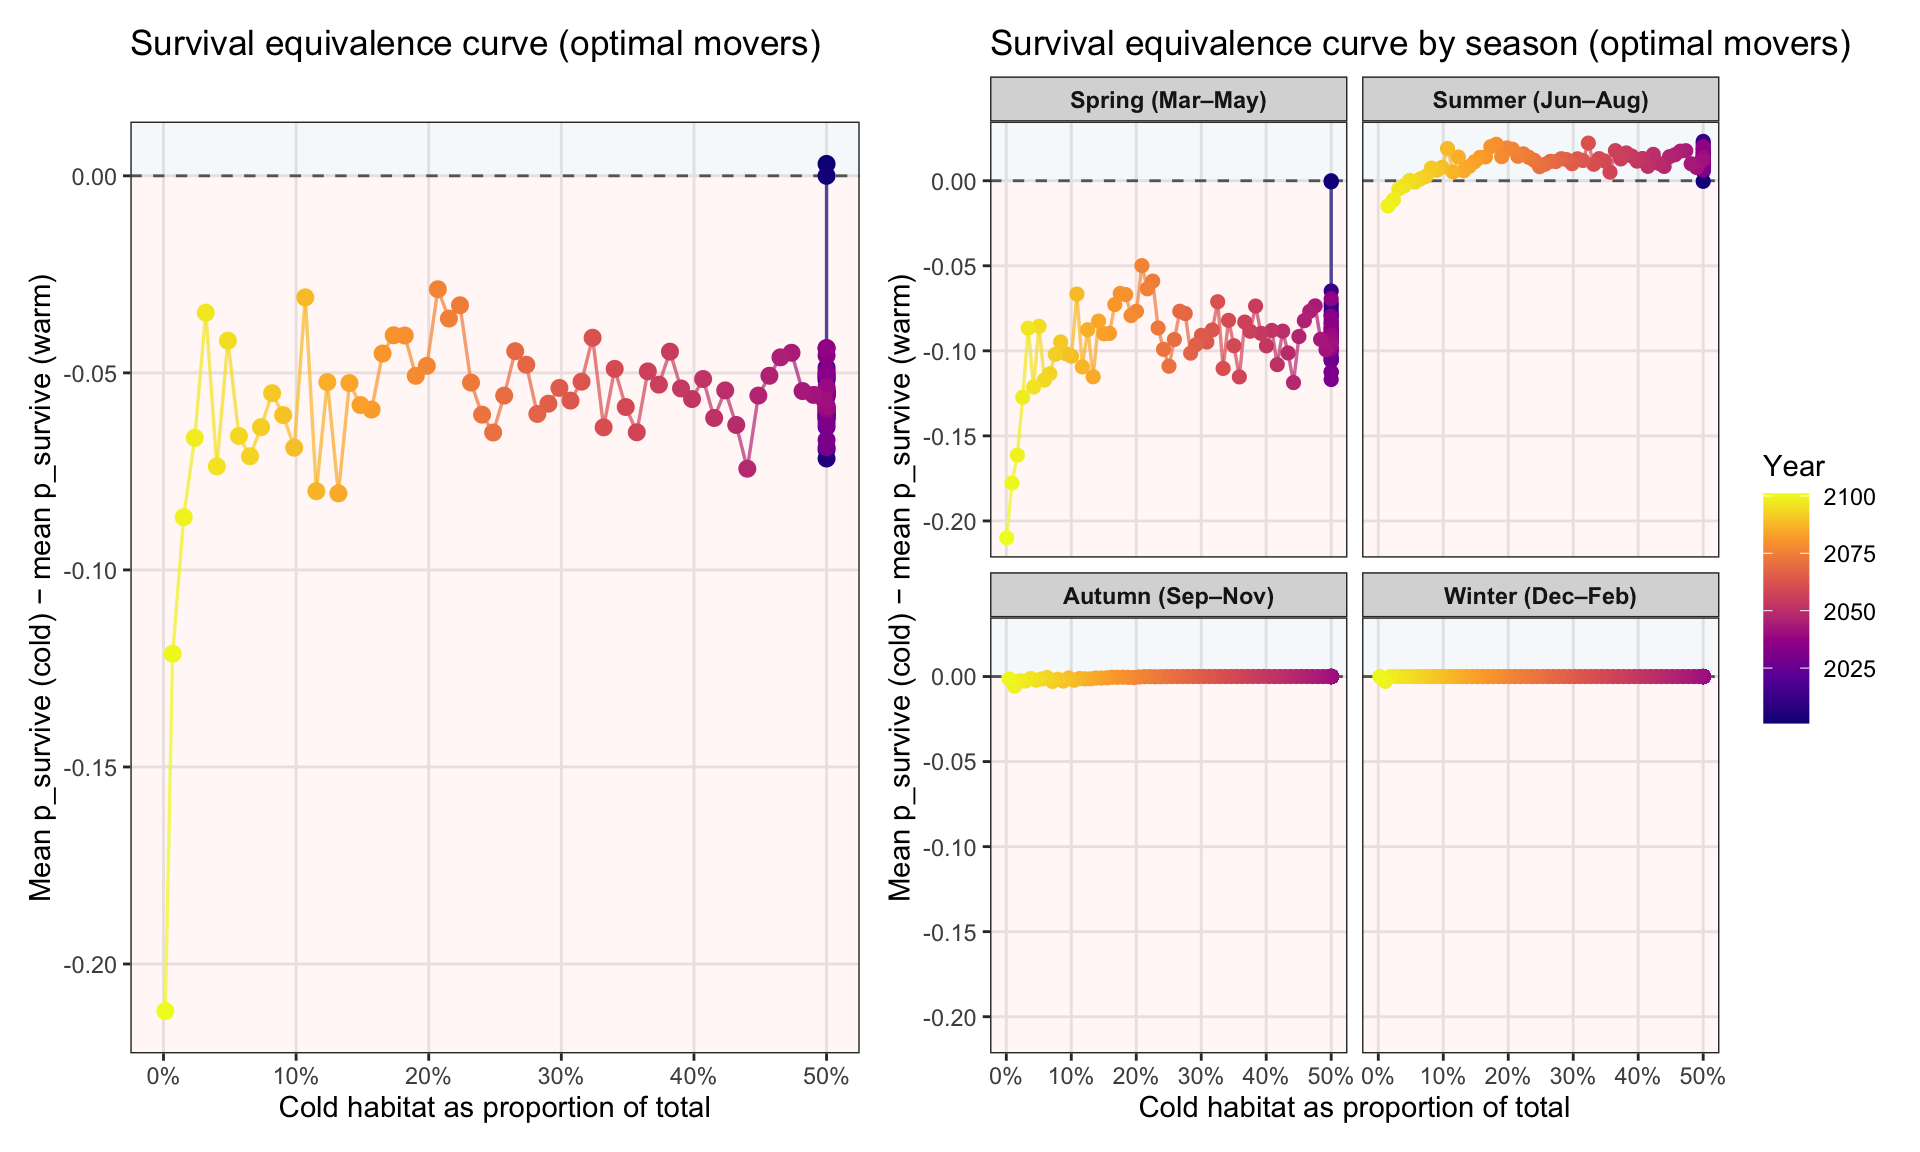
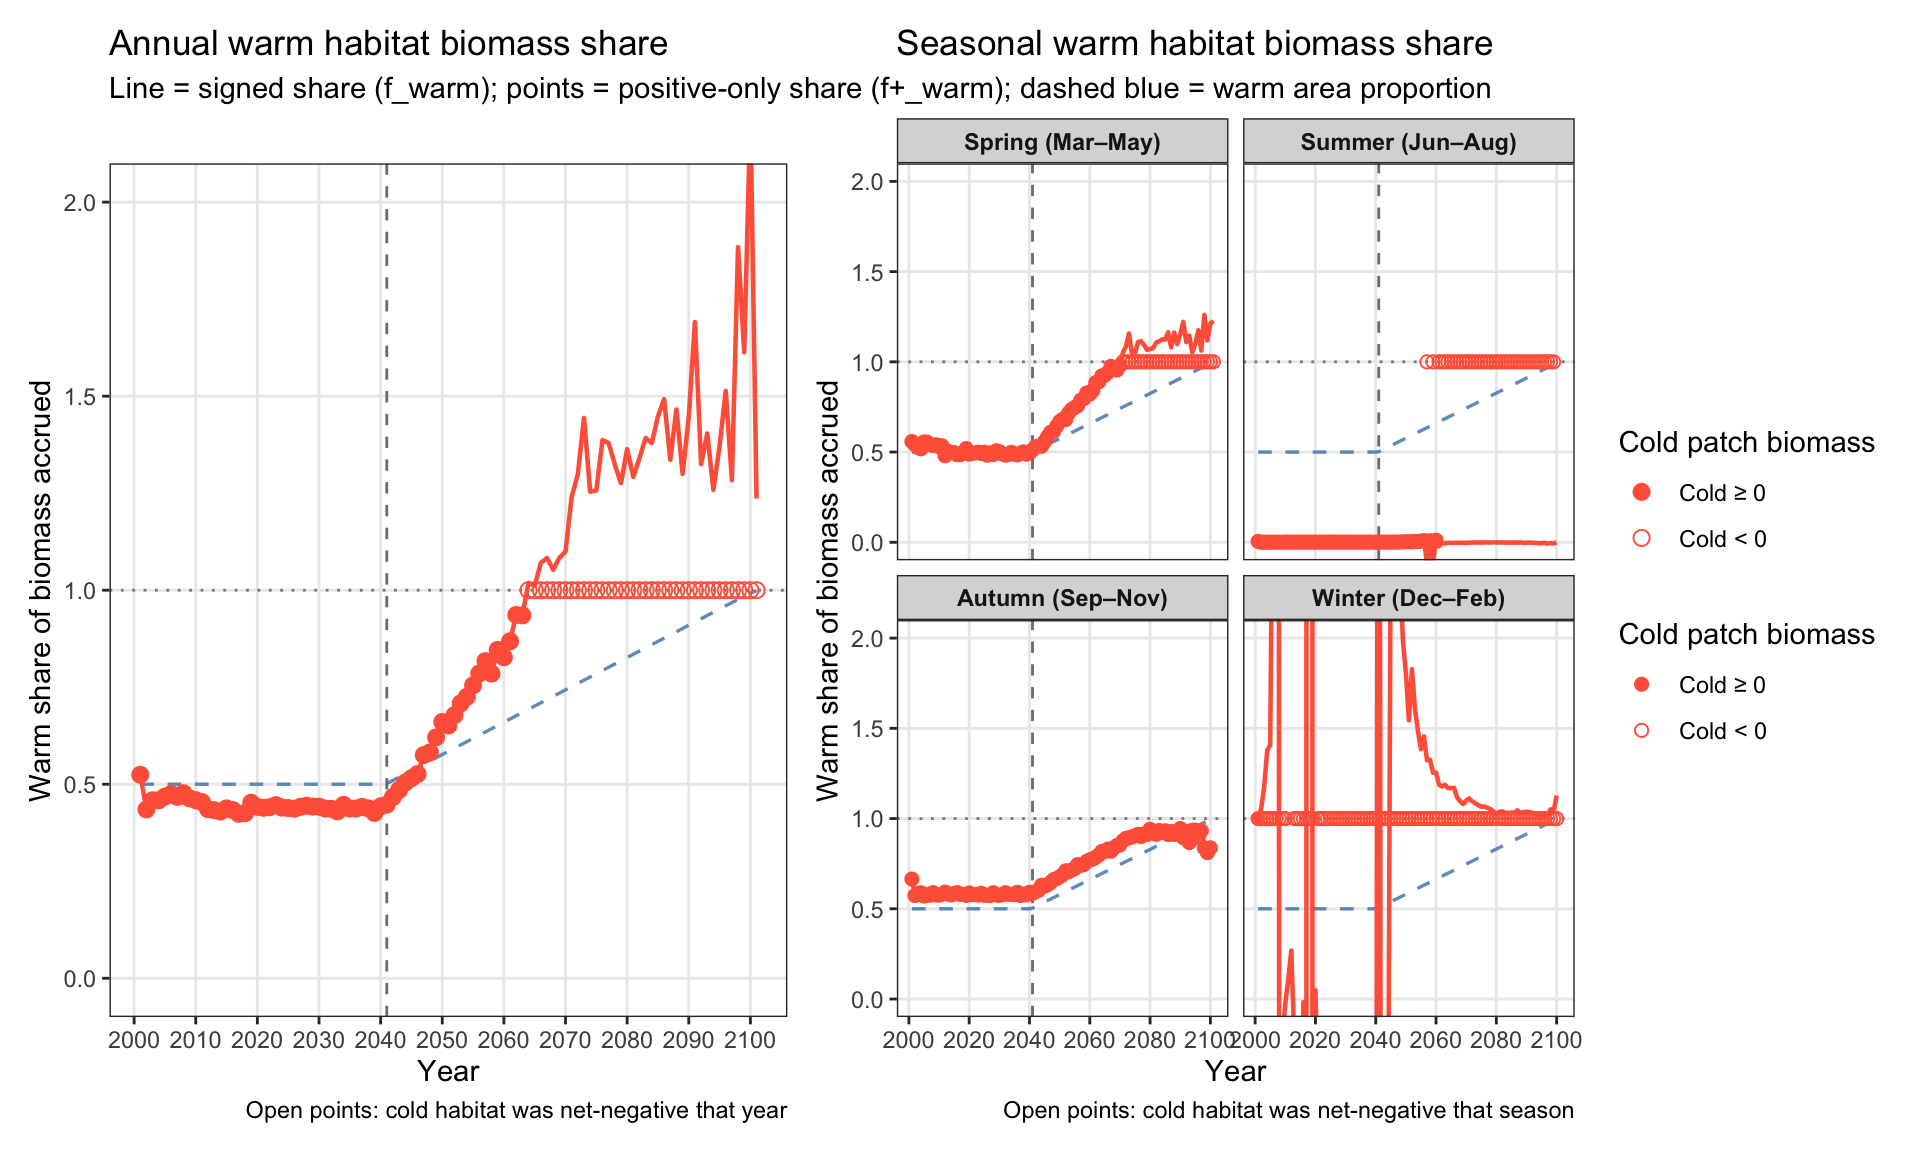
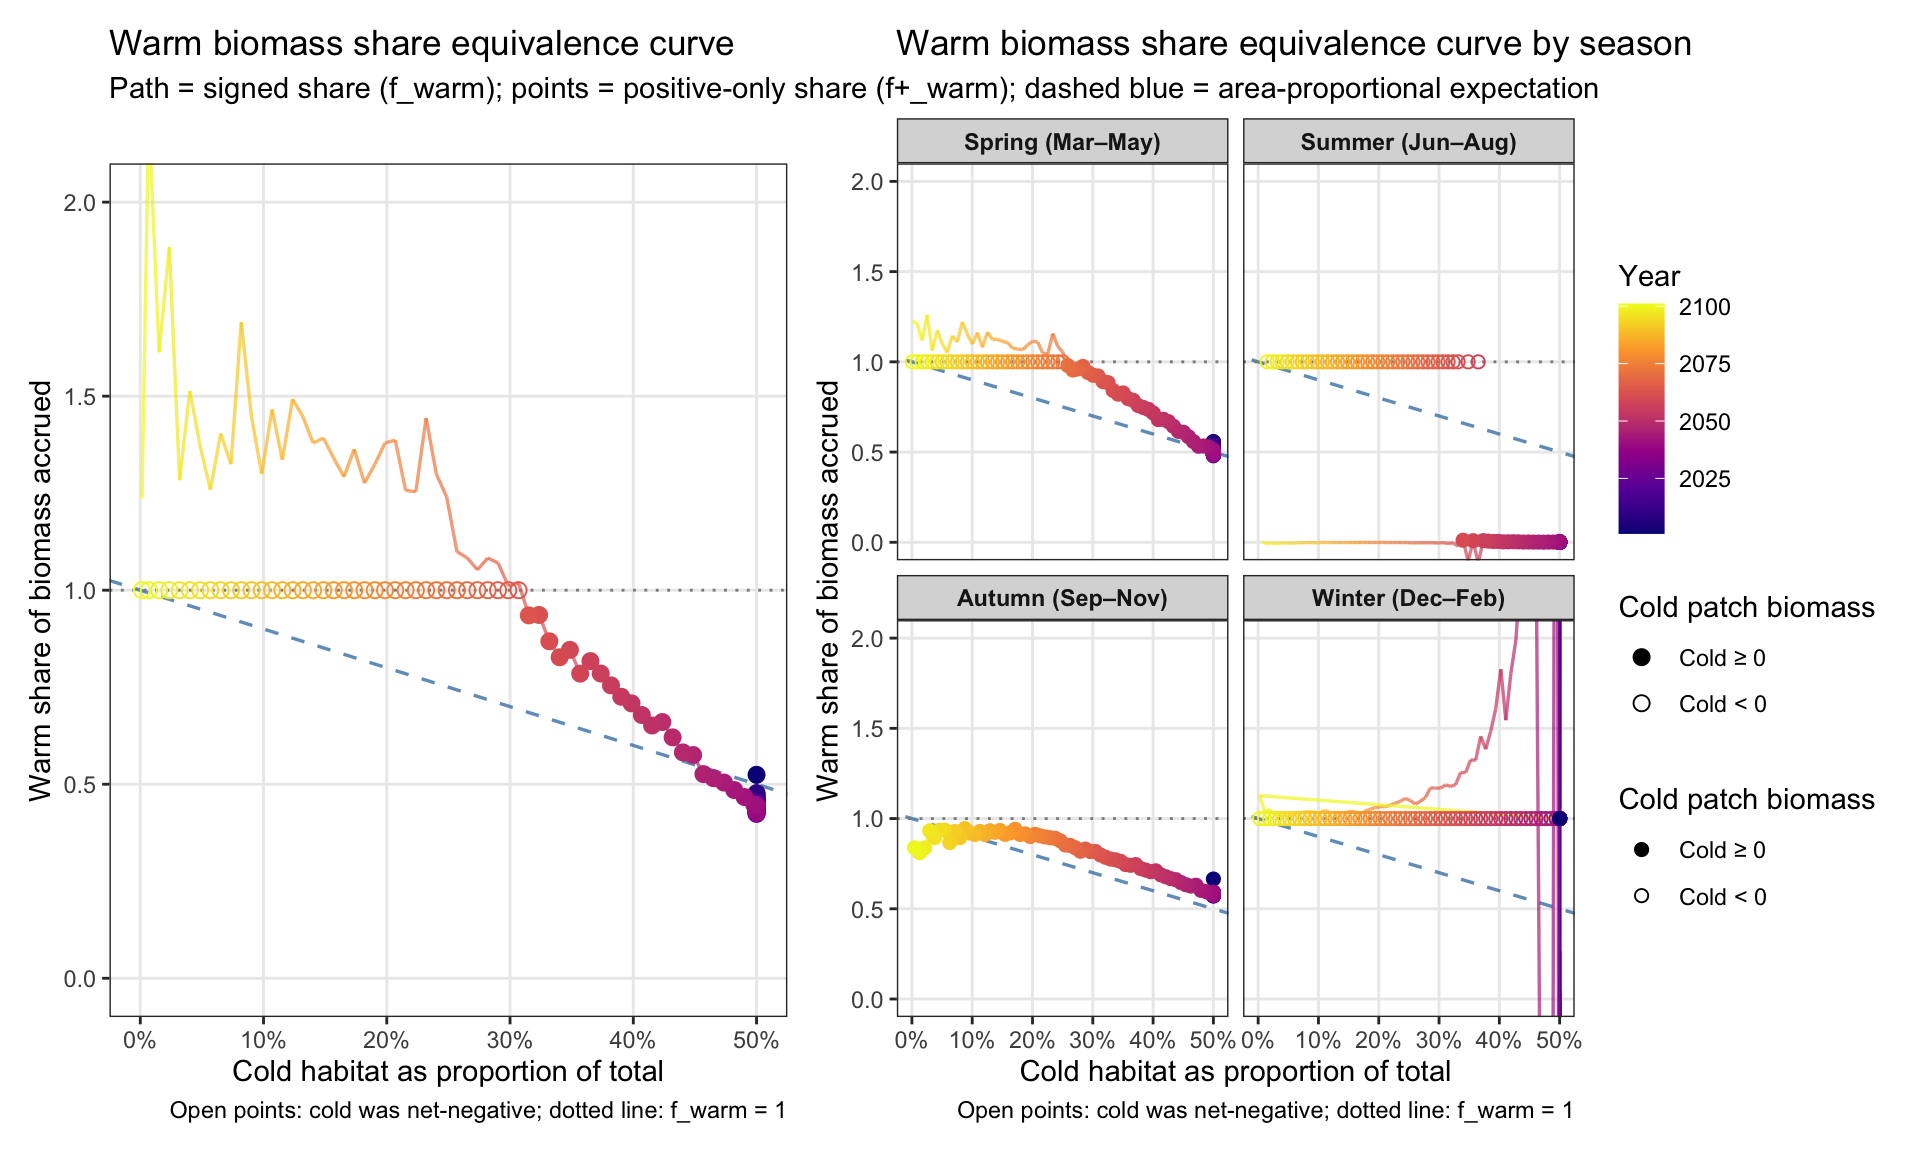
Patch occupancy, total biomass, per-area biomass, growth rate, and daily survival for optimal movers — shown as annual time series, seasonal time series, and equivalence curves.
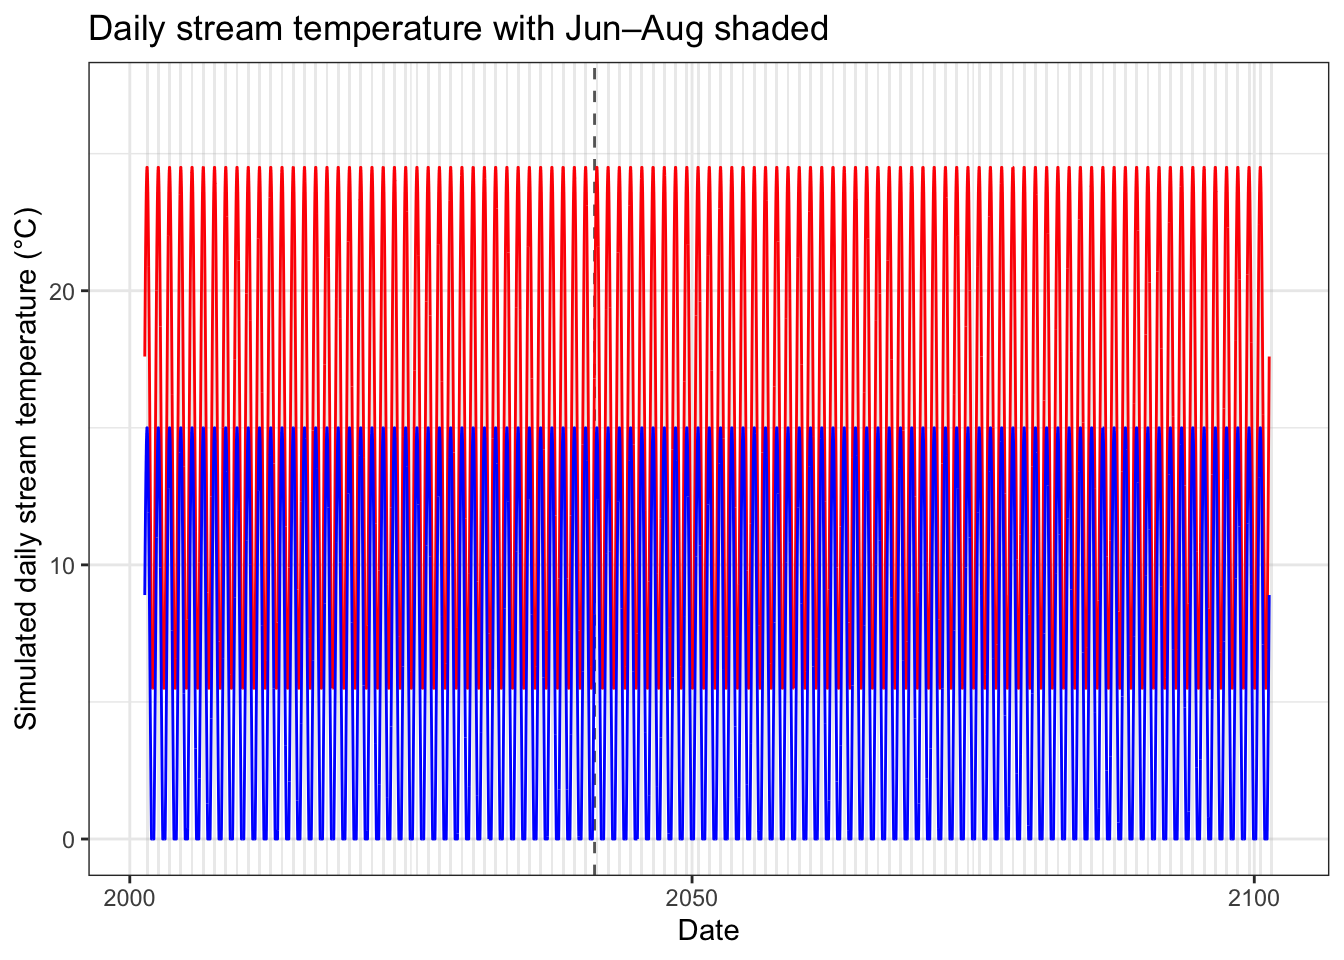
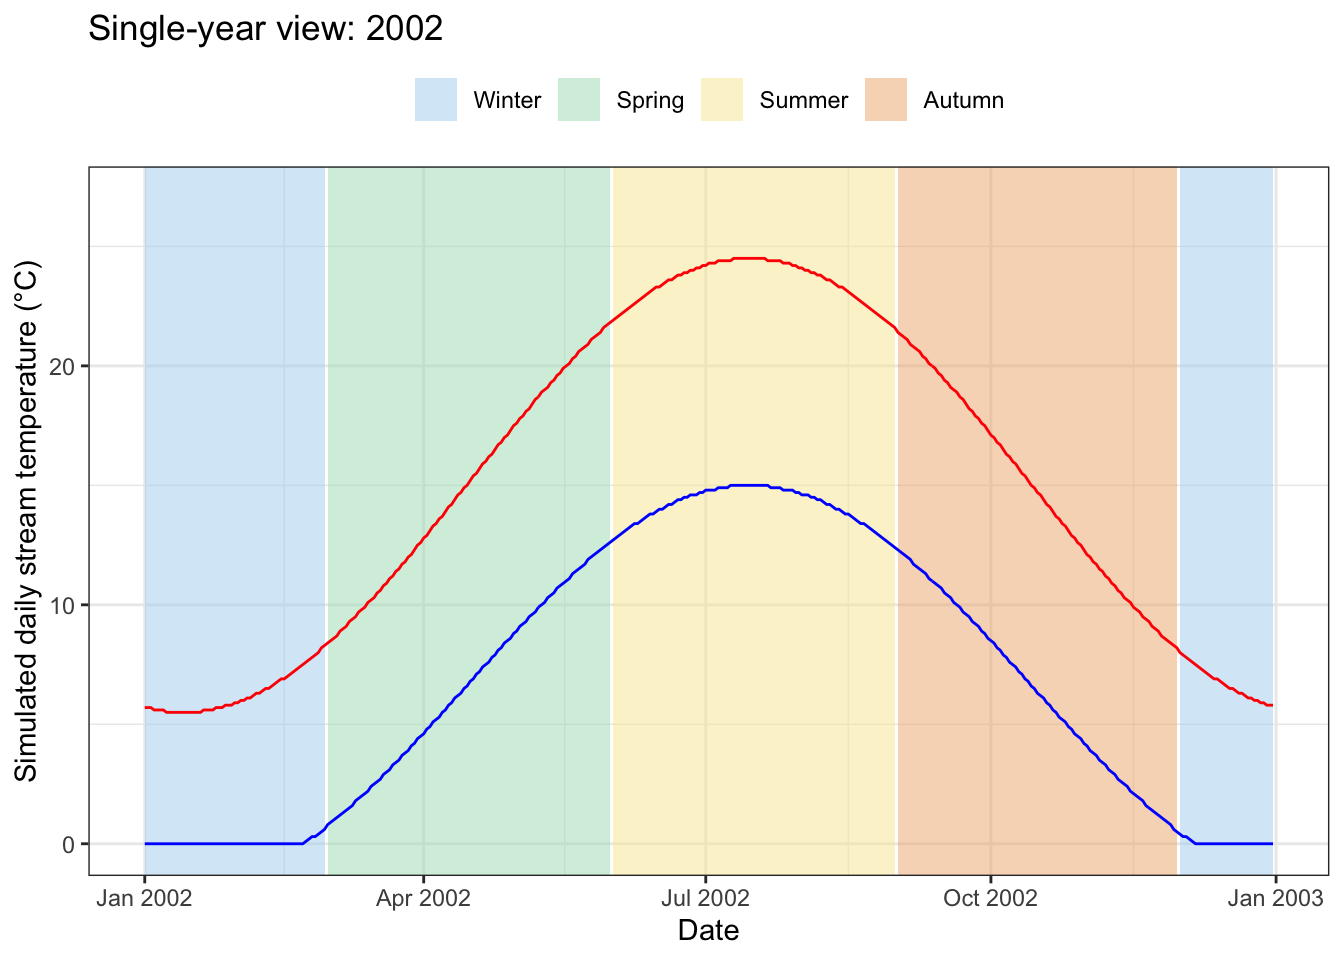
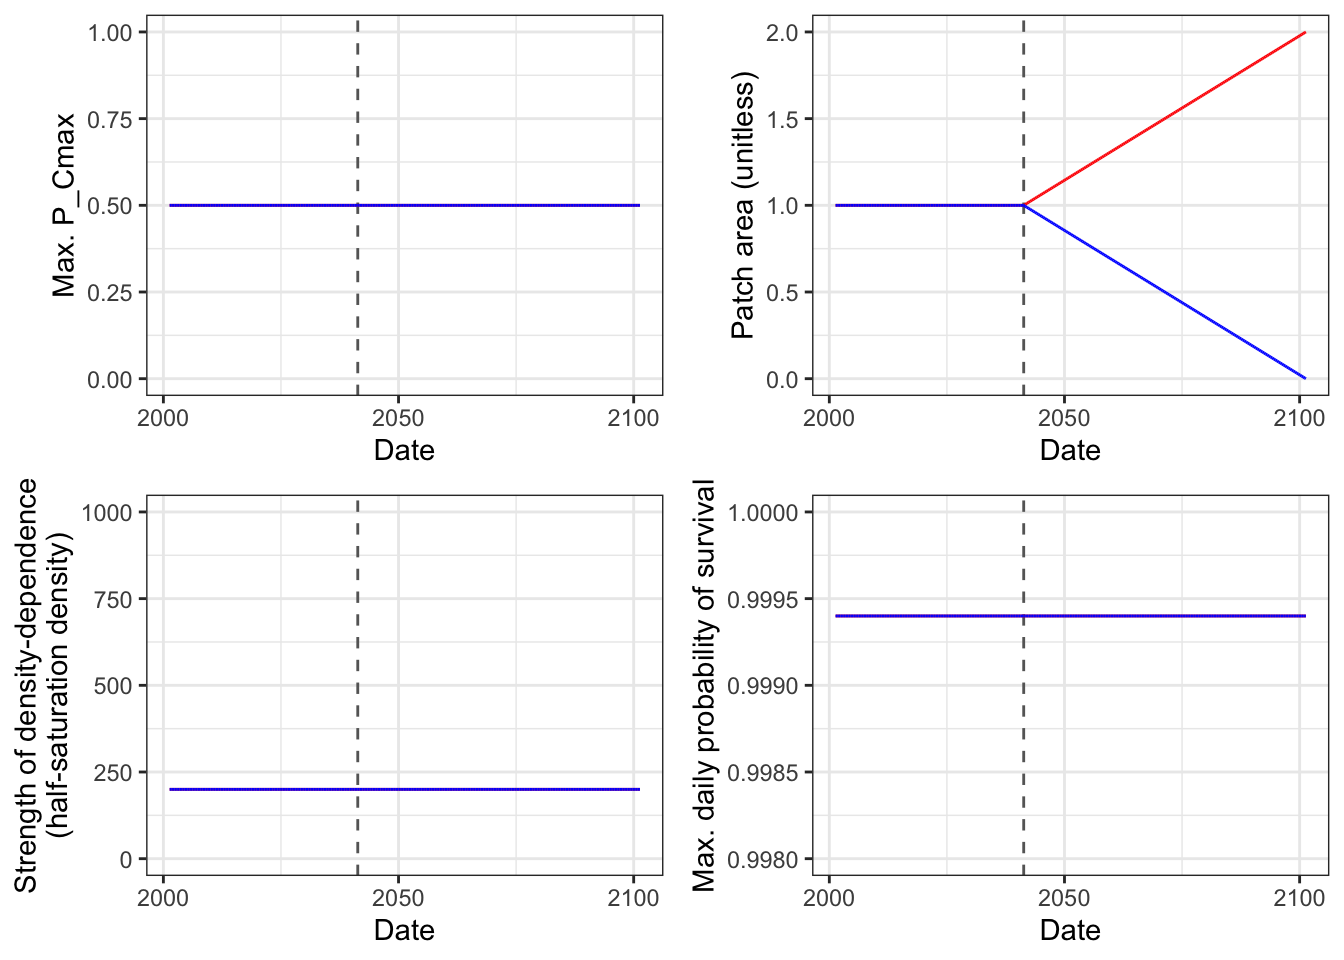
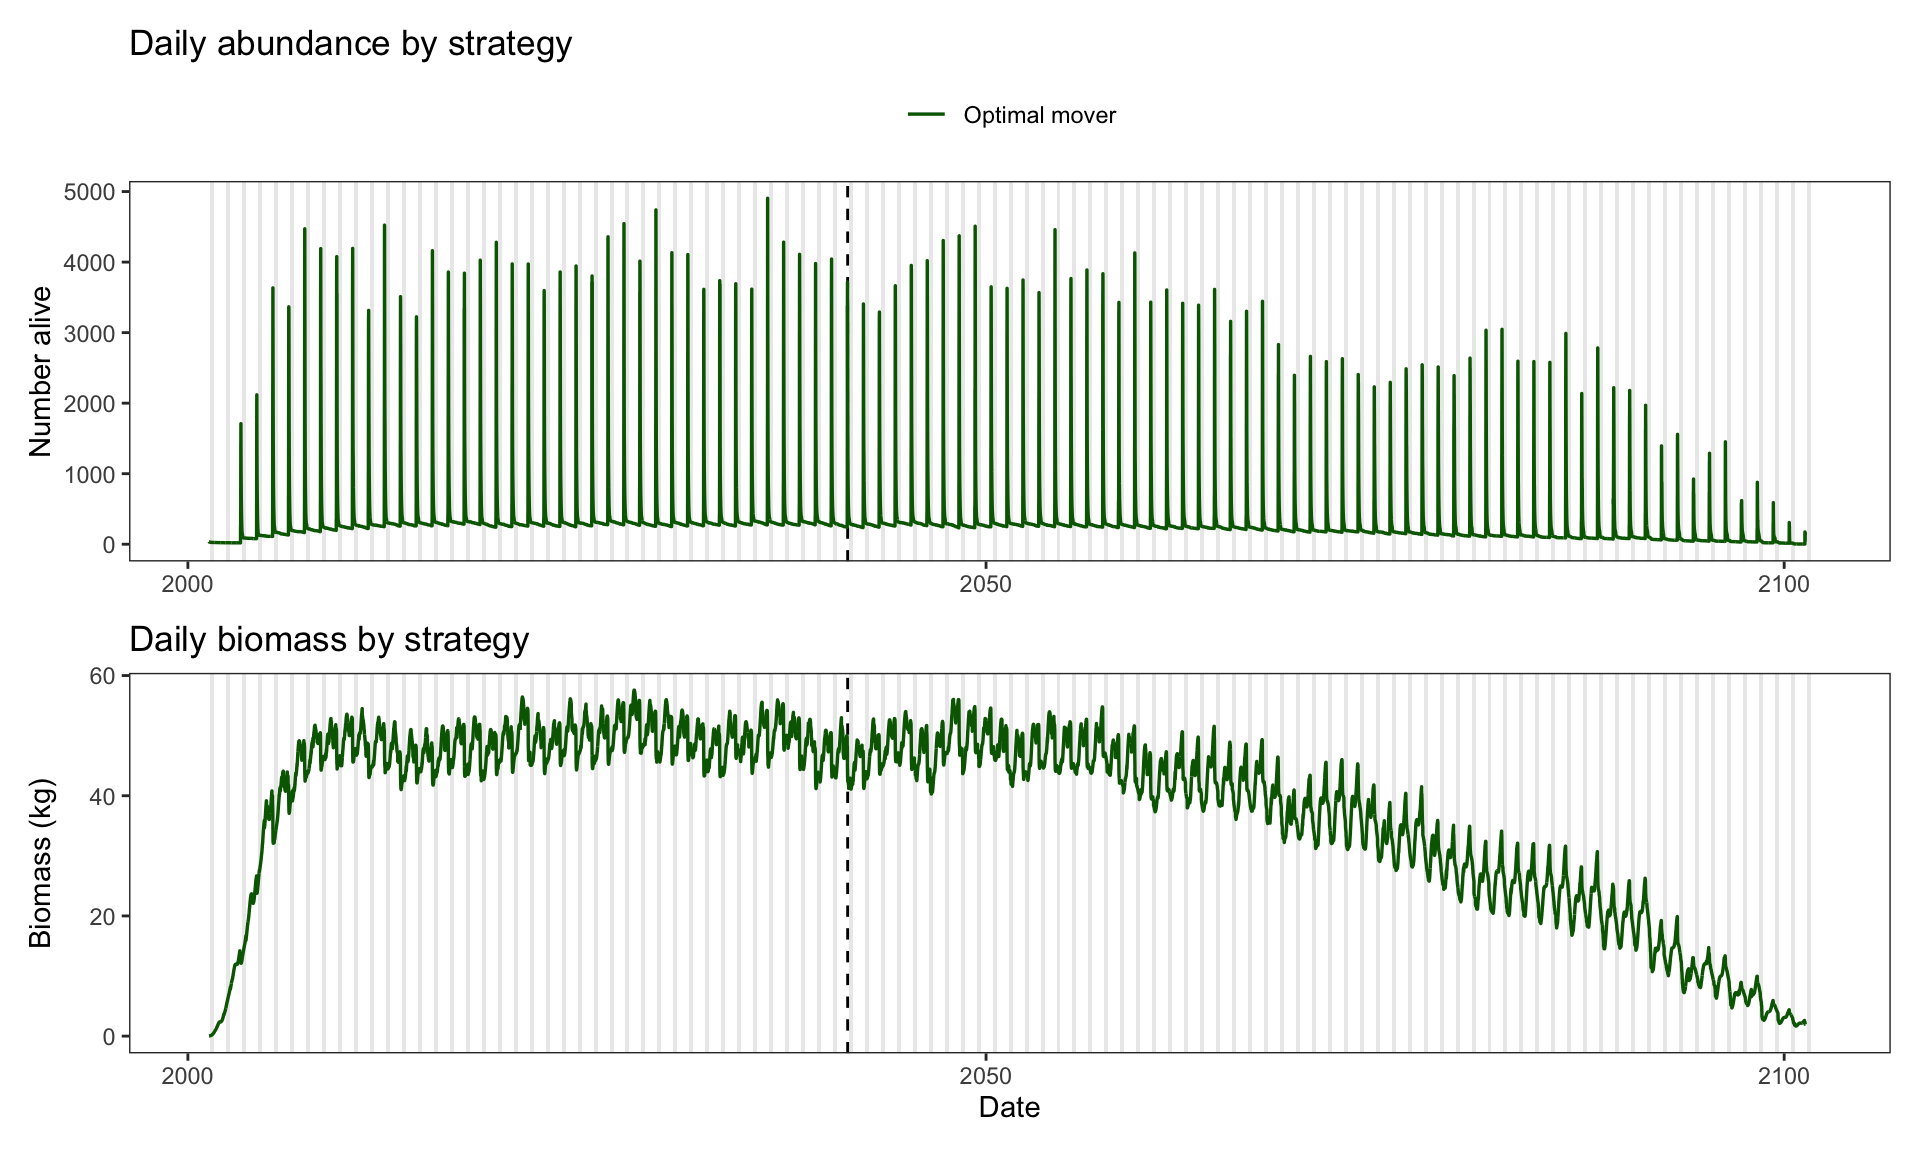
---title: "Offset temperature"---```{r, include = FALSE, cache = FALSE}library(tidyverse)library(lubridate)library(ggpubr)library(egg)library(RColorBrewer)library(ggridges)library(patchwork)library(scales)source("Functions.R")source("PlotResults.R")```**Purpose:** This page provides the results for the `temp_offset` experiment/scenario:* Thermal regimes are offset of each other: warm habitat is 5–10 °C warmer than the cold habitat. Warm habitat persists overwinter.* Everything else is the same as the base parameter set.```{r}#| cache: falseres <-readRDS("results/temp_offset.rds")ibm_long <- res$ibm_longhabitat_df <- res$habitat_dffish_registry <- res$fish_registryspawn_log <- res$spawn_logsim_params <- res$paramsexp_start_date <- sim_params$mindate +years(sim_params$nyears_burnin)```## Show habitat ```{r}plot_habitat(habitat_df, exp_start_date)```## Mechanistic plotsIndividual-level bioenergetics, temperature and growth experienced, size trajectories, age structure, survival decomposition, movement, and reproduction.```{r eval=FALSE}#| fig-width: 10#| fig-height: 6plot_mechanistic(ibm_long = ibm_long,habitat_df = habitat_df,sim_params = sim_params,spawn_log = spawn_log,fish_registry = fish_registry,exp_start_date = exp_start_date)```## Population plotsDaily and annual abundance/biomass, age structure, weight-at-age, body-size distributions, survival, lambda, and cohort survivorship.```{r}#| fig-width: 10#| fig-height: 6plot_population(ibm_long = ibm_long,habitat_df = habitat_df,exp_start_date = exp_start_date)```## Habitat value plotsPatch occupancy, total biomass, per-area biomass, growth rate, and daily survival for optimal movers — shown as annual time series, seasonal time series, and equivalence curves.```{r}#| fig-width: 10#| fig-height: 6plot_patchvalue(ibm_long = ibm_long,habitat_df = habitat_df,exp_start_date = exp_start_date)```