---
title: "View Simulation Results"
---
```{r, include = FALSE, cache = FALSE}
library(tidyverse)
library(lubridate)
library(ggpubr)
library(egg)
library(RColorBrewer)
library(ggridges)
library(patchwork)
library(scales)
source("Functions.R")
source("PlotResults.R")
```
**Purpose:** View raw simulation results of fixed habitat/equilibrium simulation runs.
```{r}
#| cache: false
## Null/cold only

# 95% cold
res           <- readRDS("results/TempOffset_ColdOnly_95percold.rds")
ibm_long_95null   <- res$ibm_long
habitat_df_95null <- res$habitat_df

# 75% cold
res           <- readRDS("results/TempOffset_ColdOnly_75percold.rds")
ibm_long_75null   <- res$ibm_long
habitat_df_75null <- res$habitat_df

# 50% cold
res           <- readRDS("results/TempOffset_ColdOnly_50percold.rds")
ibm_long_50null   <- res$ibm_long
habitat_df_50null <- res$habitat_df

# 25% cold
res           <- readRDS("results/TempOffset_ColdOnly_25percold.rds")
ibm_long_25null   <- res$ibm_long
habitat_df_25null <- res$habitat_df

# 5% cold
res           <- readRDS("results/TempOffset_ColdOnly_05percold.rds")
ibm_long_05null   <- res$ibm_long
habitat_df_05null <- res$habitat_df


## Cold + warm (same max pcmax)

# 95% cold / 5% warm
res           <- readRDS("results/TempOffset_ColdWarm_95percold.rds")
ibm_long_95   <- res$ibm_long
habitat_df_95 <- res$habitat_df

# 75% cold / 25% warm
res           <- readRDS("results/TempOffset_ColdWarm_75percold.rds")
ibm_long_75   <- res$ibm_long
habitat_df_75 <- res$habitat_df

# 50% cold / 50% warm
res           <- readRDS("results/TempOffset_ColdWarm_50percold.rds")
ibm_long_50   <- res$ibm_long
habitat_df_50 <- res$habitat_df

# 25% cold / 75% warm
res           <- readRDS("results/TempOffset_ColdWarm_25percold.rds")
ibm_long_25   <- res$ibm_long
habitat_df_25 <- res$habitat_df

# 5% cold / 95% warm
res           <- readRDS("results/TempOffset_ColdWarm_05percold.rds")
ibm_long_05   <- res$ibm_long
habitat_df_05 <- res$habitat_df


## Cold + warm (+0.1 max pcmax in warm)

# 95% cold / 5% warm
res           <- readRDS("results/TempOffset_ColdWarm_95percold_highPwarm.rds")
ibm_long_95_highpcm   <- res$ibm_long
habitat_df_95_highpcm <- res$habitat_df

# 75% cold / 25% warm
res           <- readRDS("results/TempOffset_ColdWarm_75percold_highPwarm.rds")
ibm_long_75_highpcm   <- res$ibm_long
habitat_df_75_highpcm <- res$habitat_df

# 50% cold / 50% warm
res           <- readRDS("results/TempOffset_ColdWarm_50percold_highPwarm.rds")
ibm_long_50_highpcm   <- res$ibm_long
habitat_df_50_highpcm <- res$habitat_df

# 25% cold / 75% warm
res           <- readRDS("results/TempOffset_ColdWarm_25percold_highPwarm.rds")
ibm_long_25_highpcm   <- res$ibm_long
habitat_df_25_highpcm <- res$habitat_df

# 5% cold / 95% warm
res           <- readRDS("results/TempOffset_ColdWarm_05percold_highPwarm.rds")
ibm_long_05_highpcm   <- res$ibm_long
habitat_df_05_highpcm <- res$habitat_df


sim_params    <- res$params
exp_start_date <- sim_params$mindate + years(sim_params$nyears_burnin)

rm(res)
```
## Null: cold only
### 95% cold
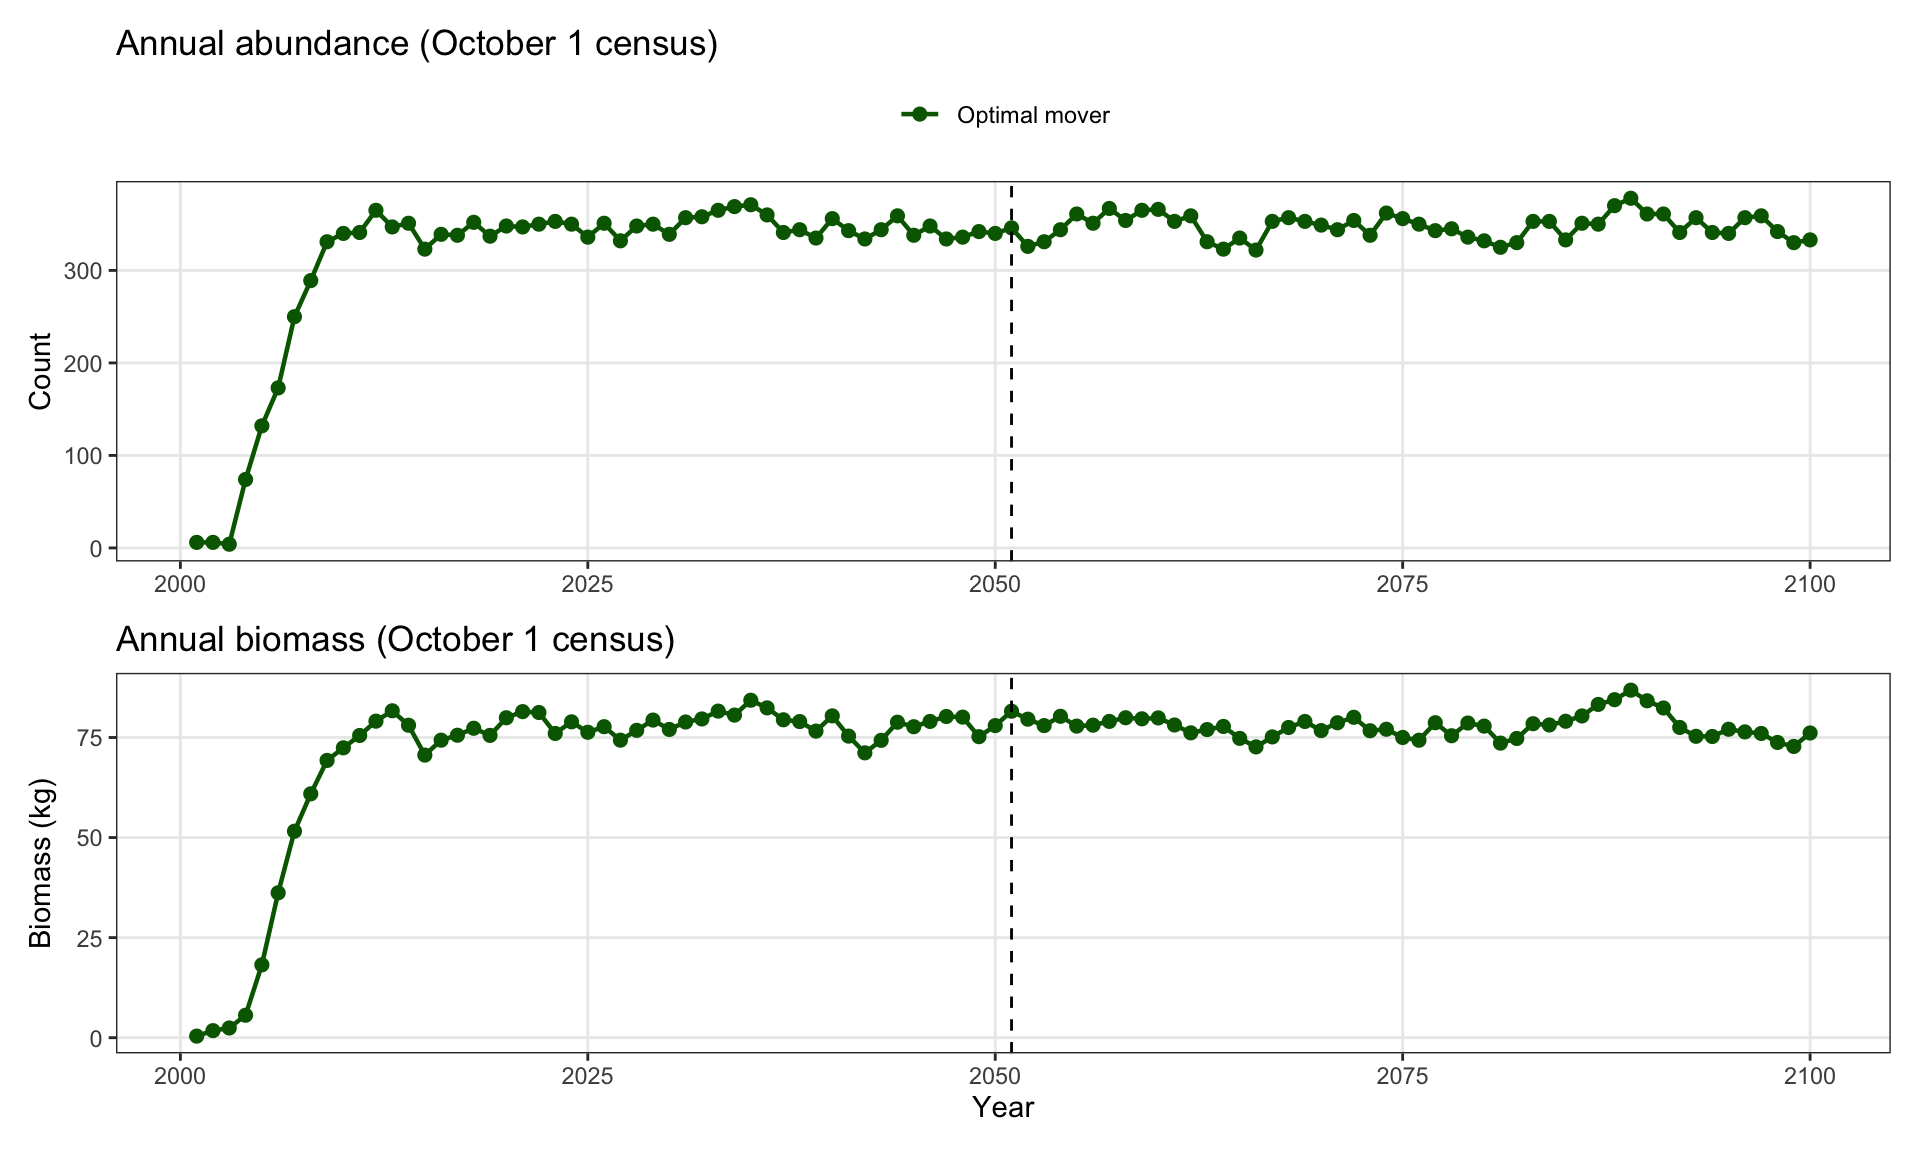
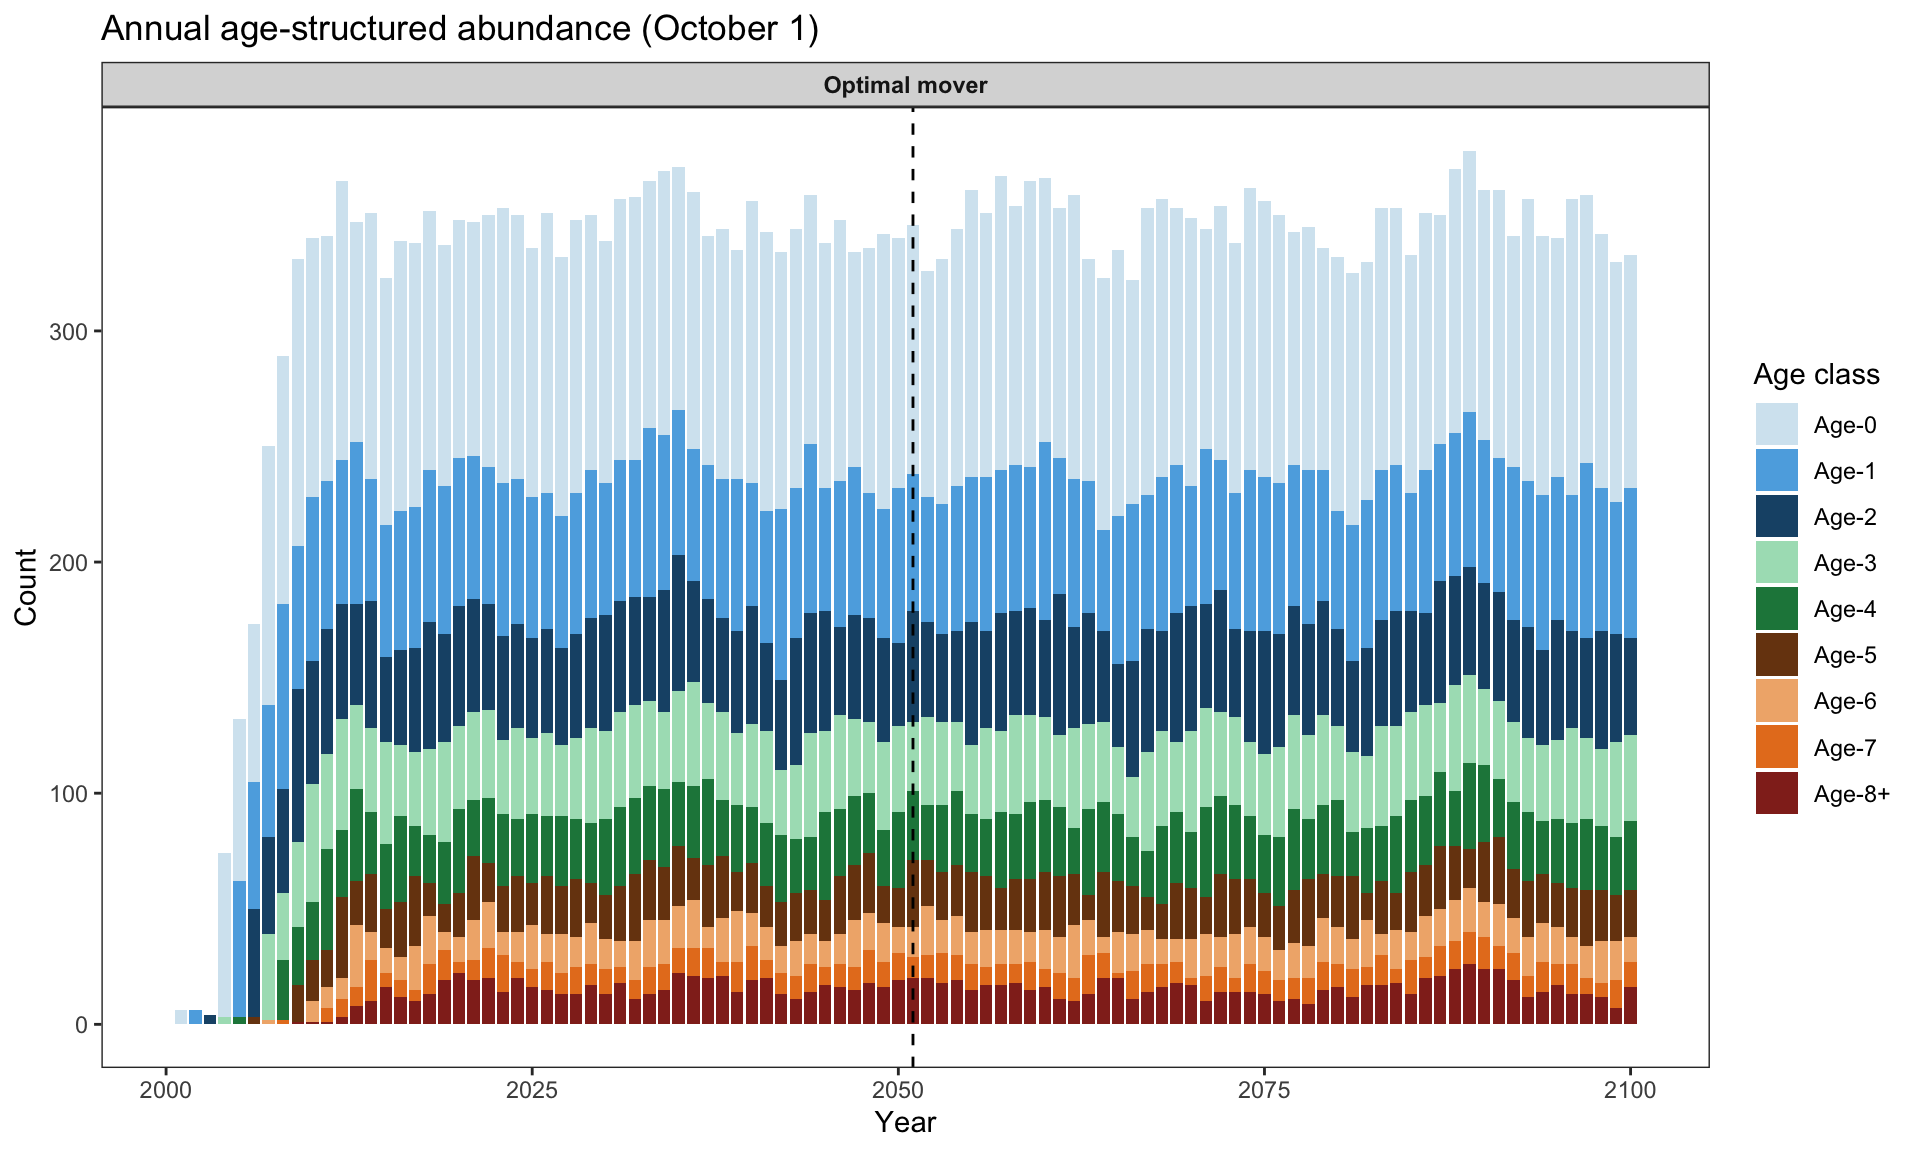
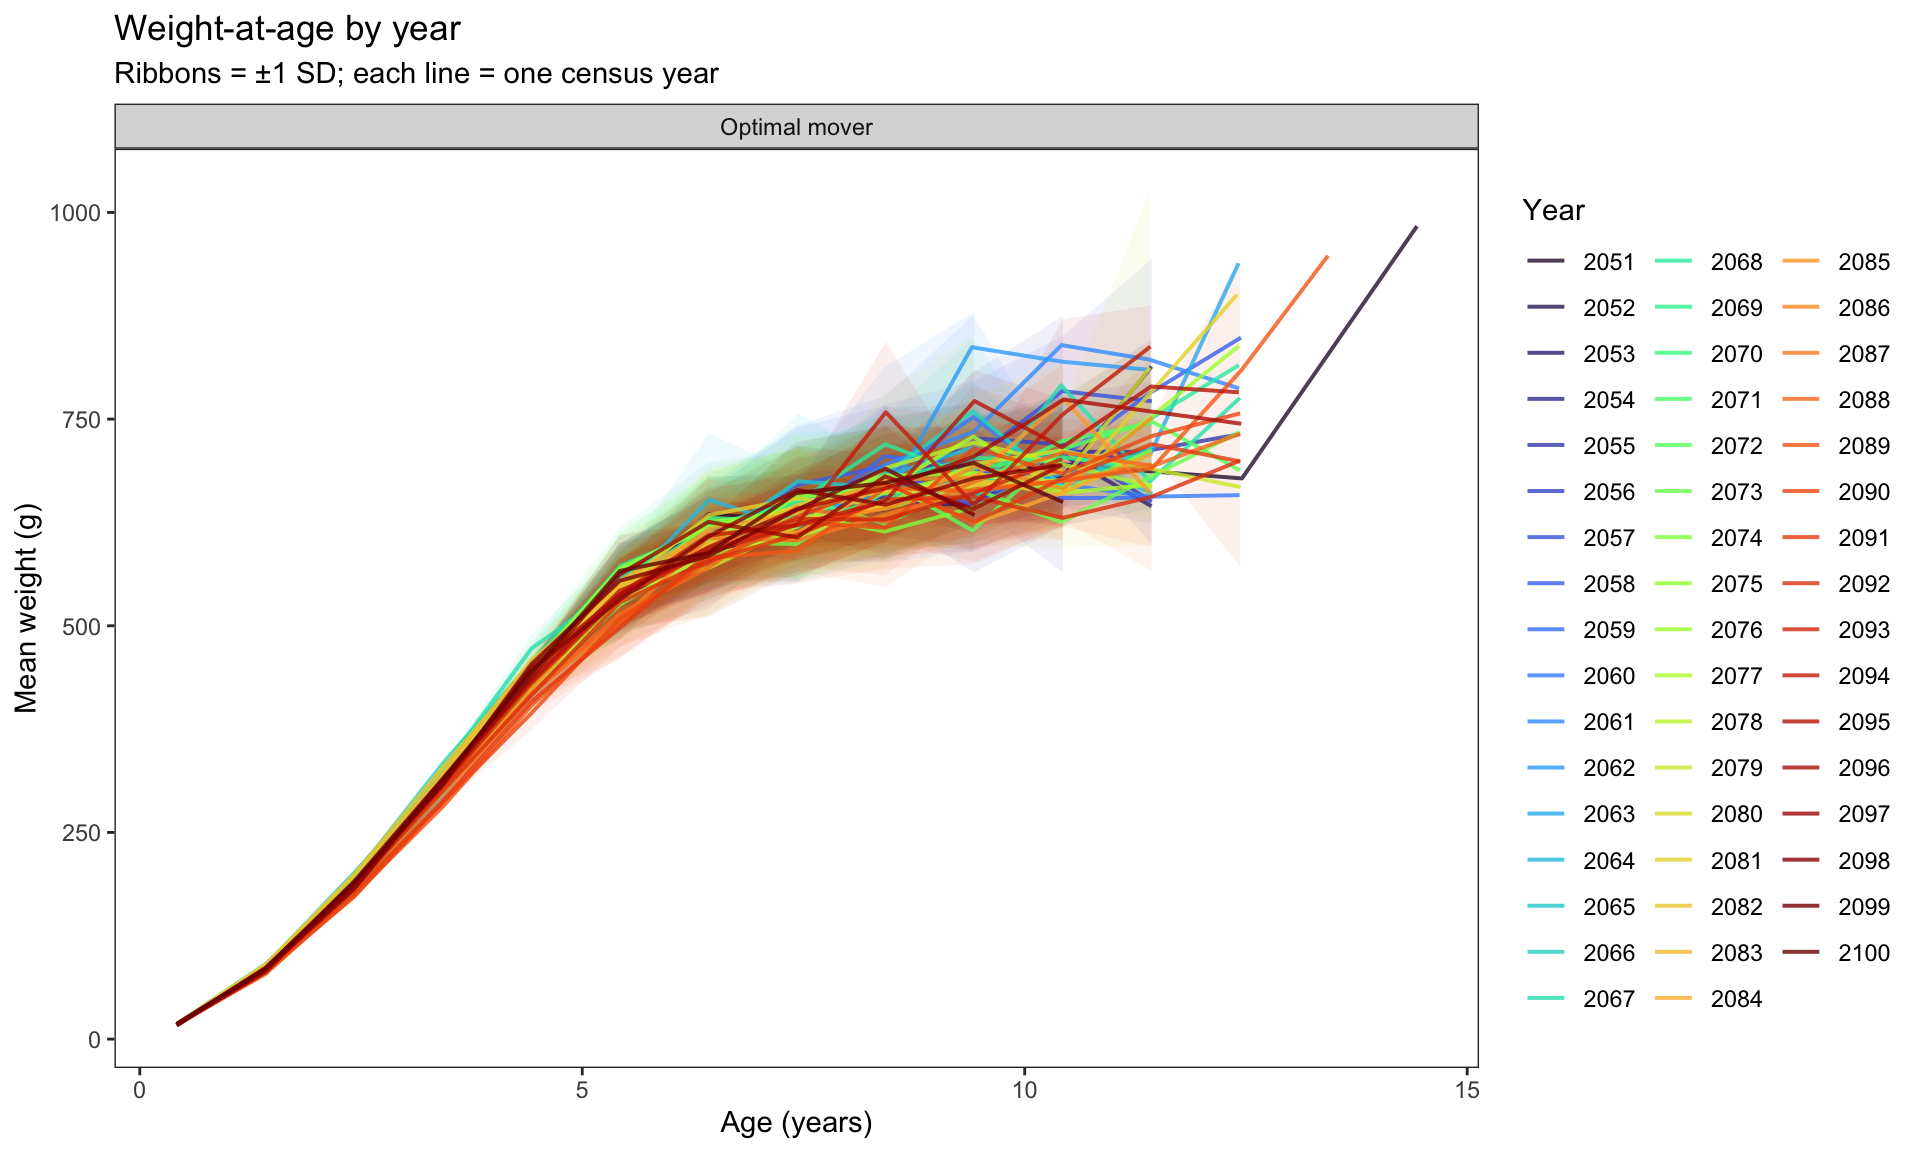
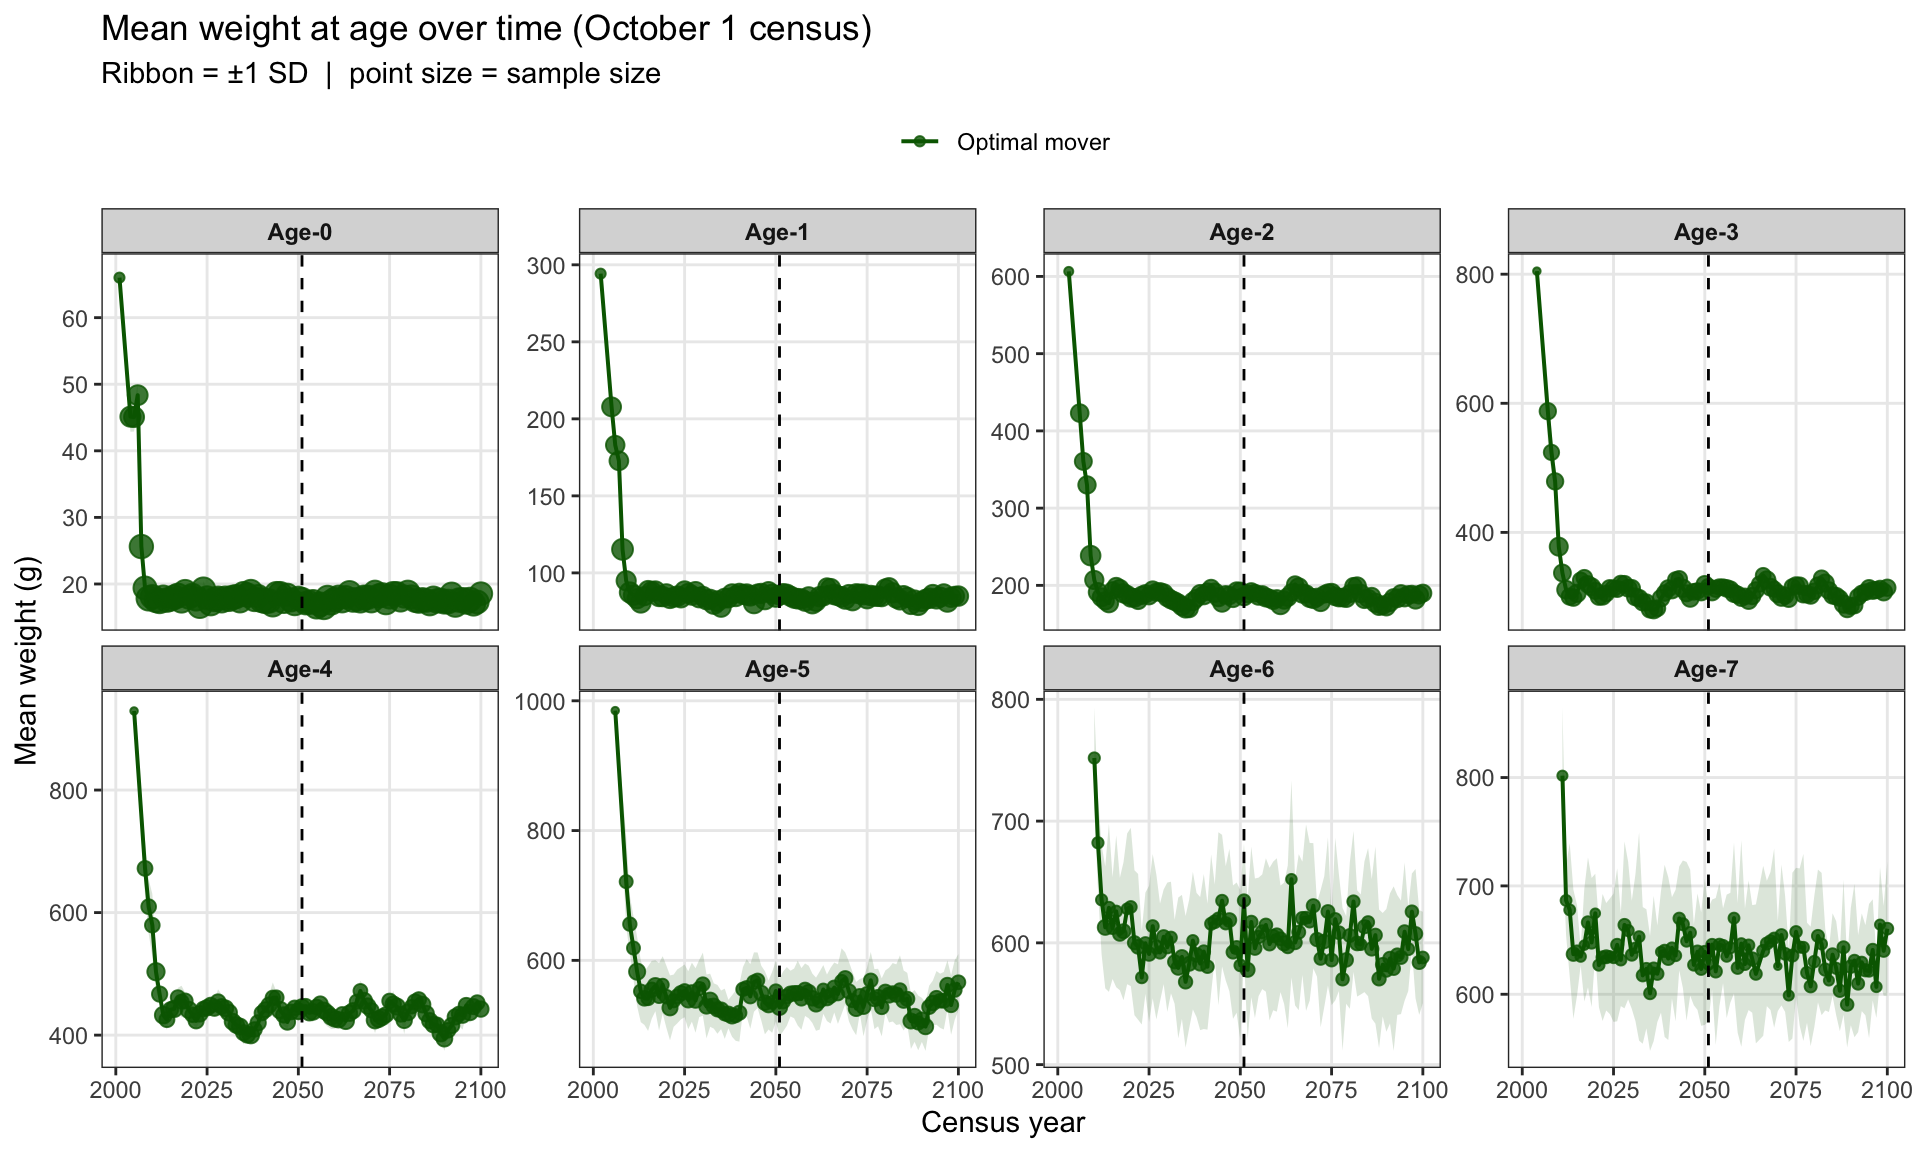
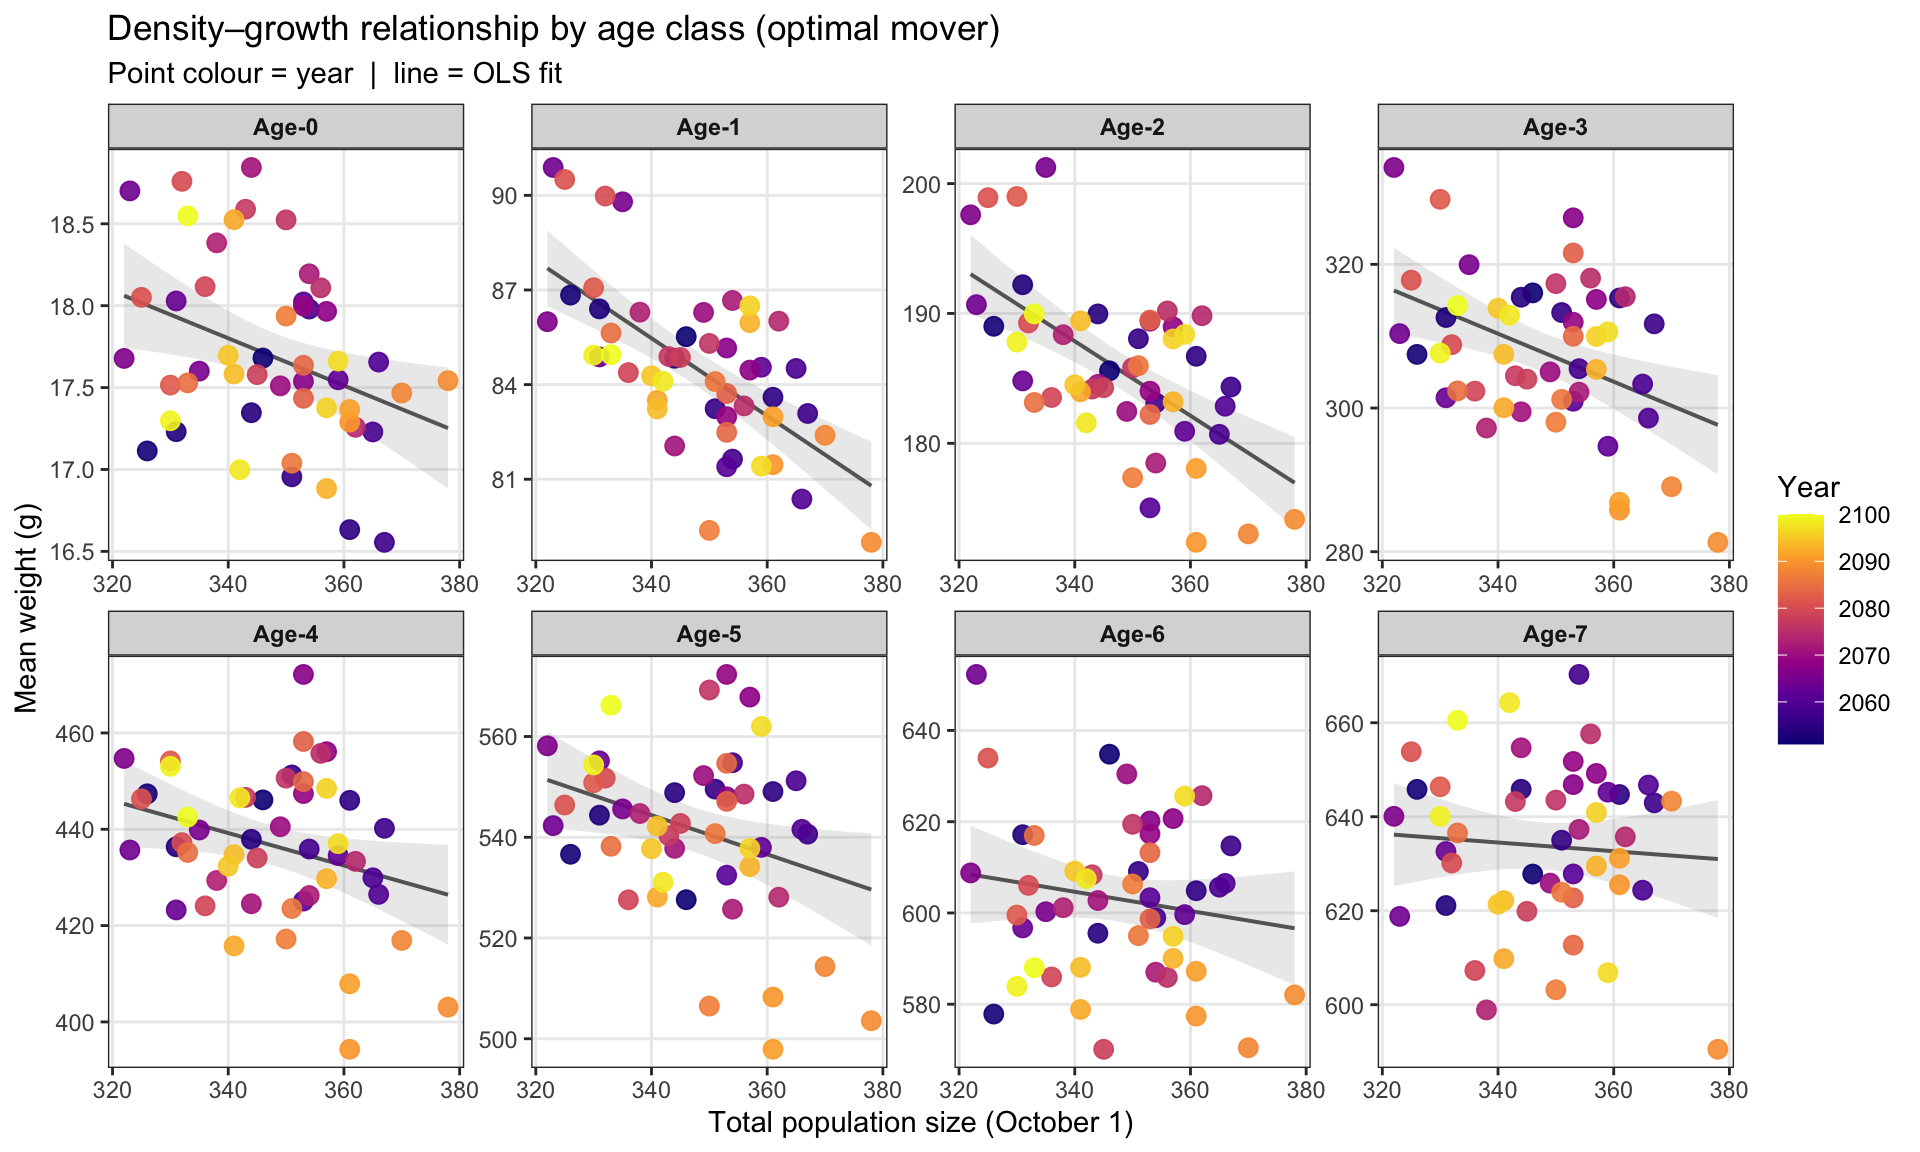
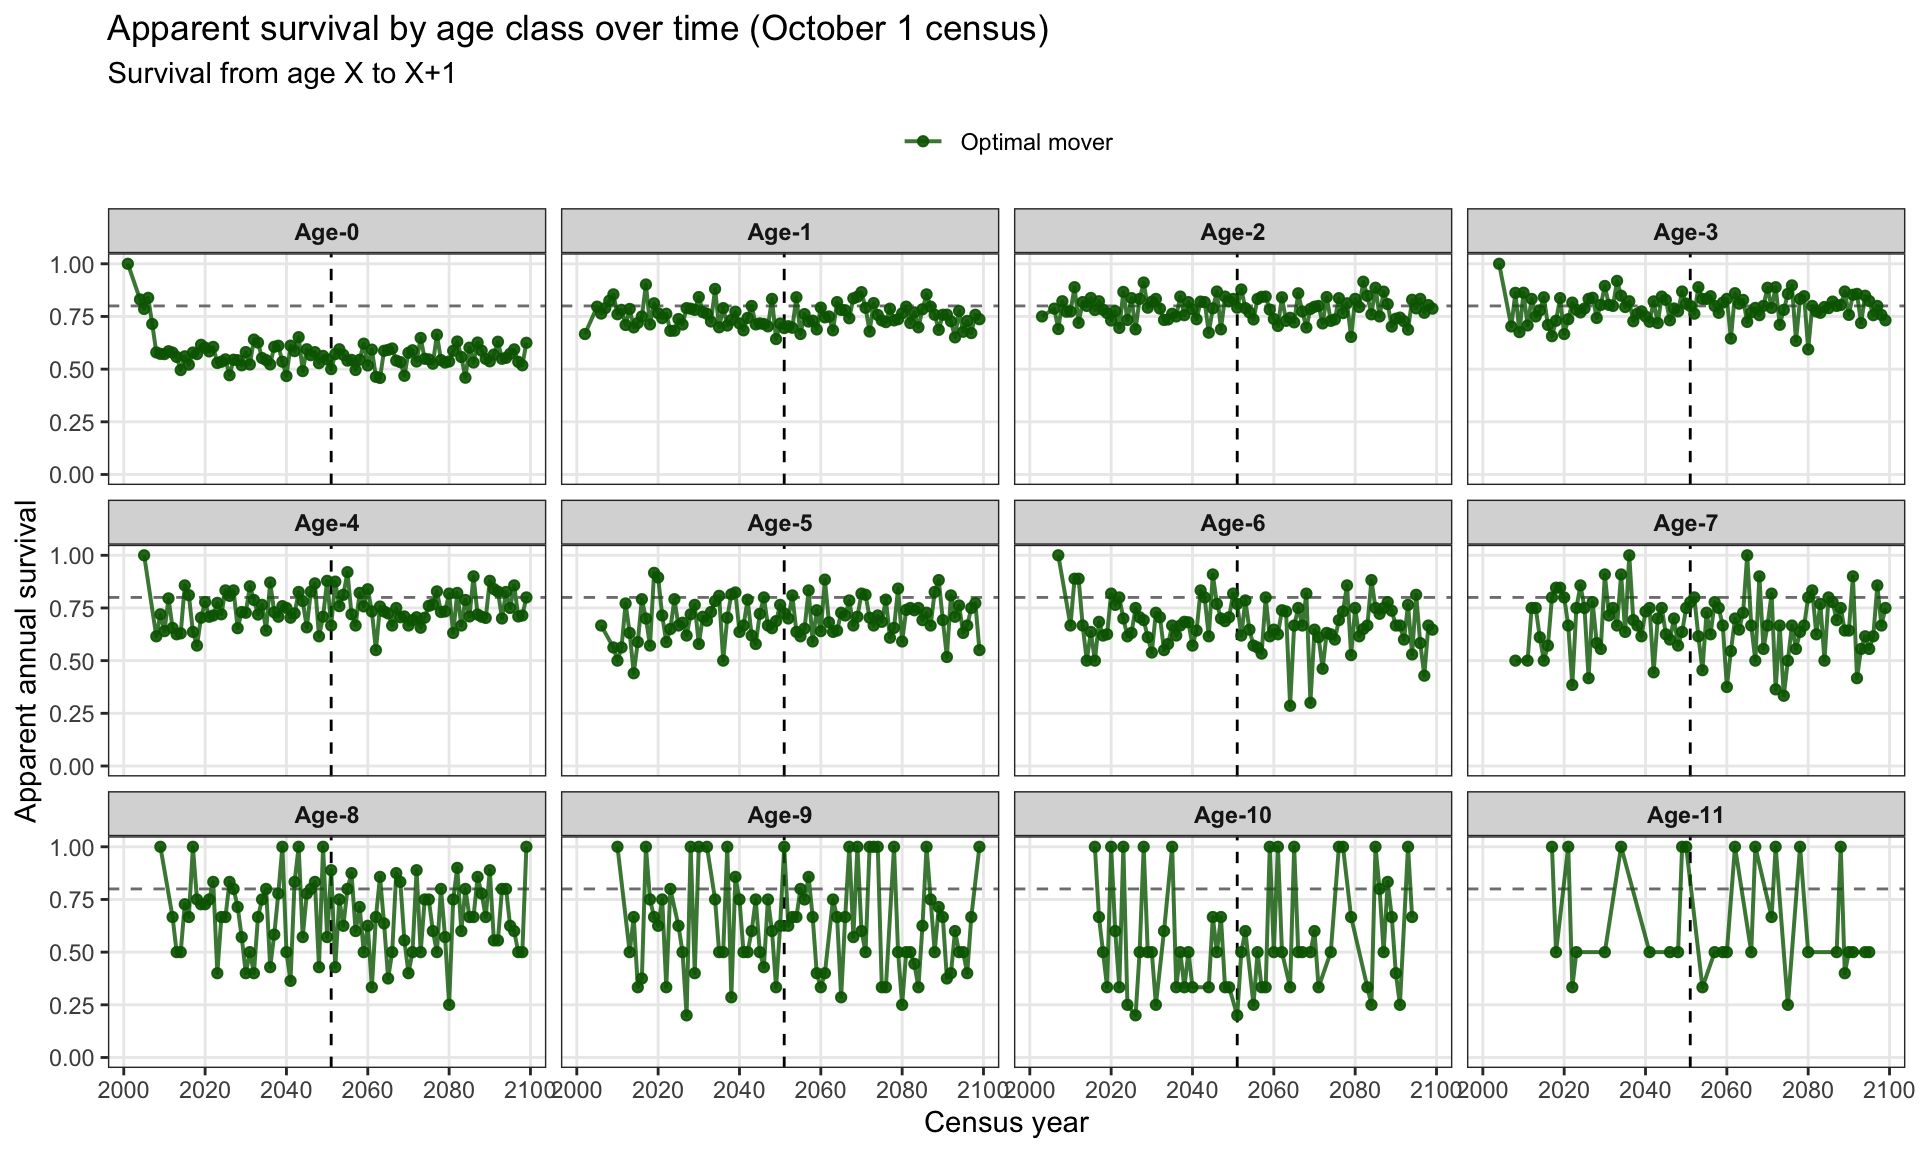
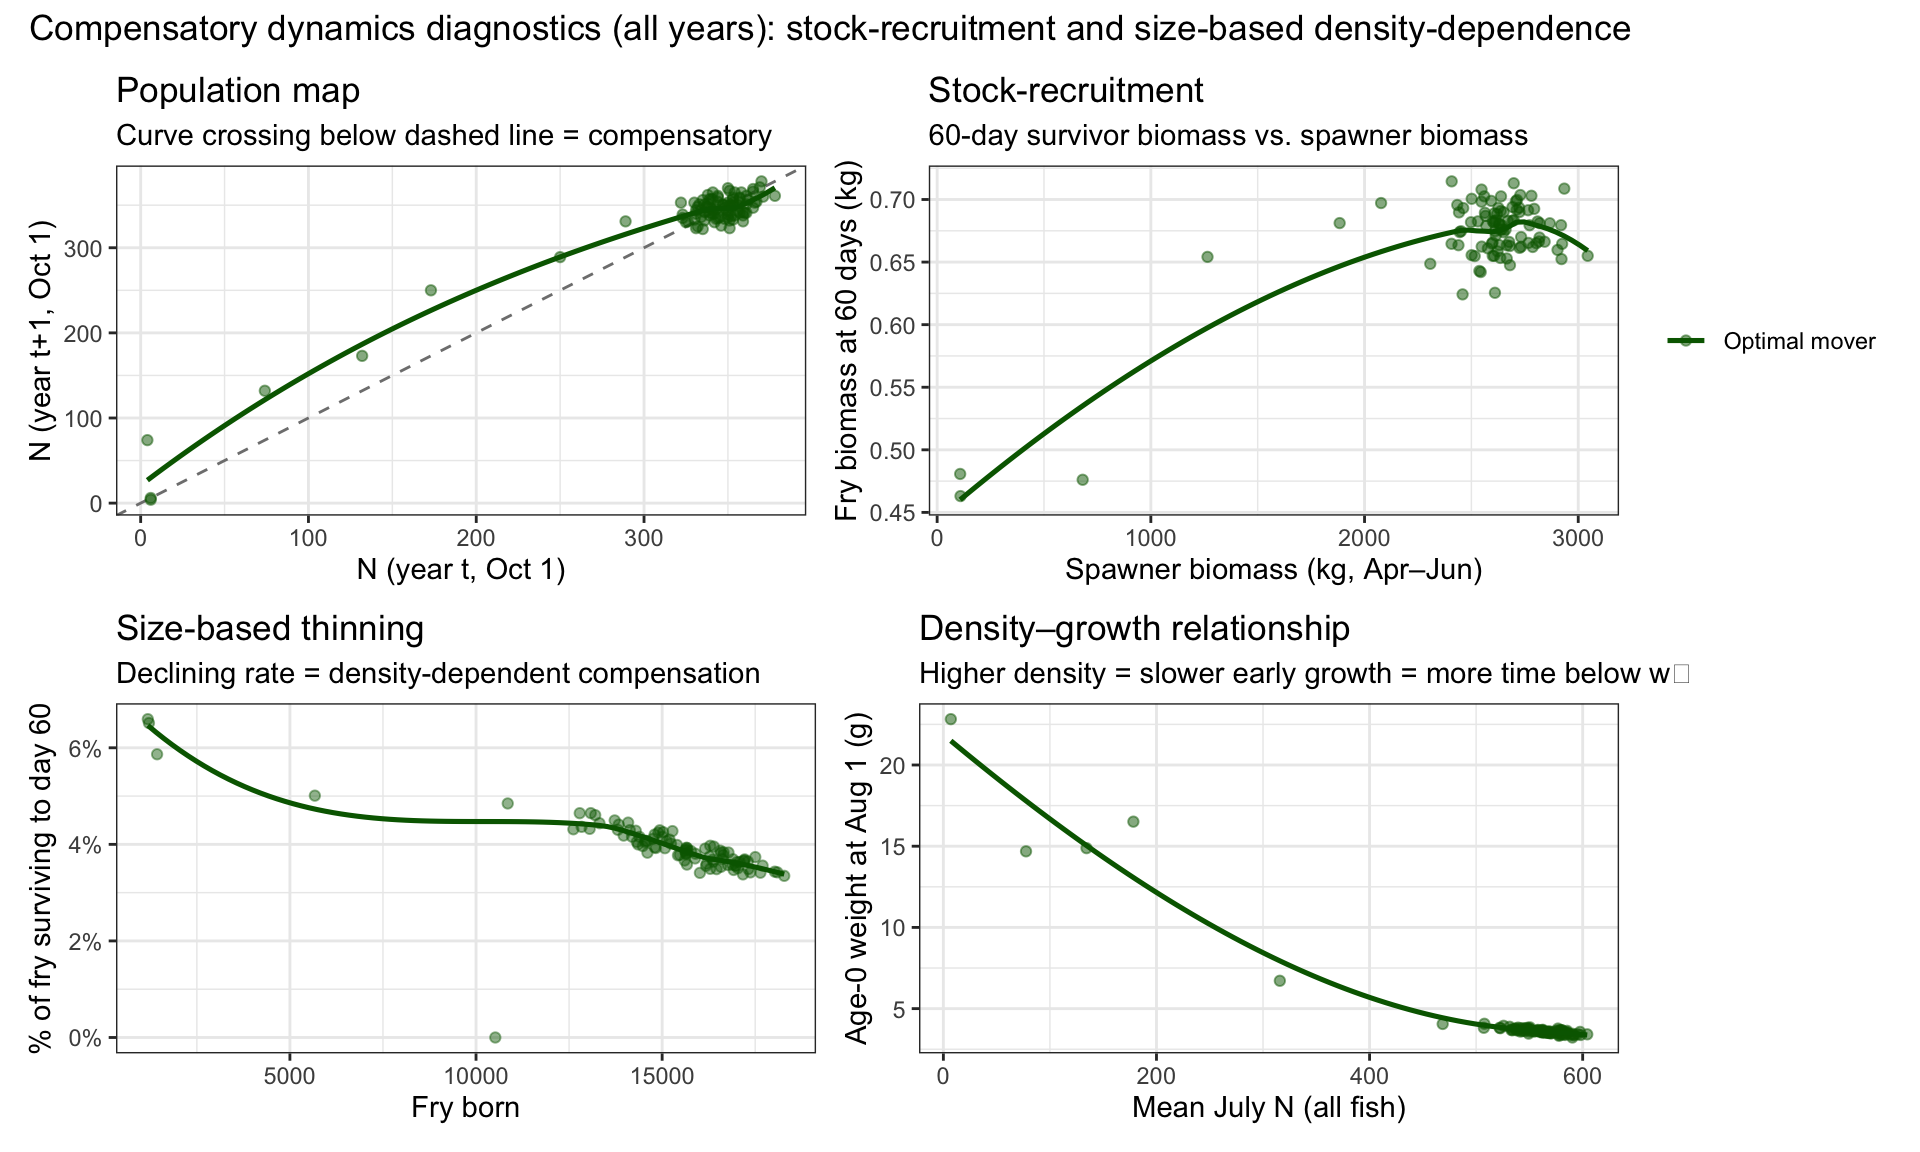
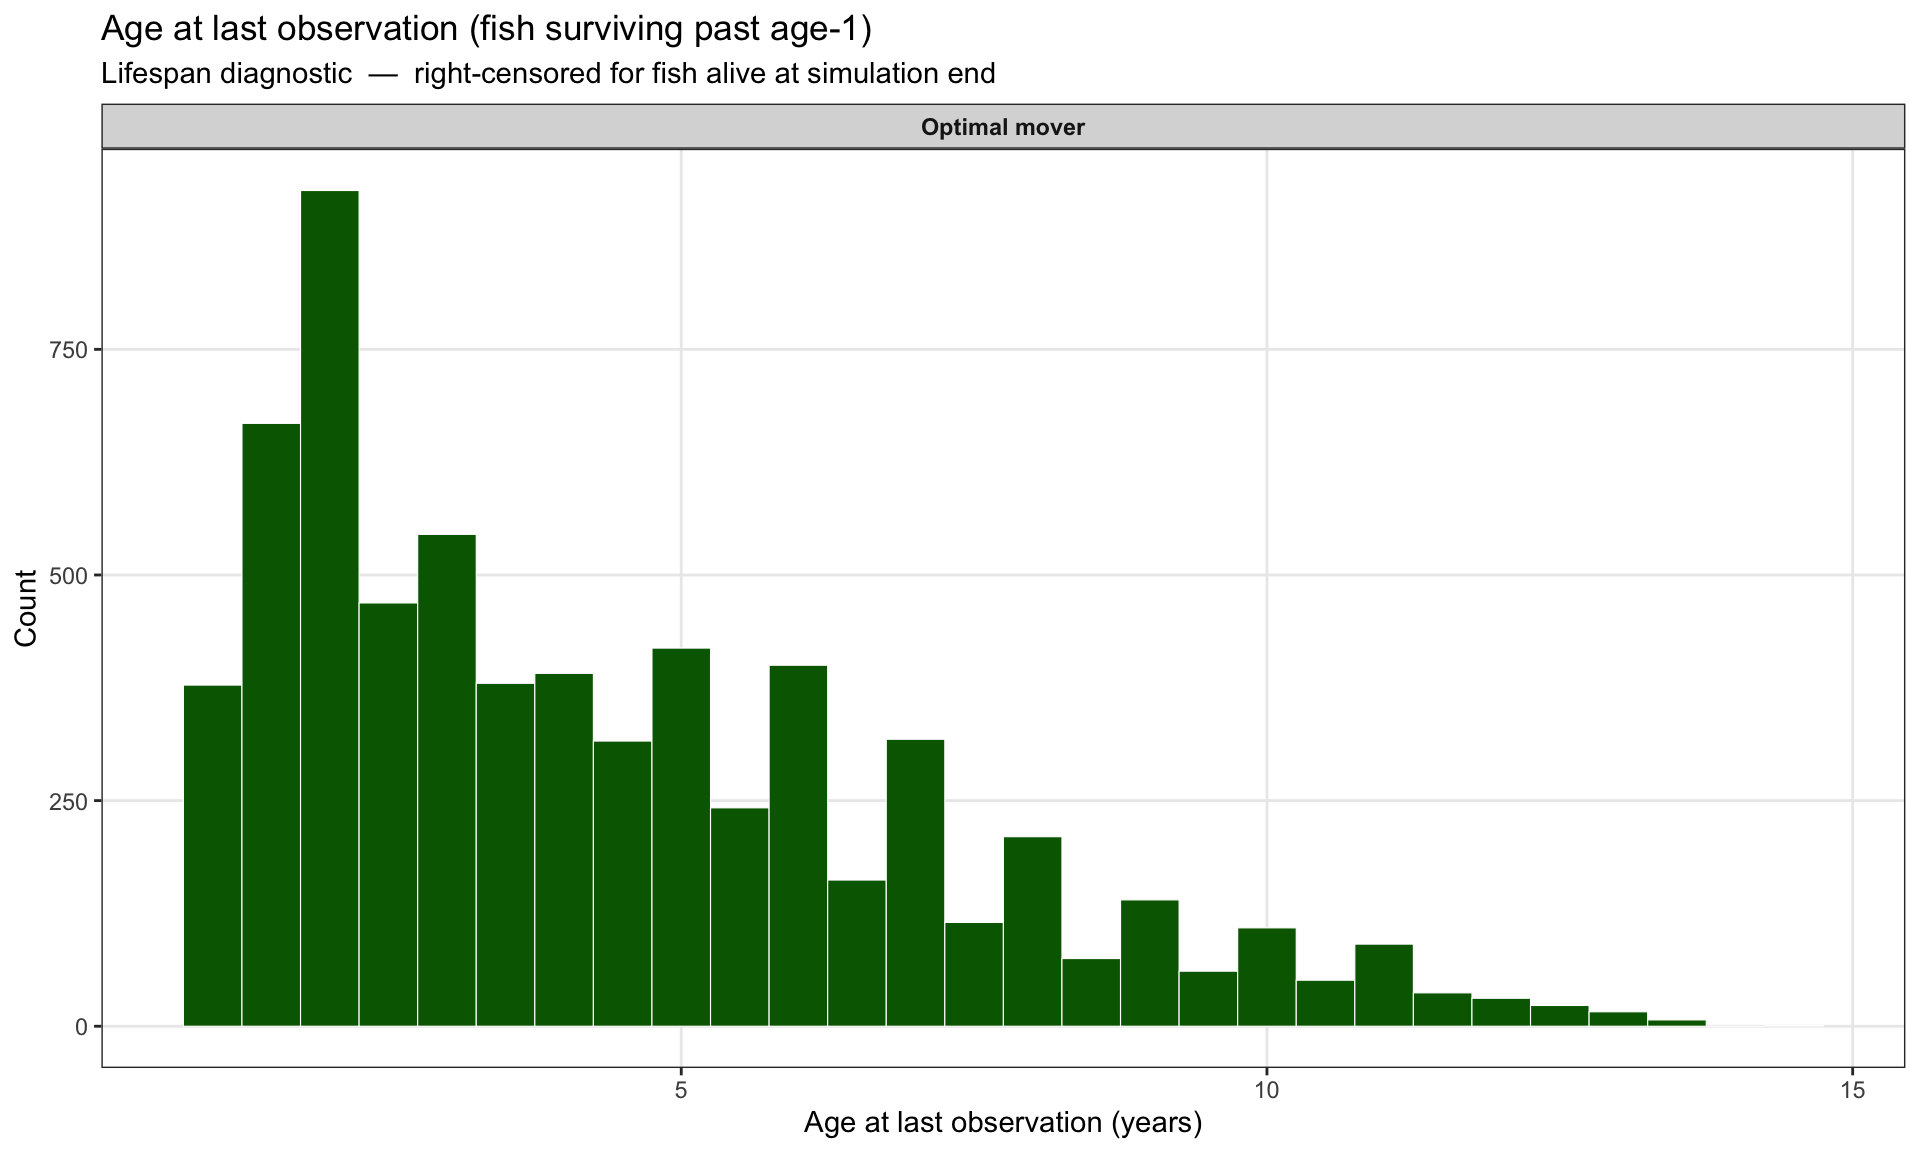
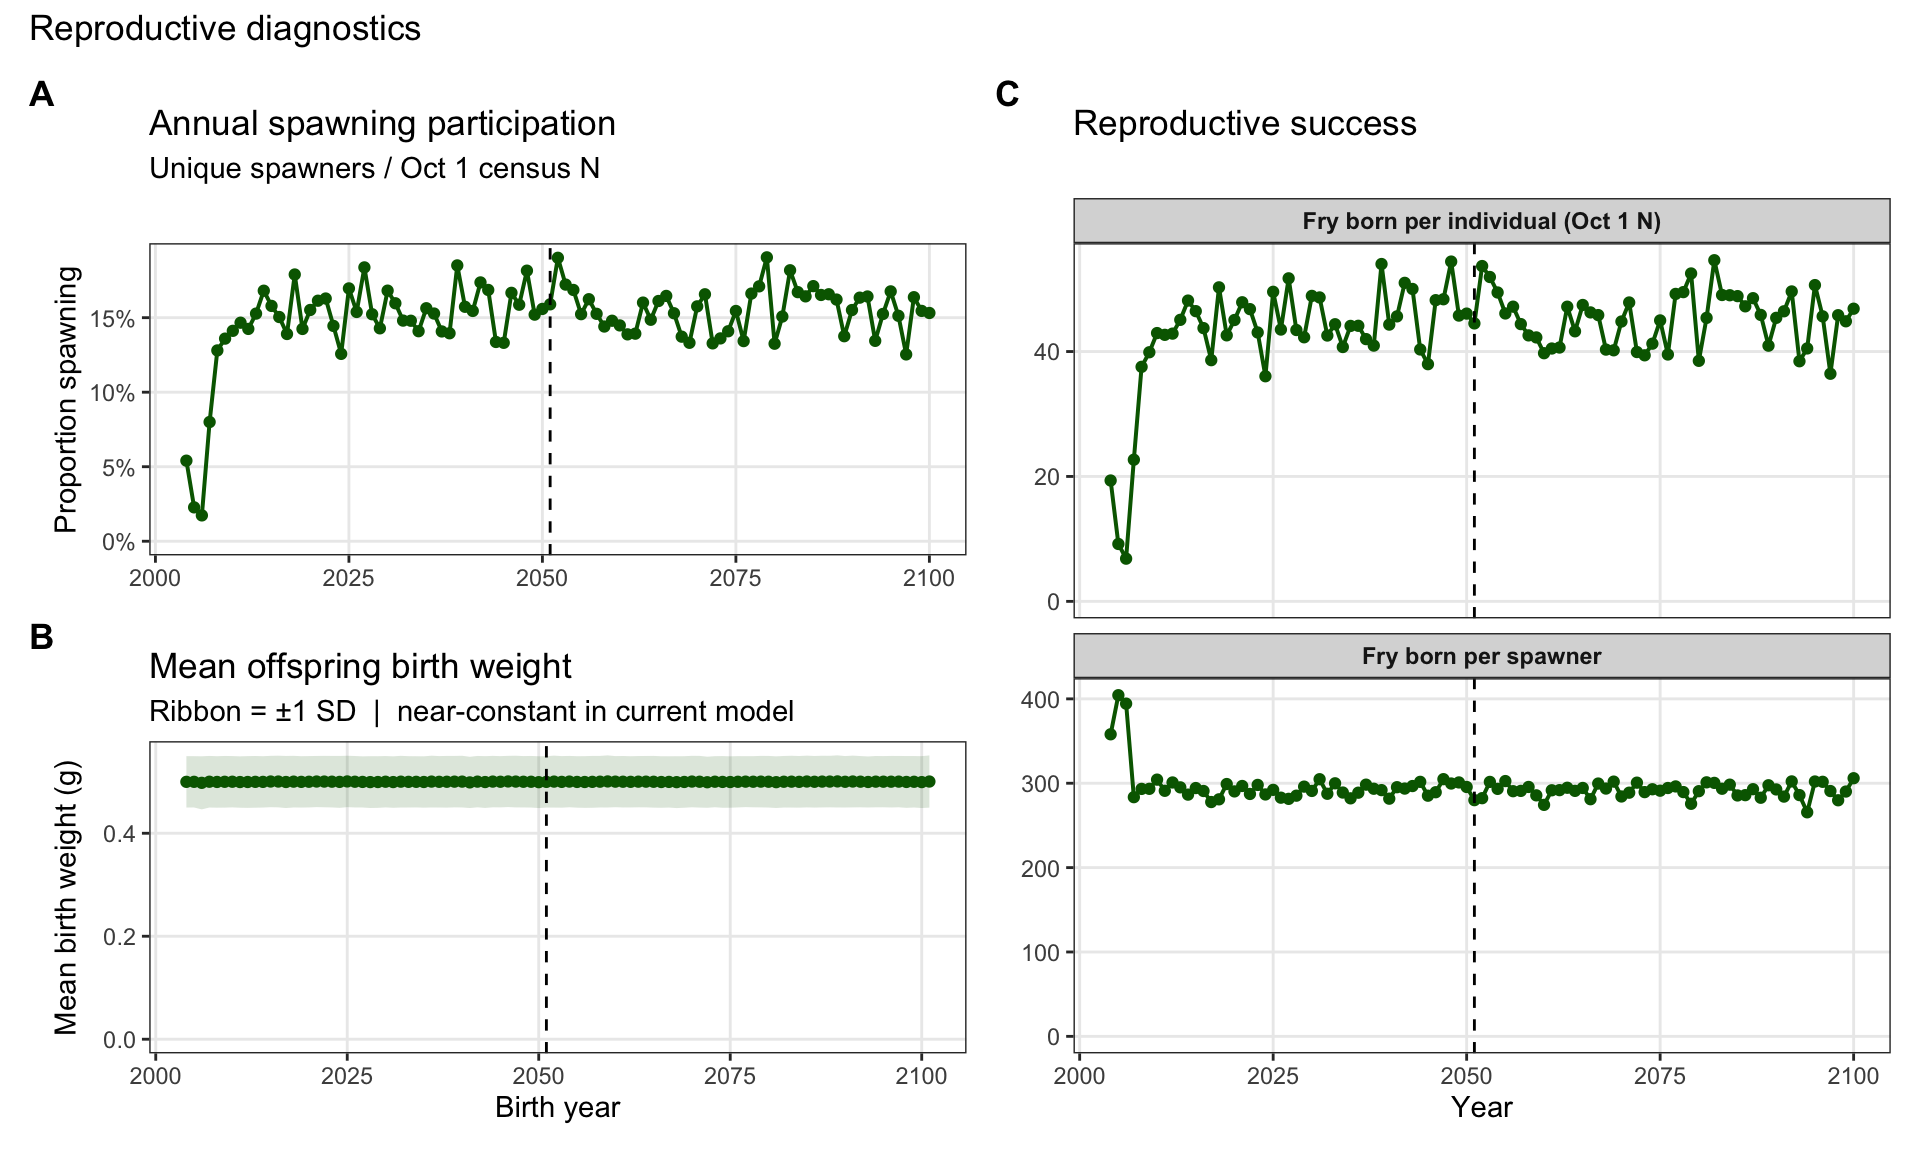
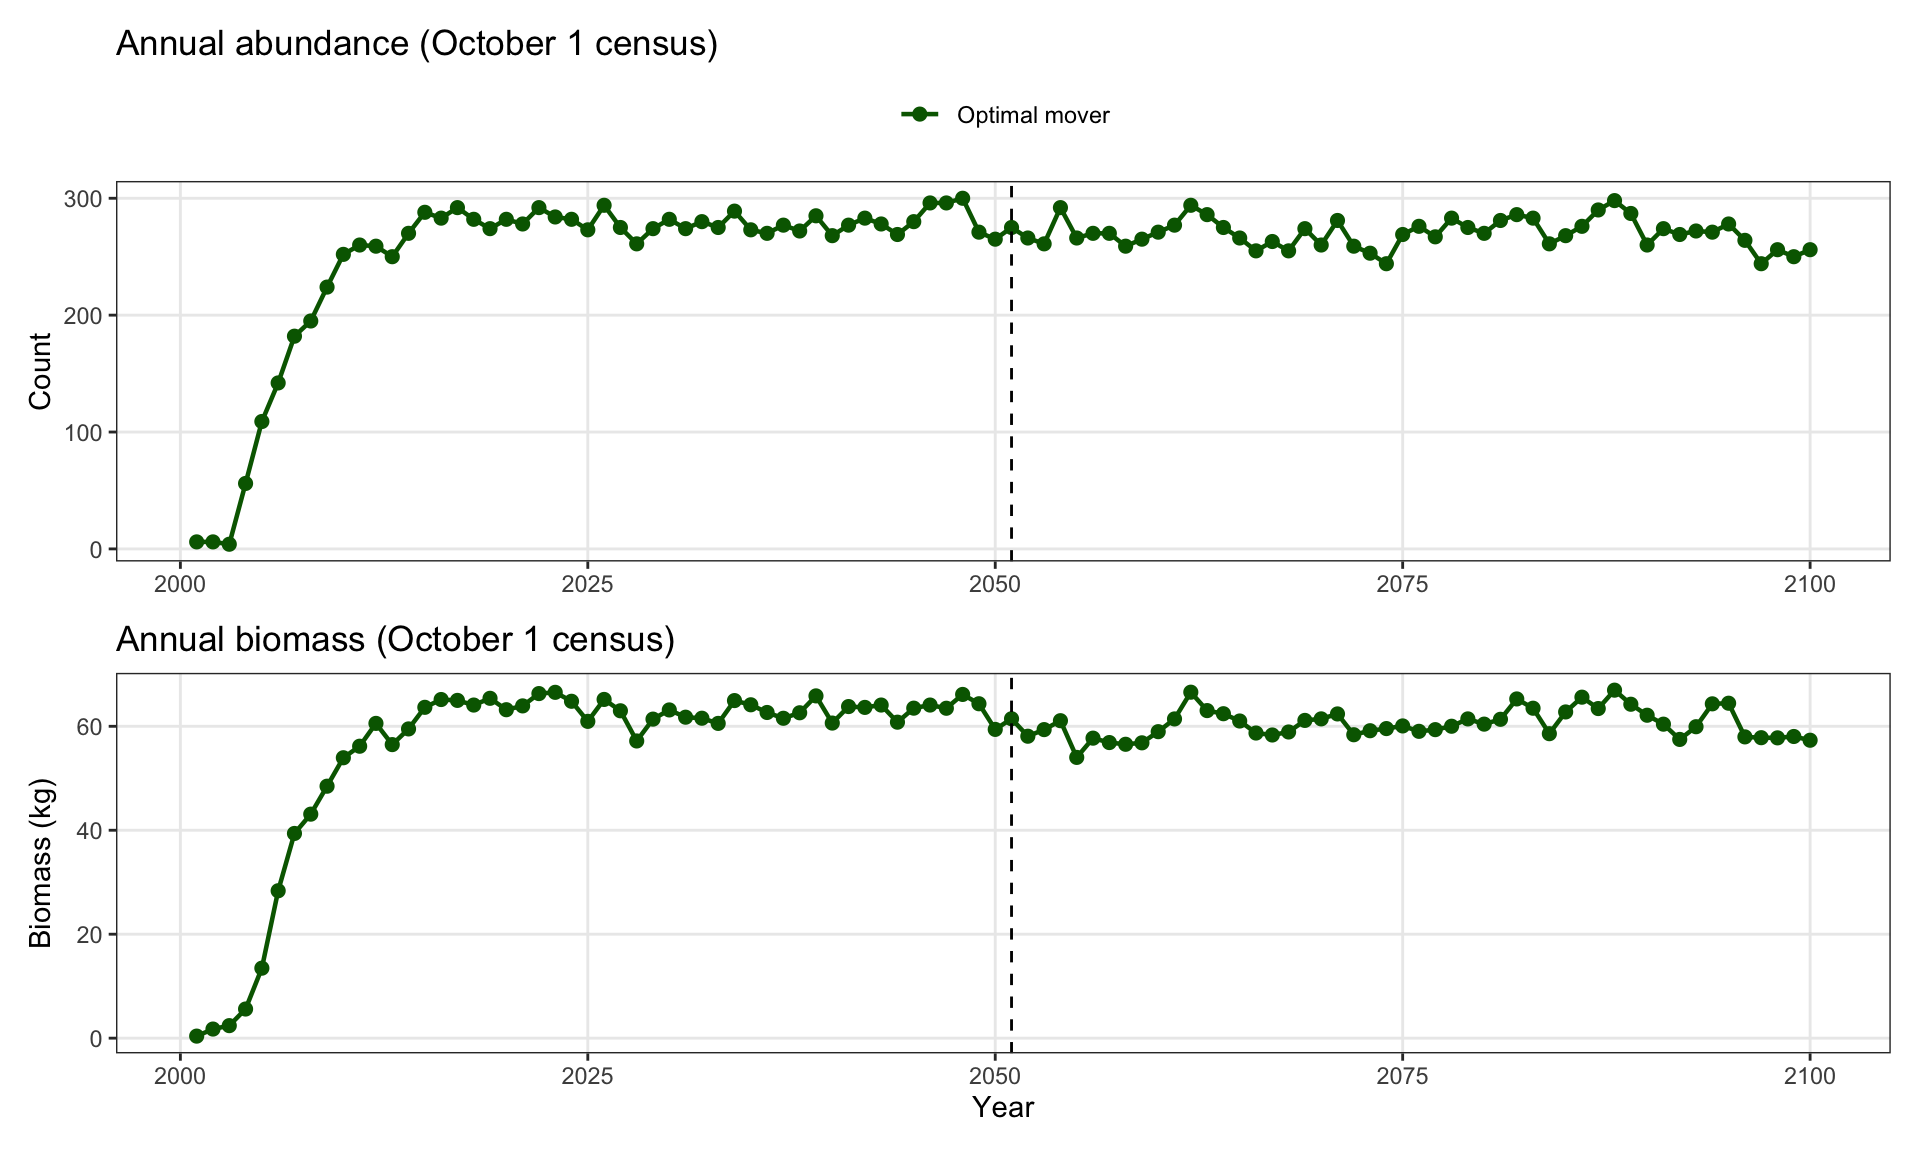
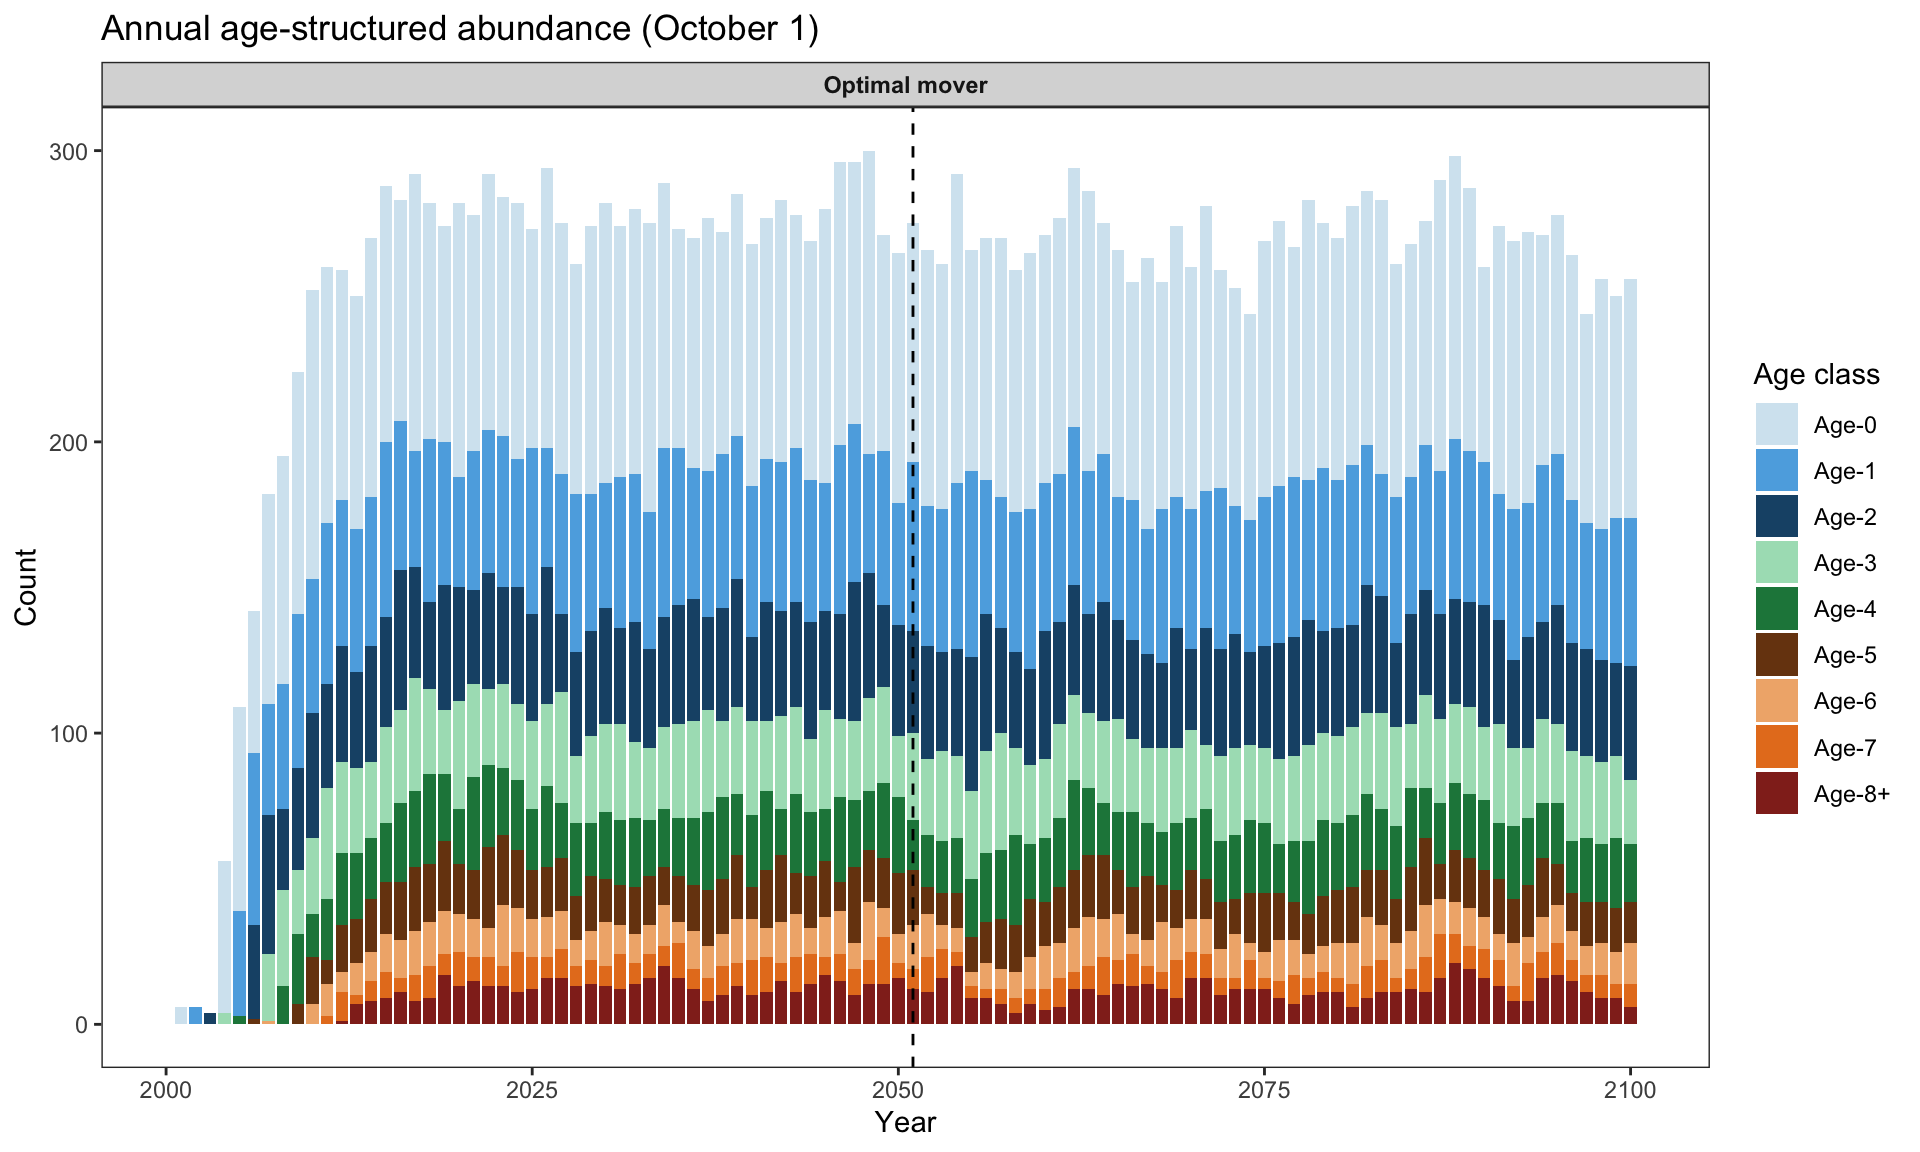
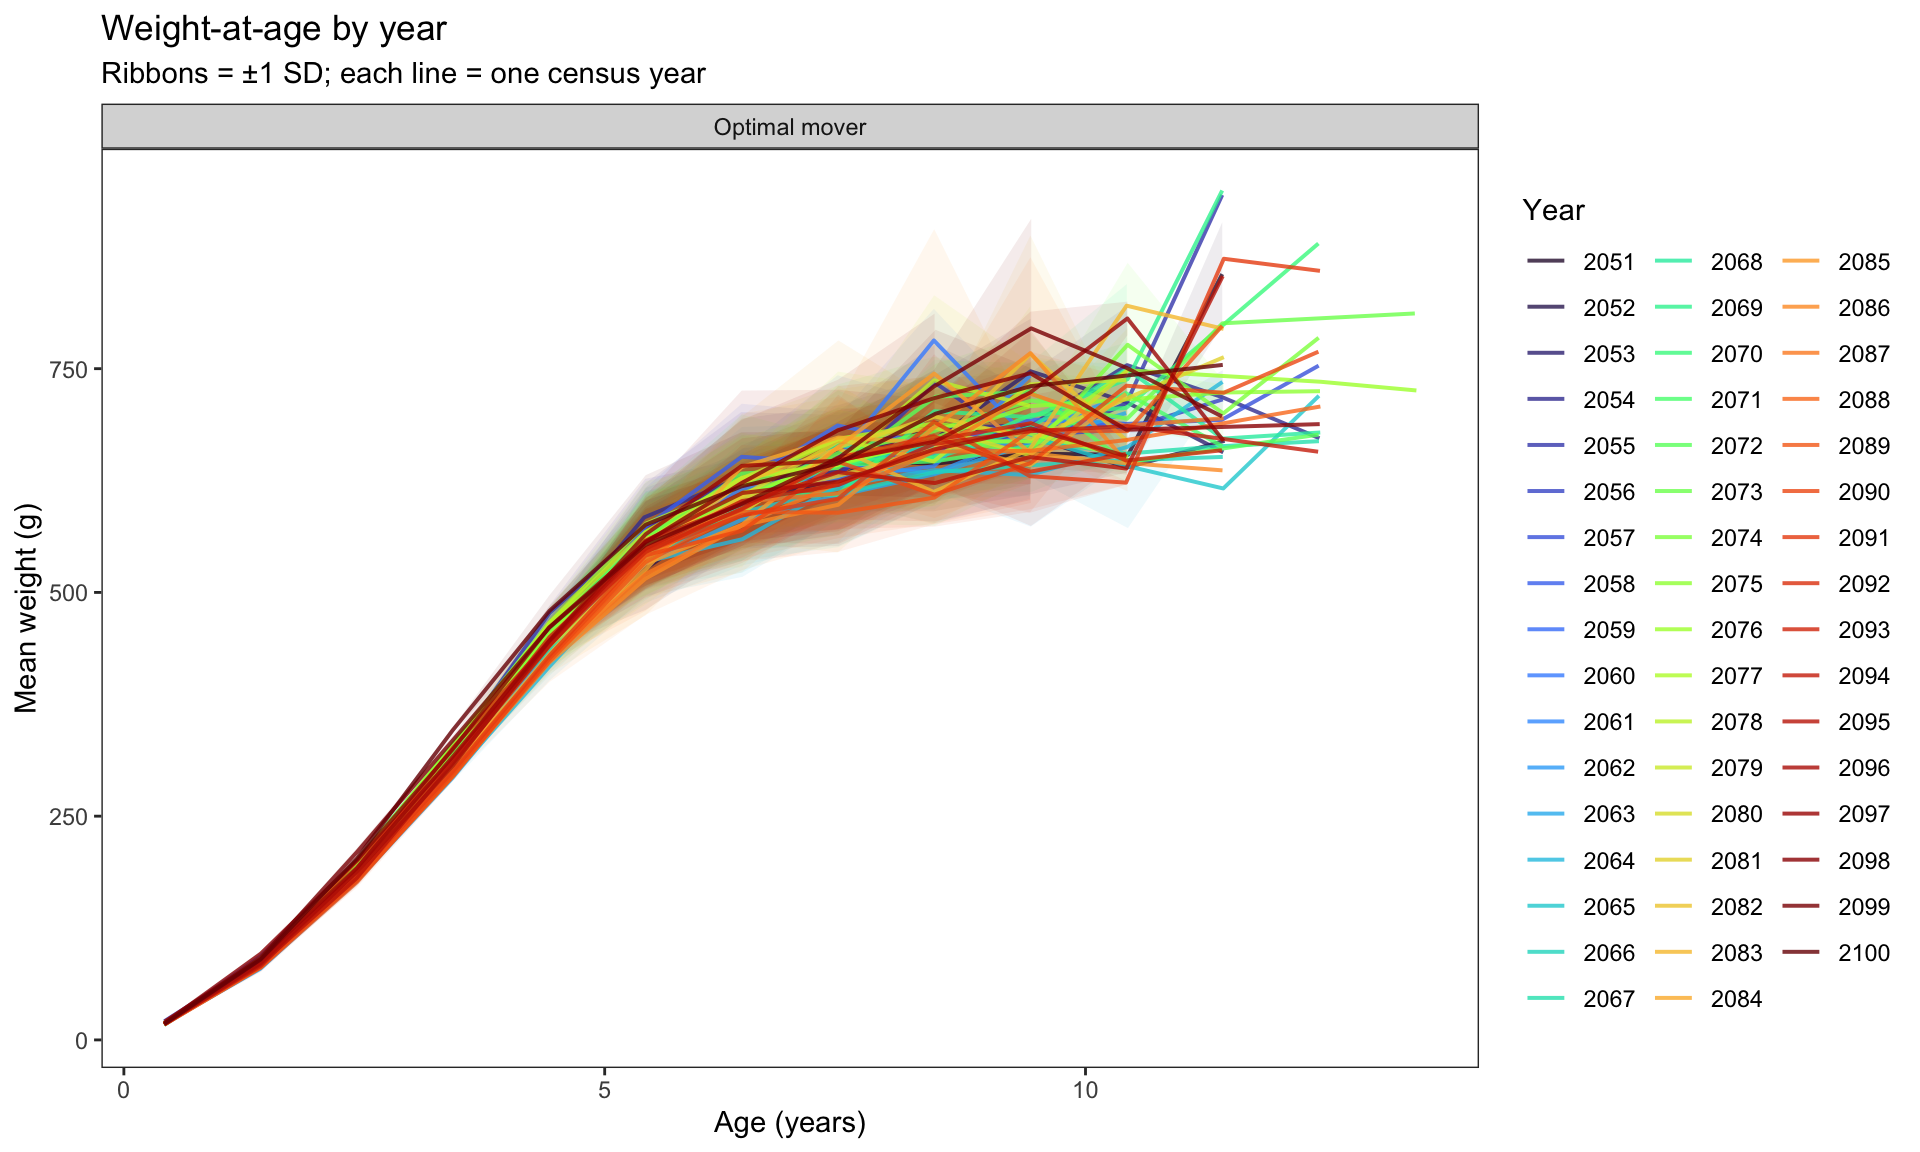
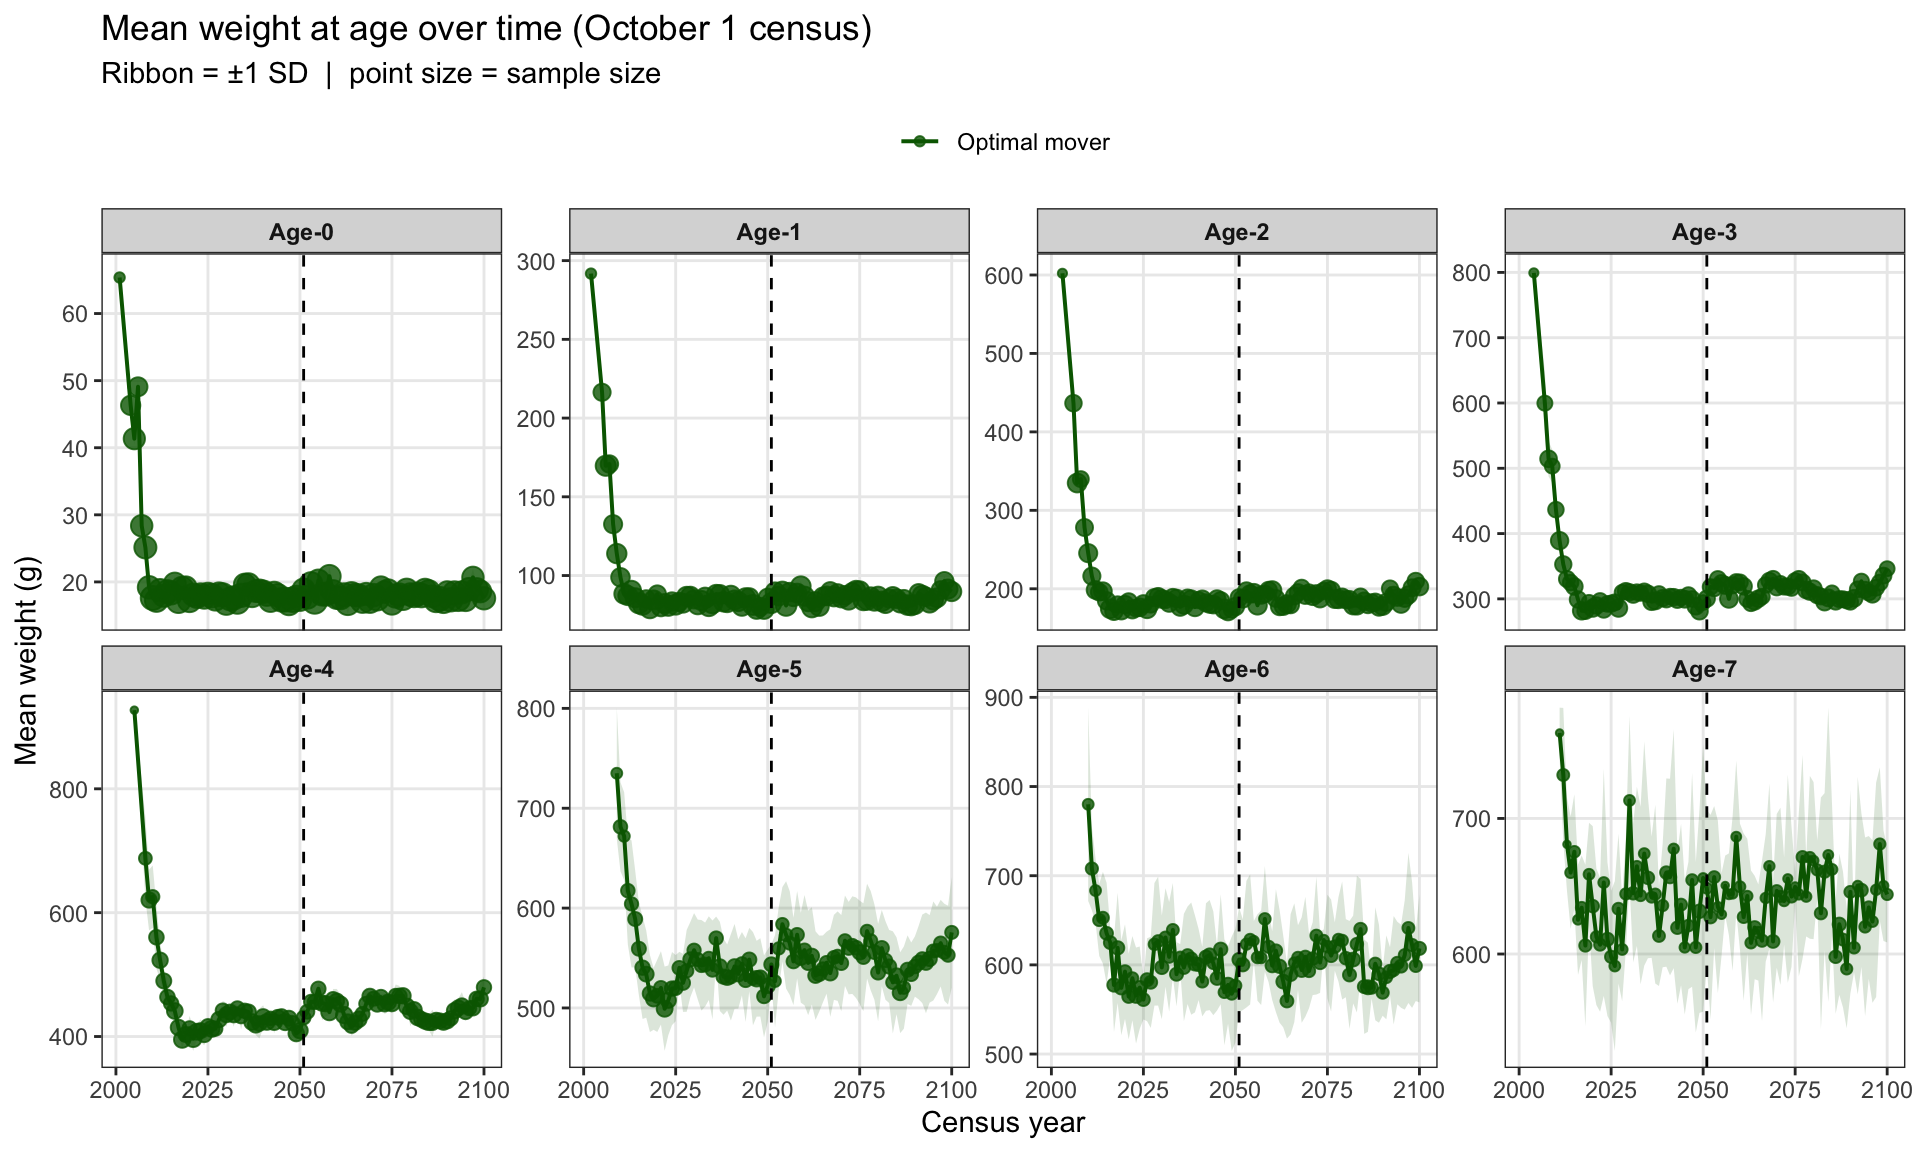
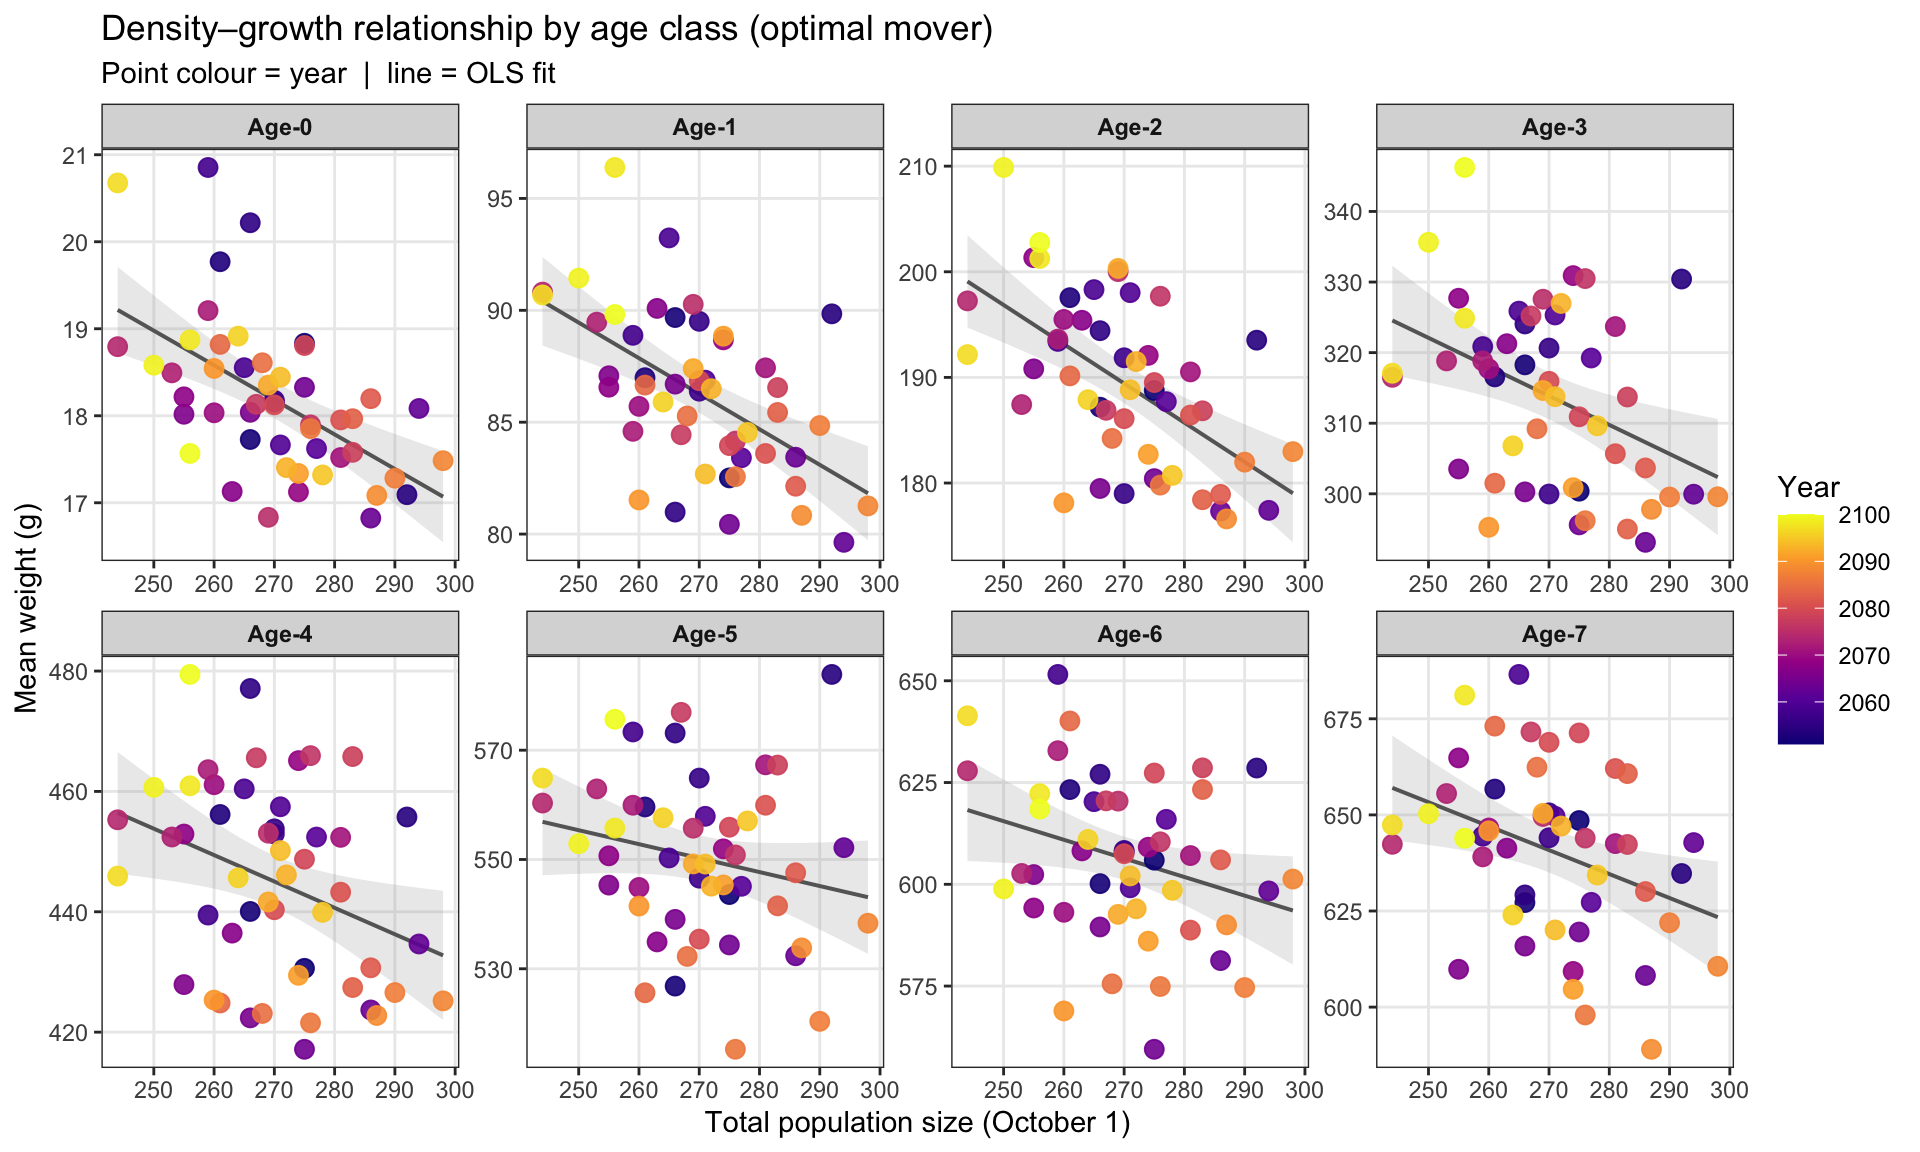
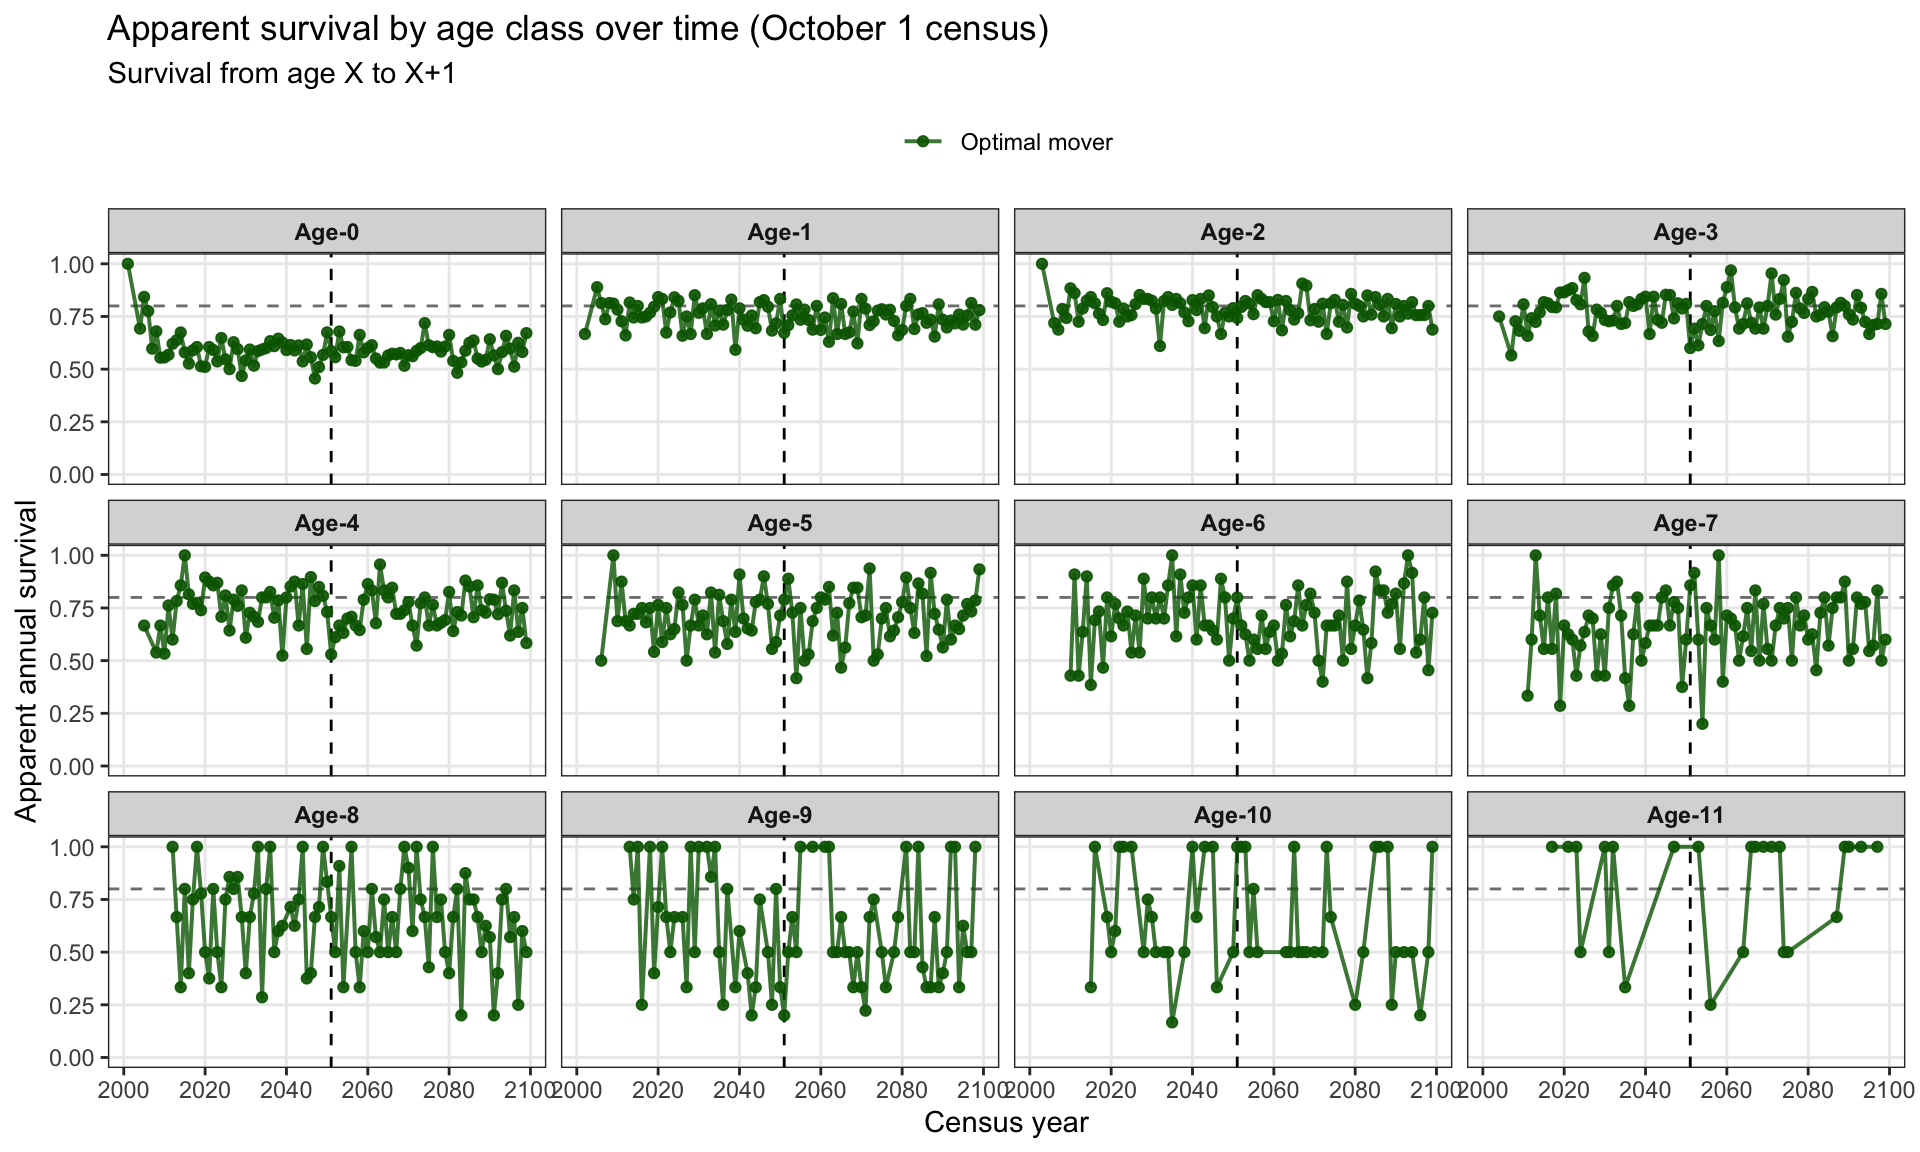
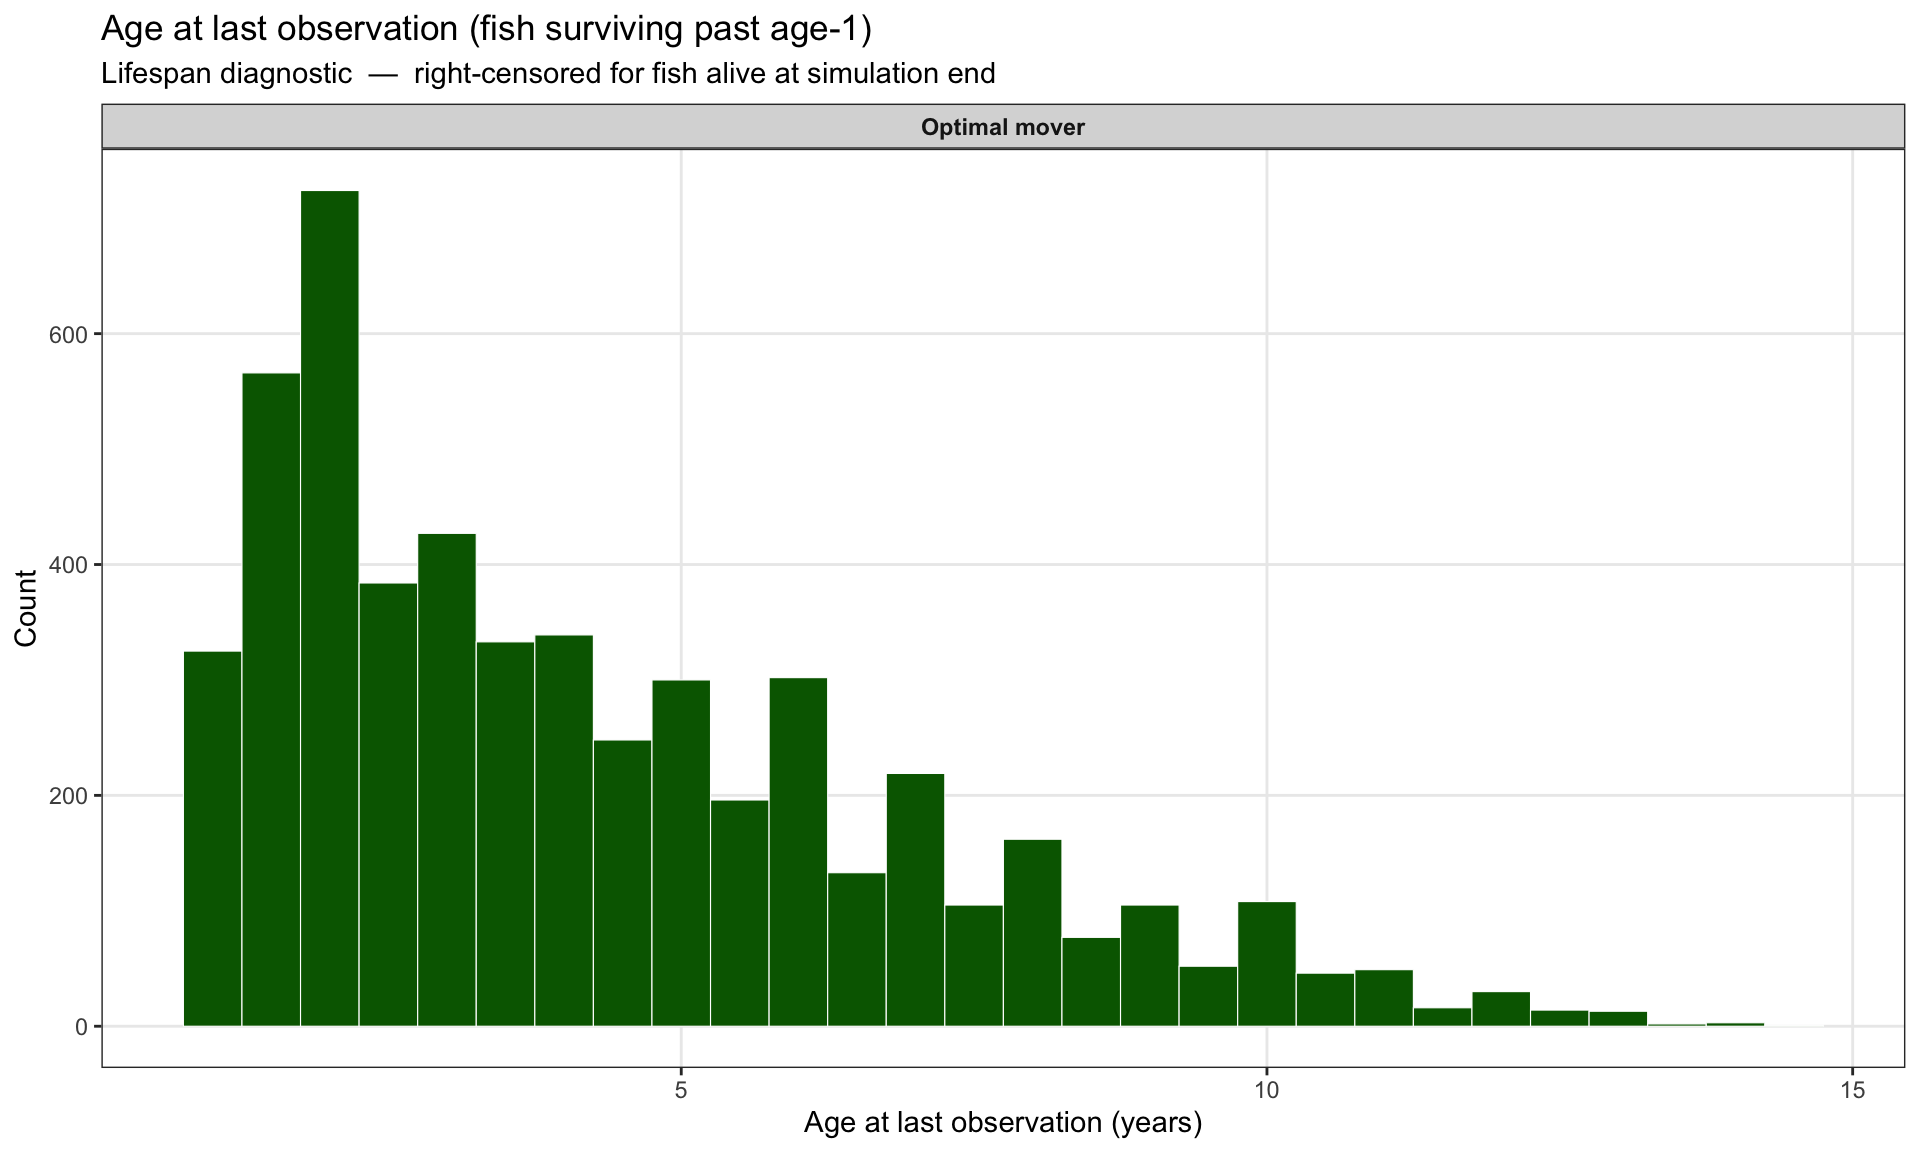
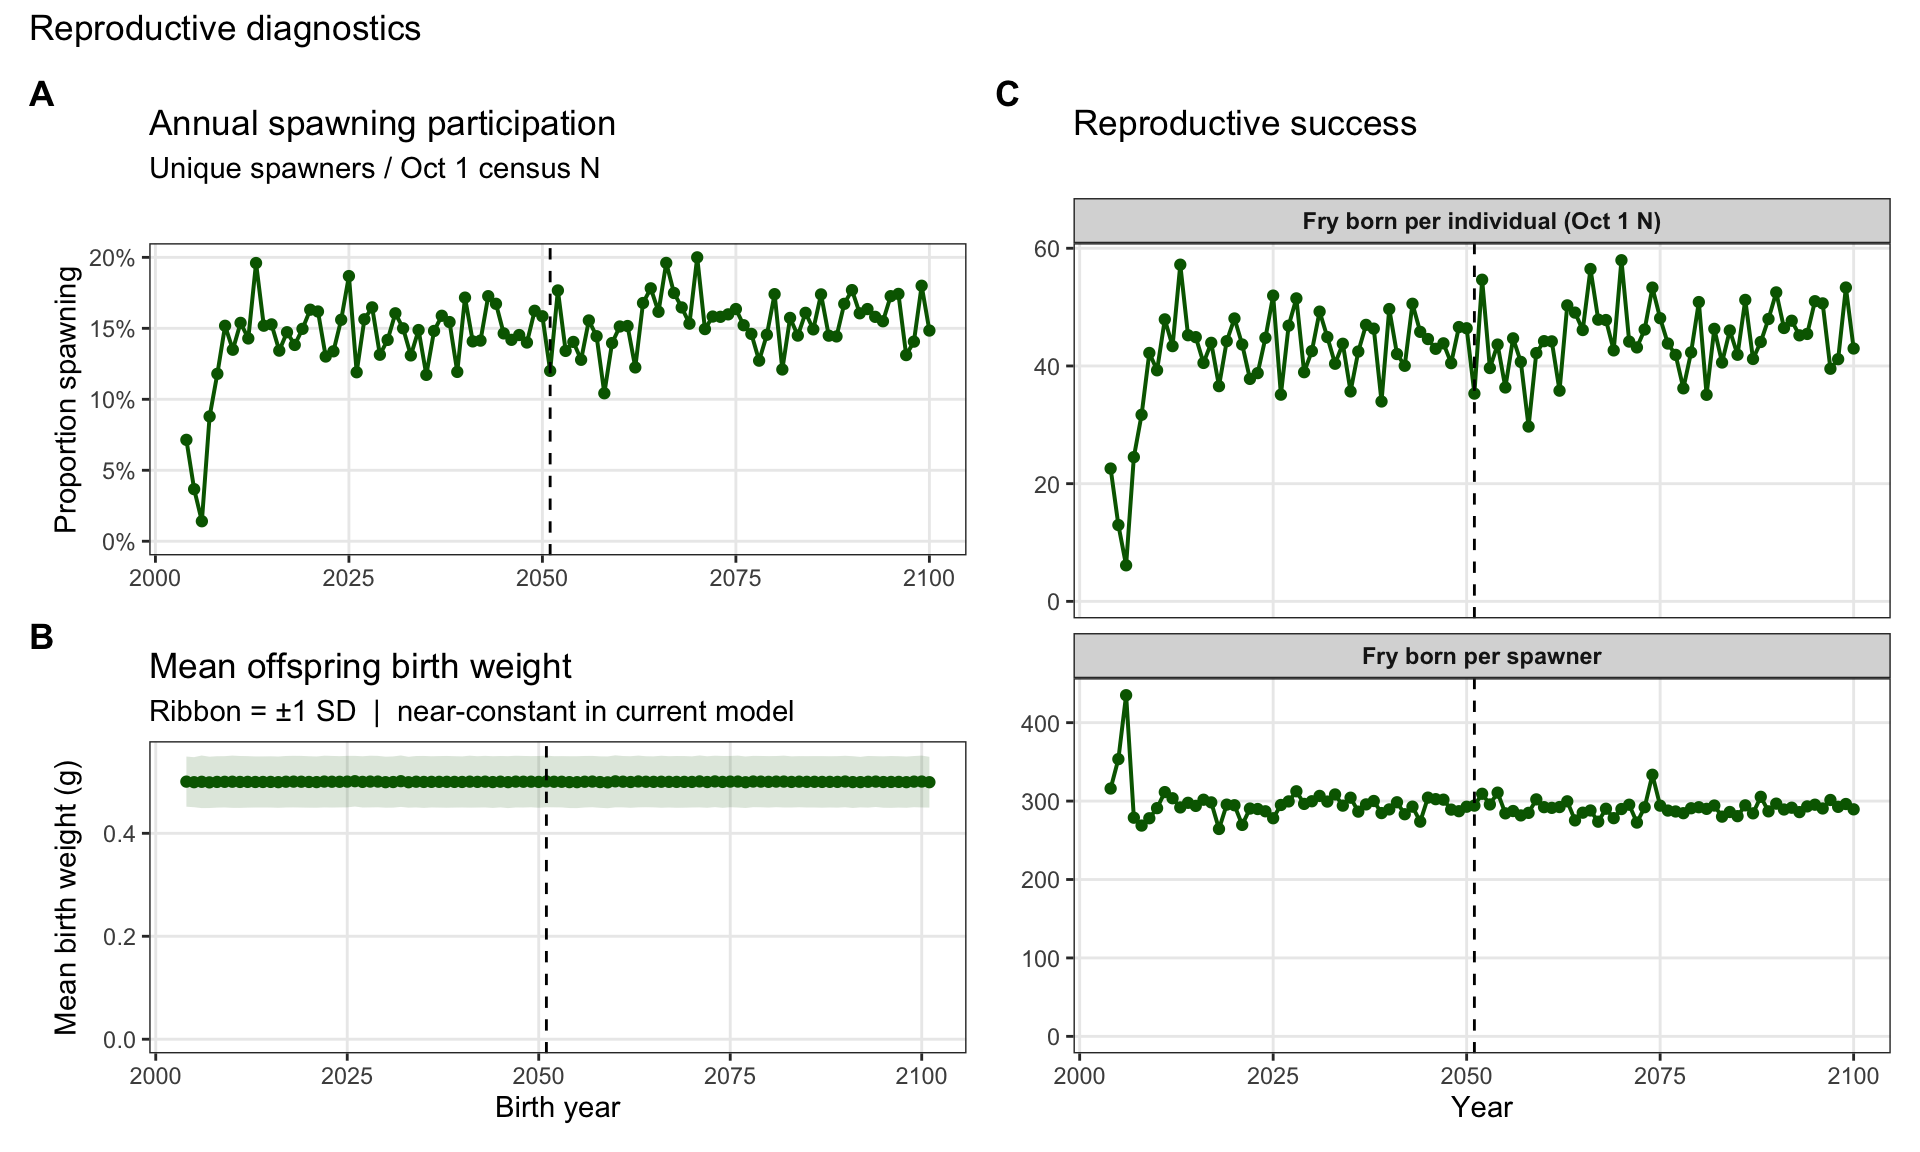
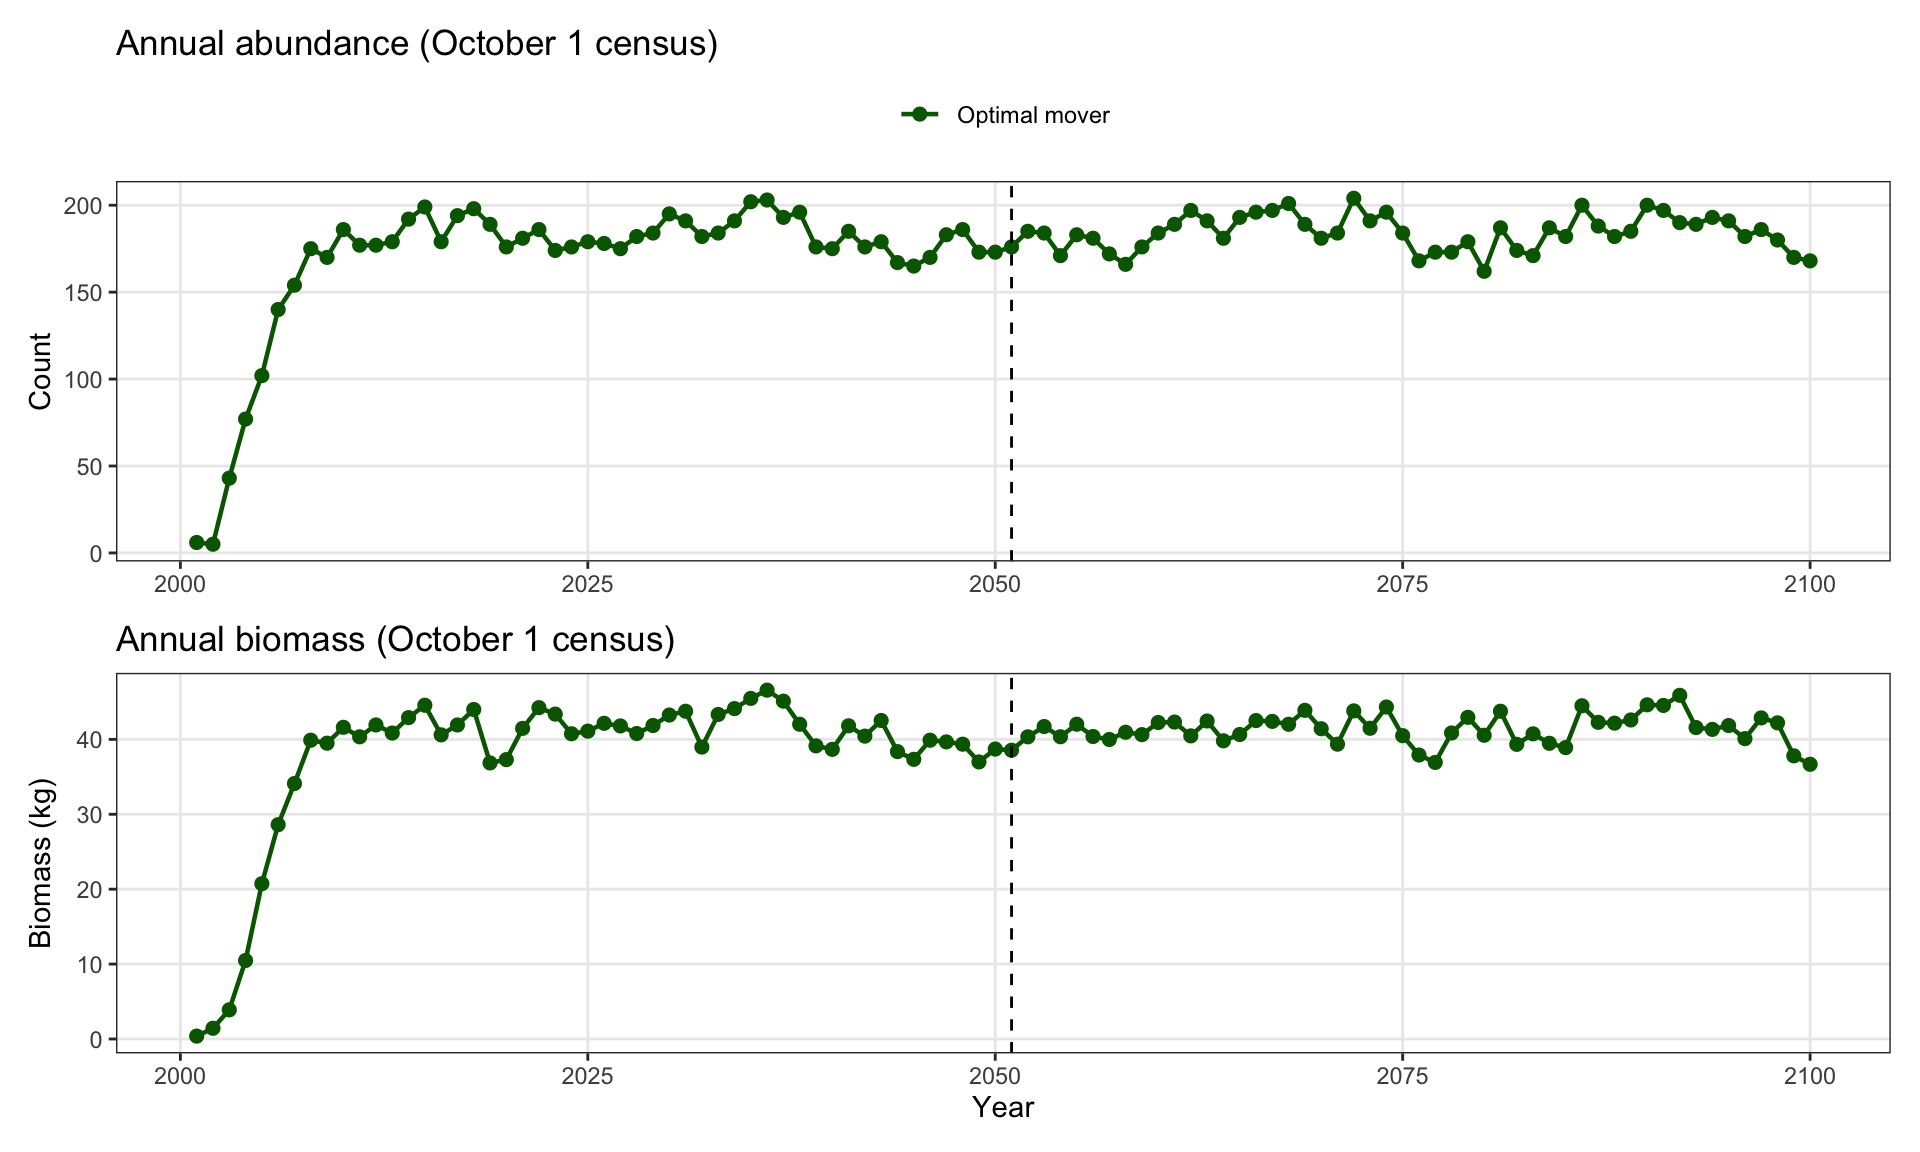
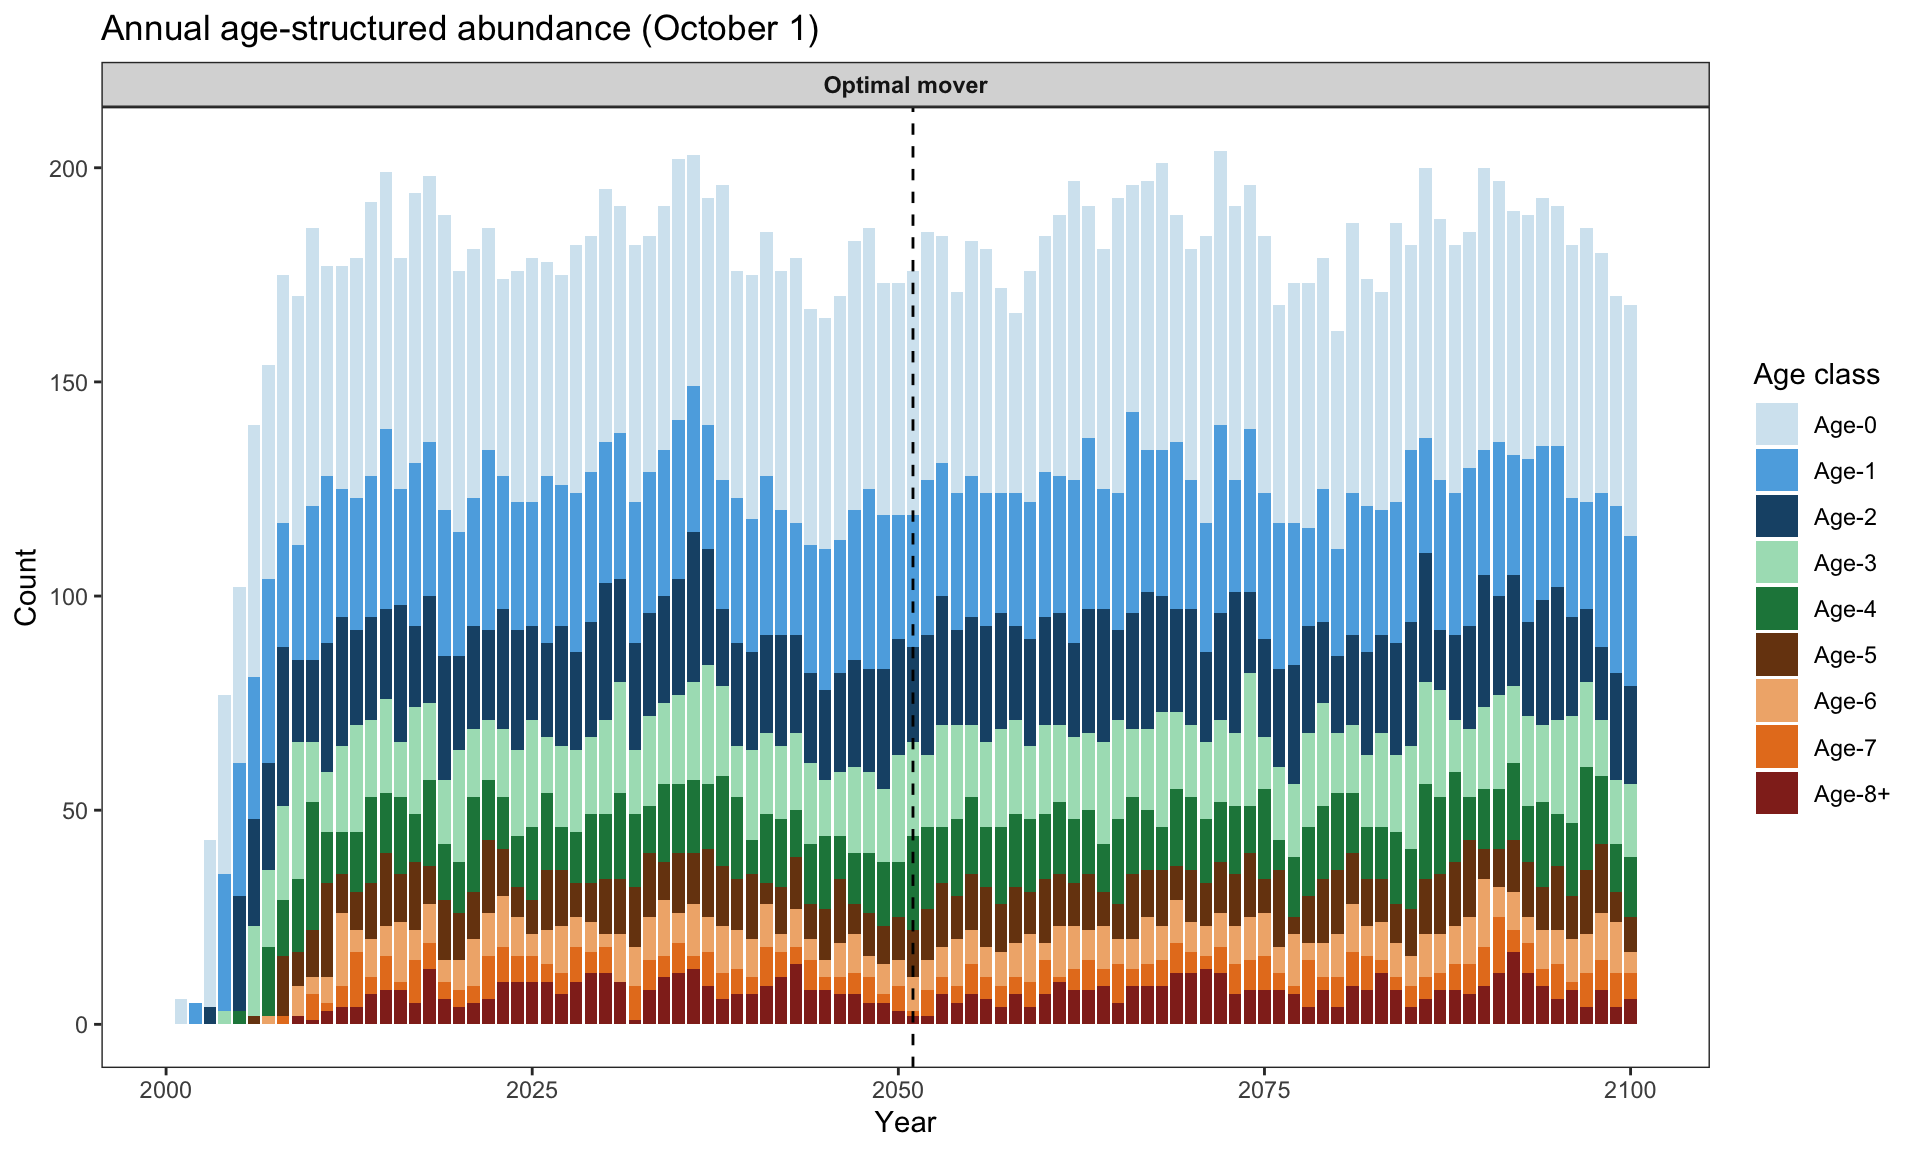
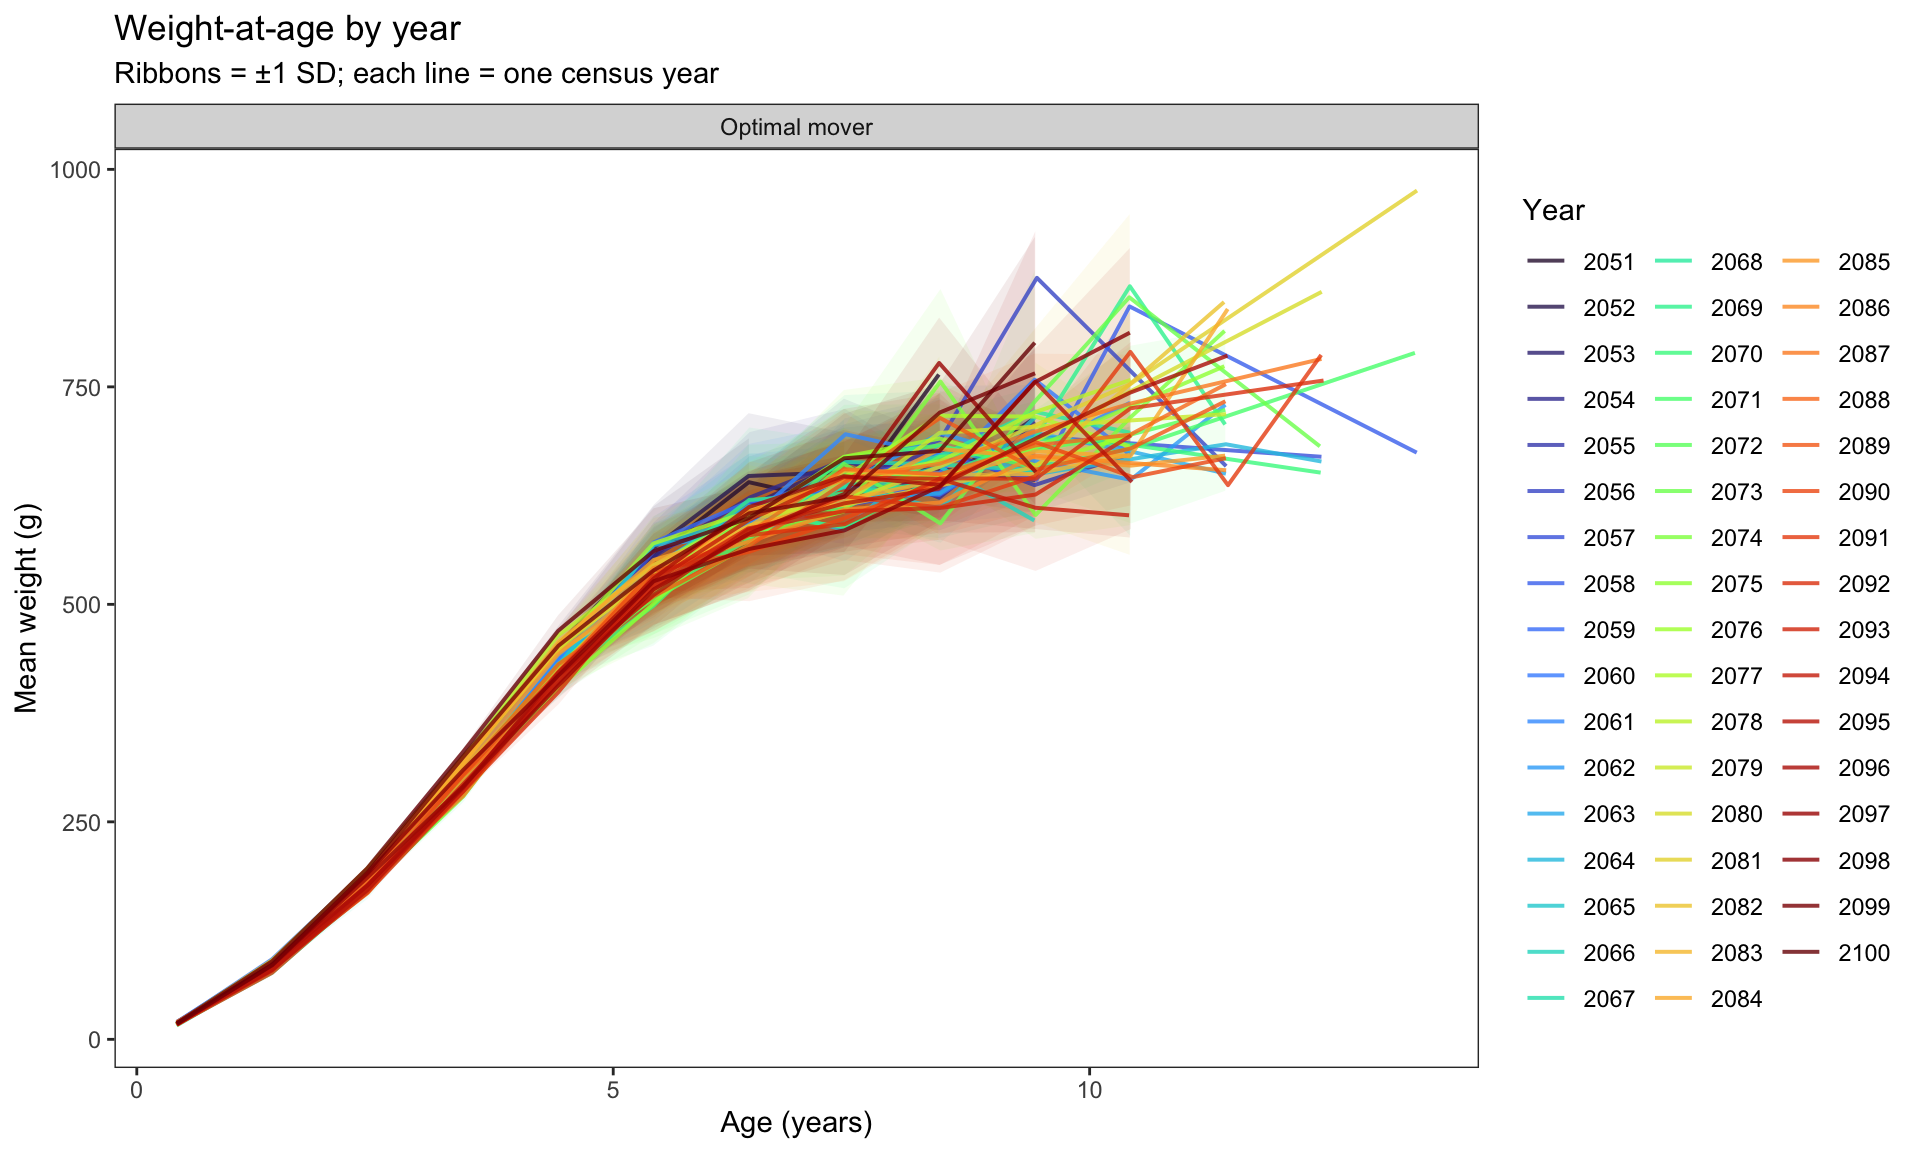
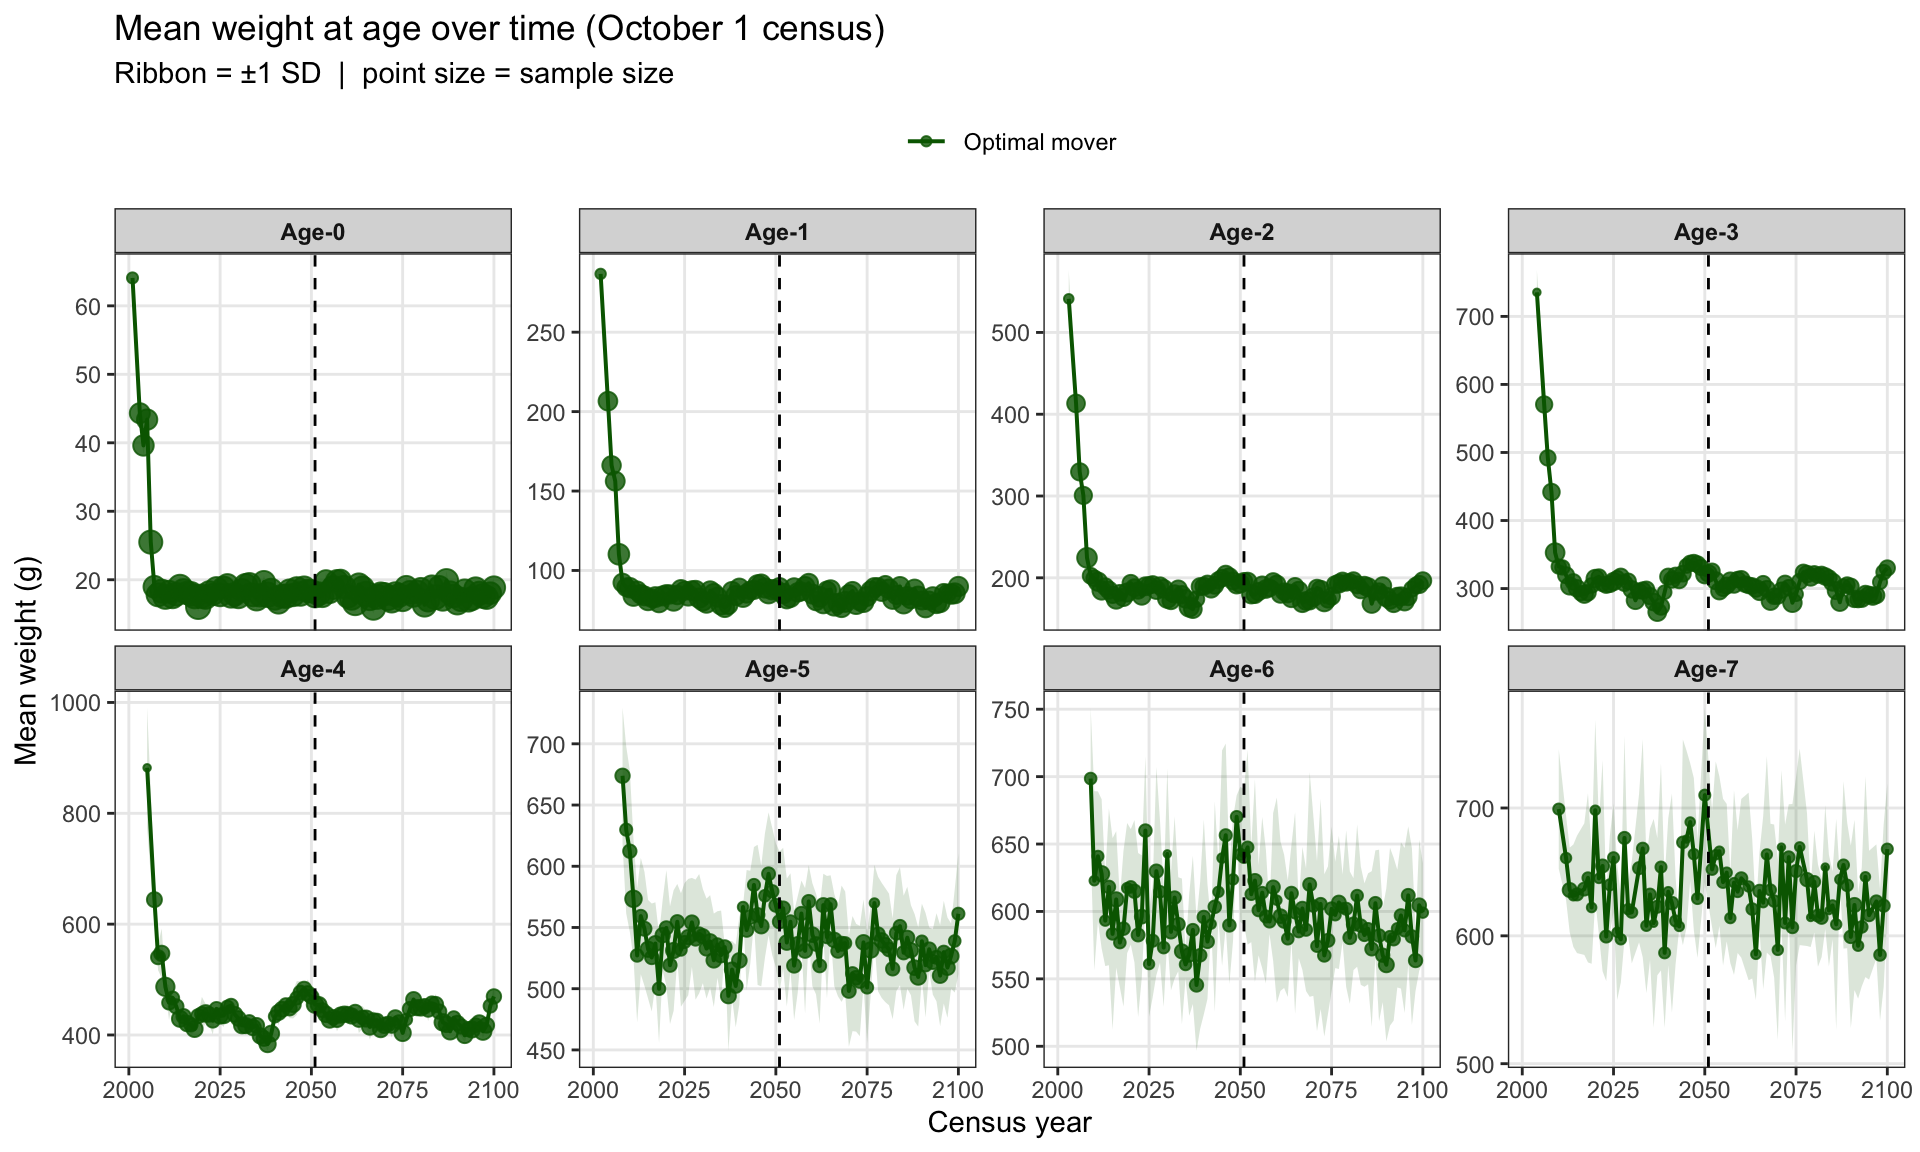
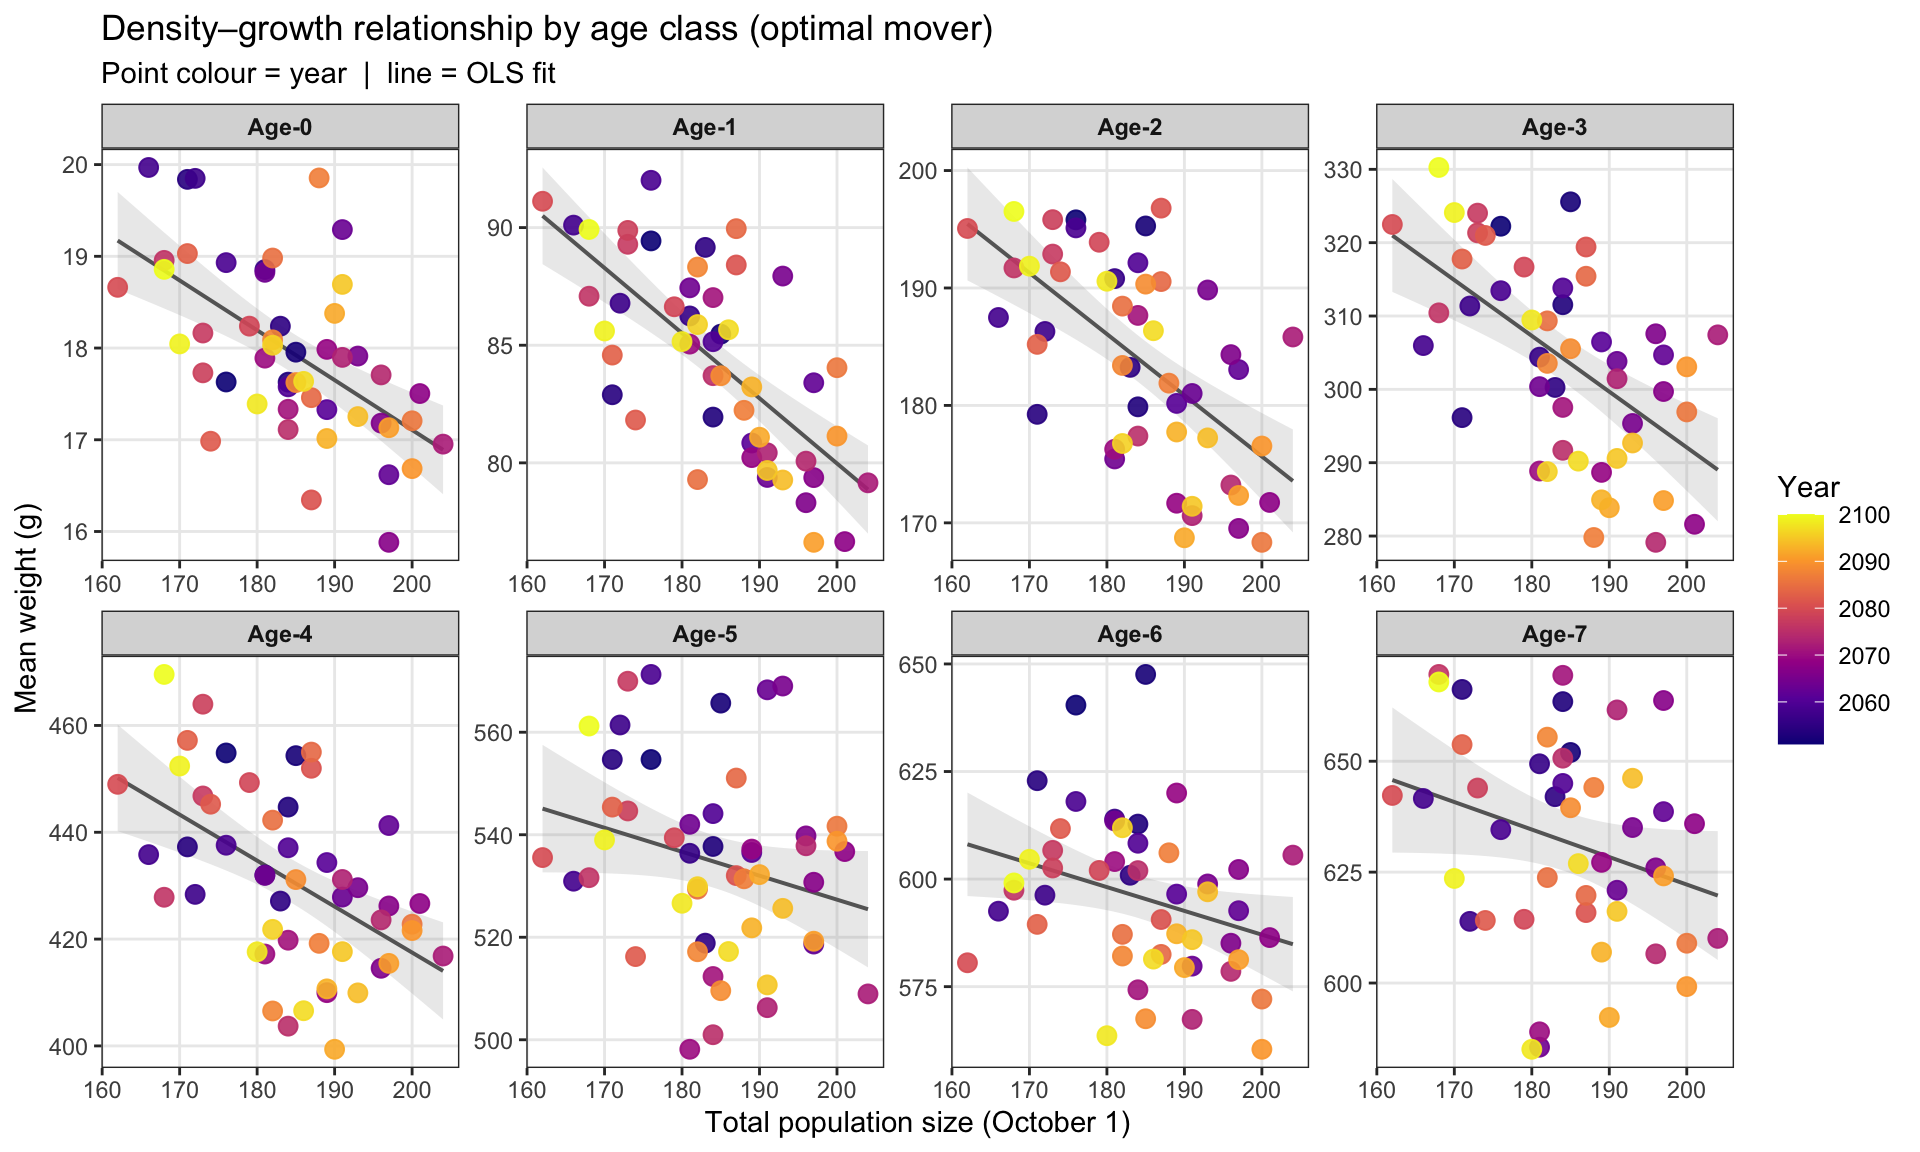
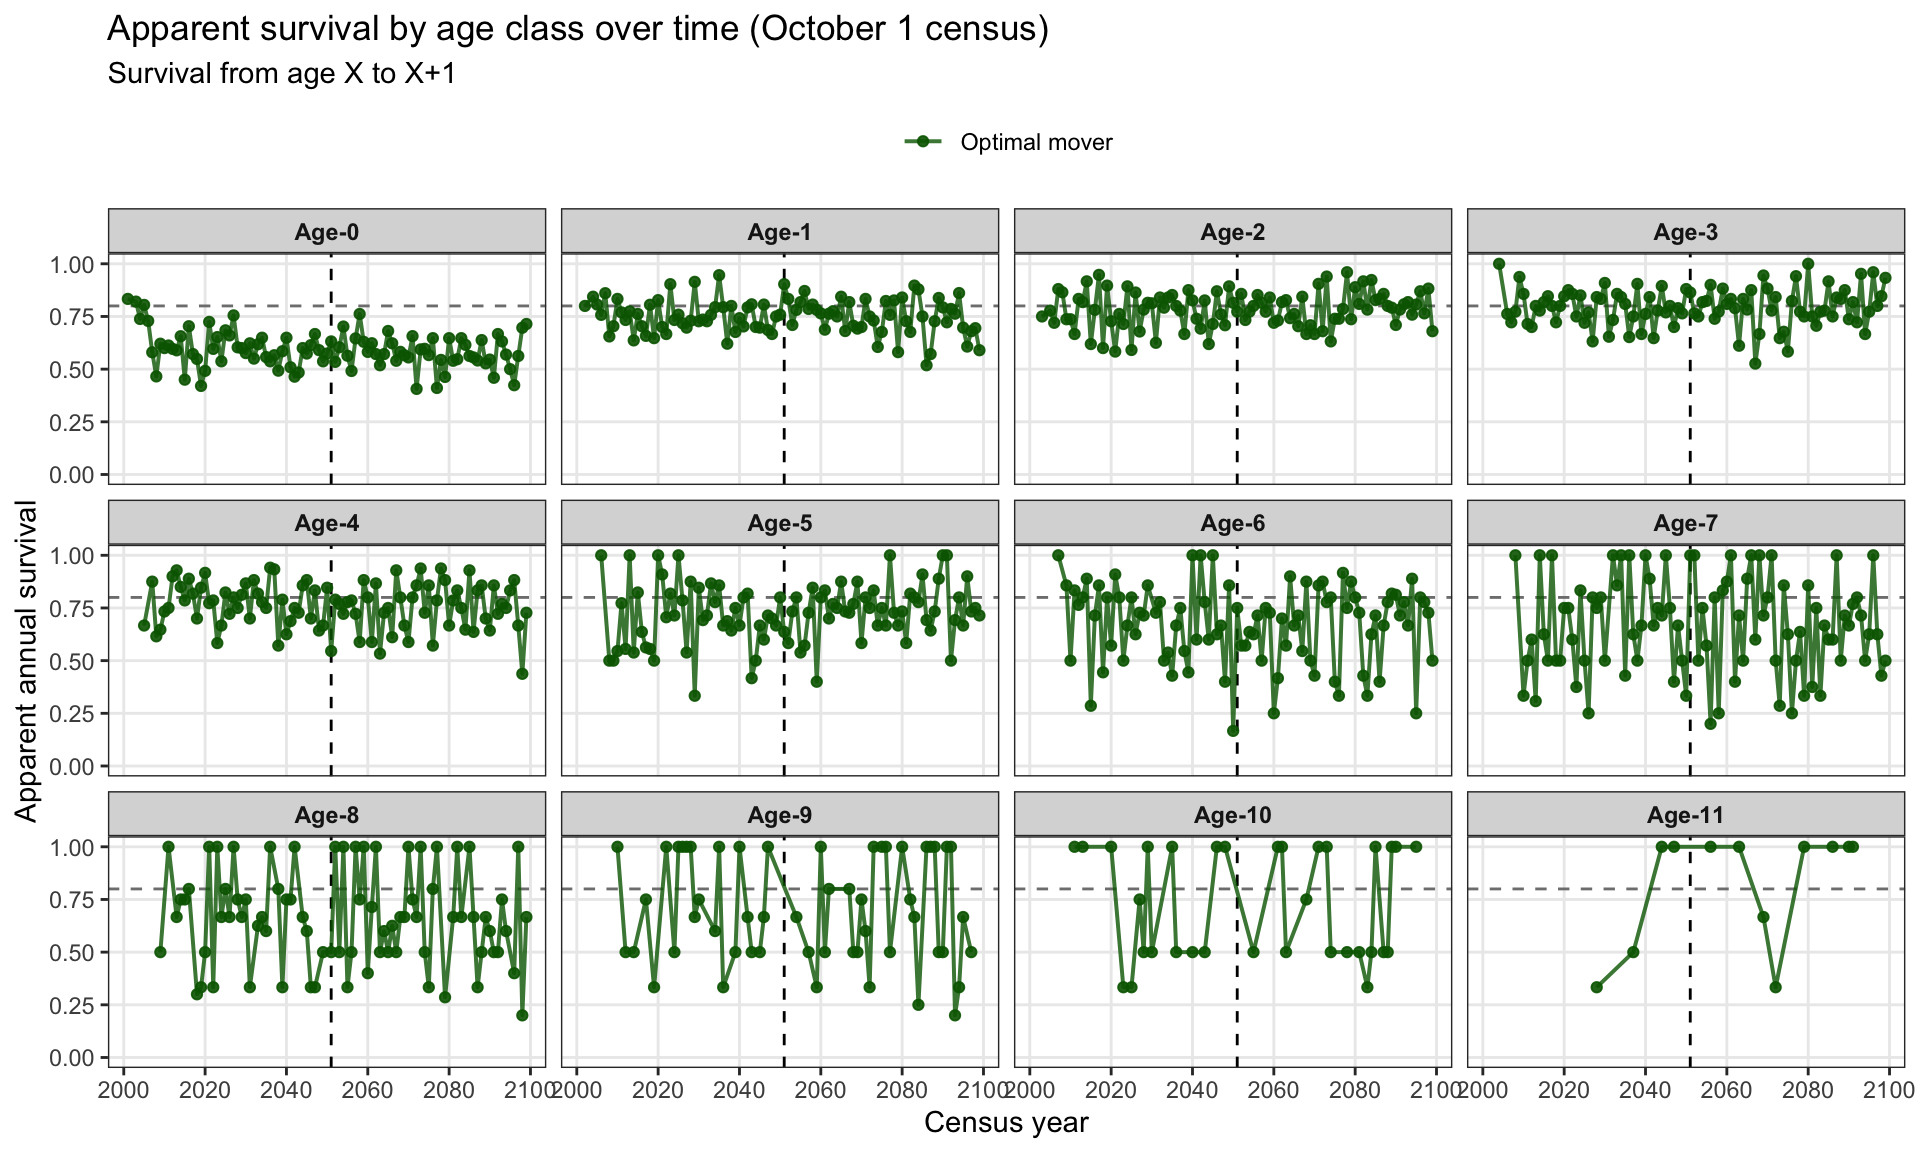
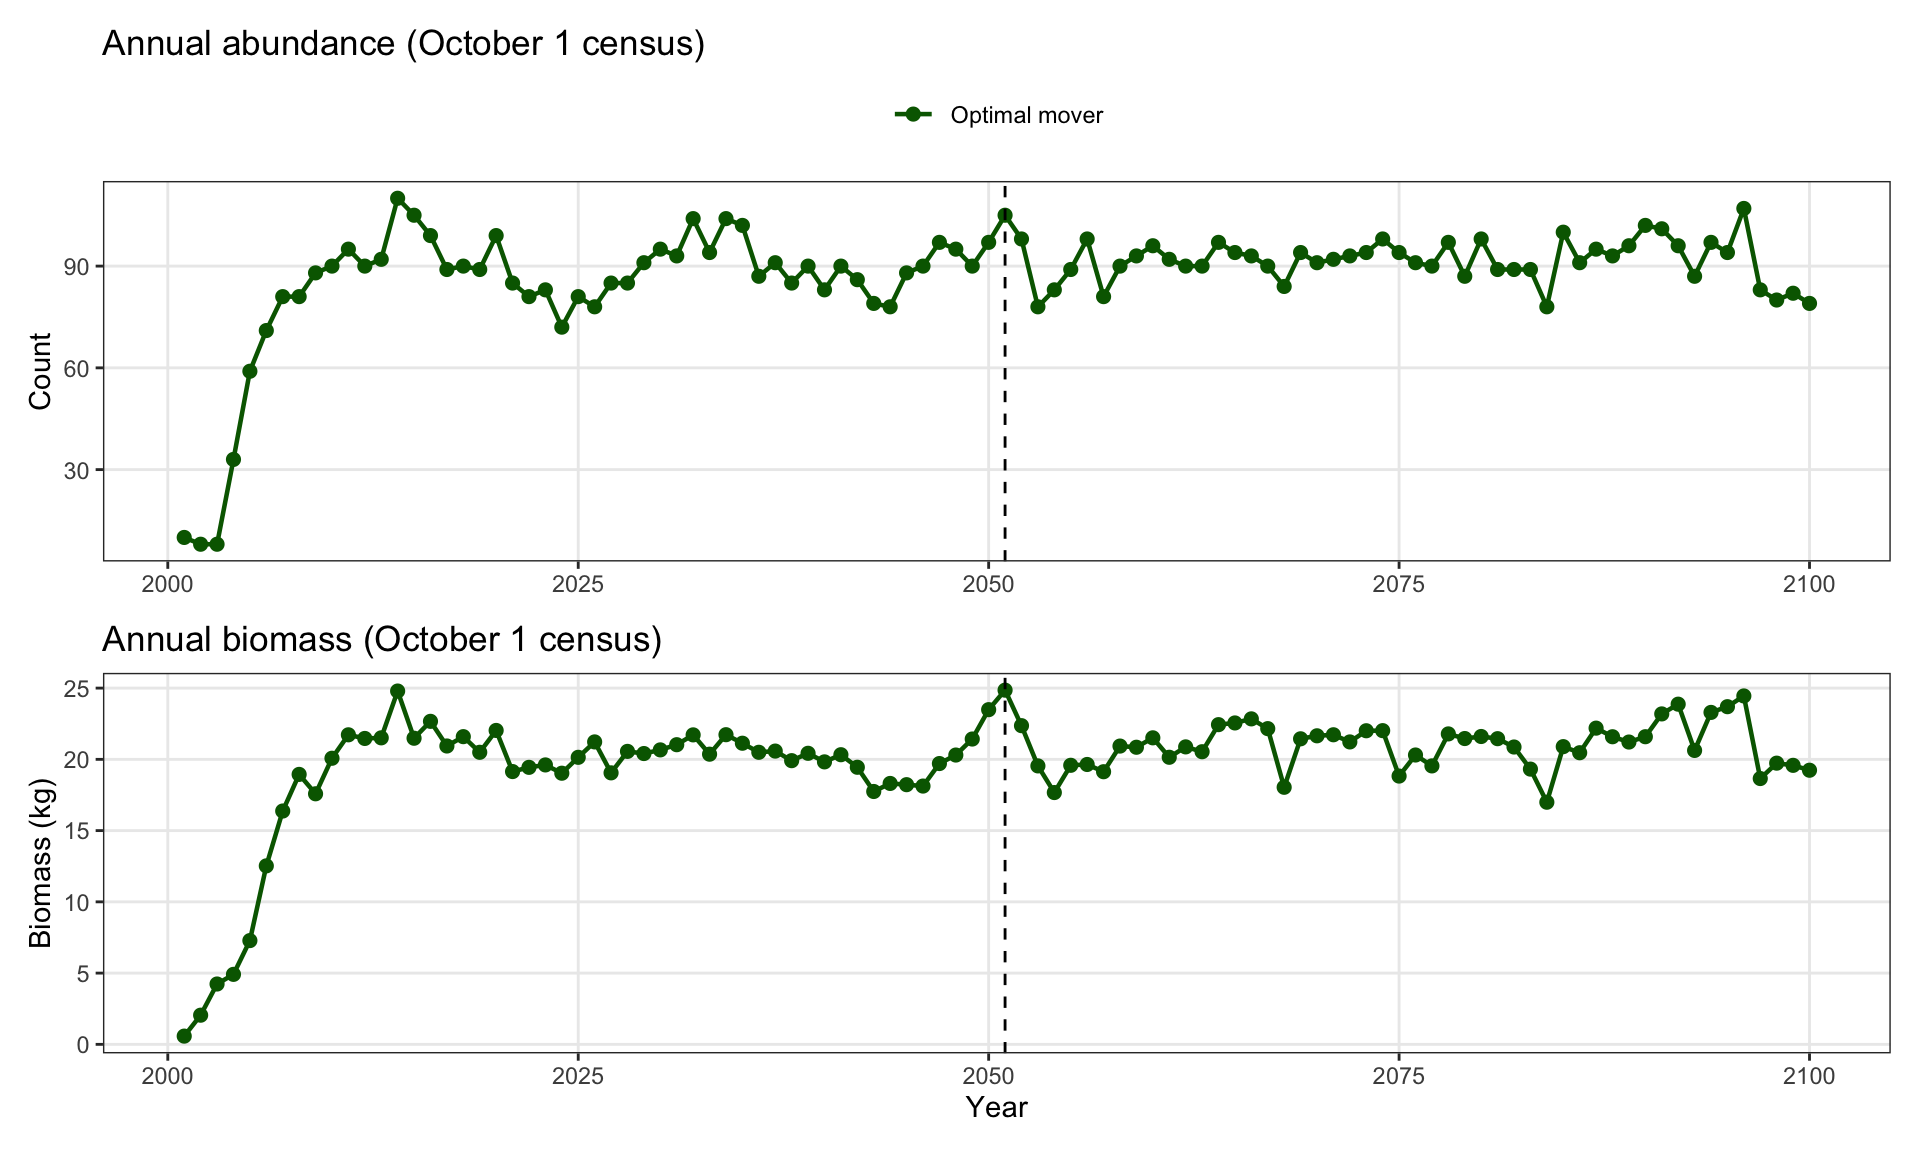
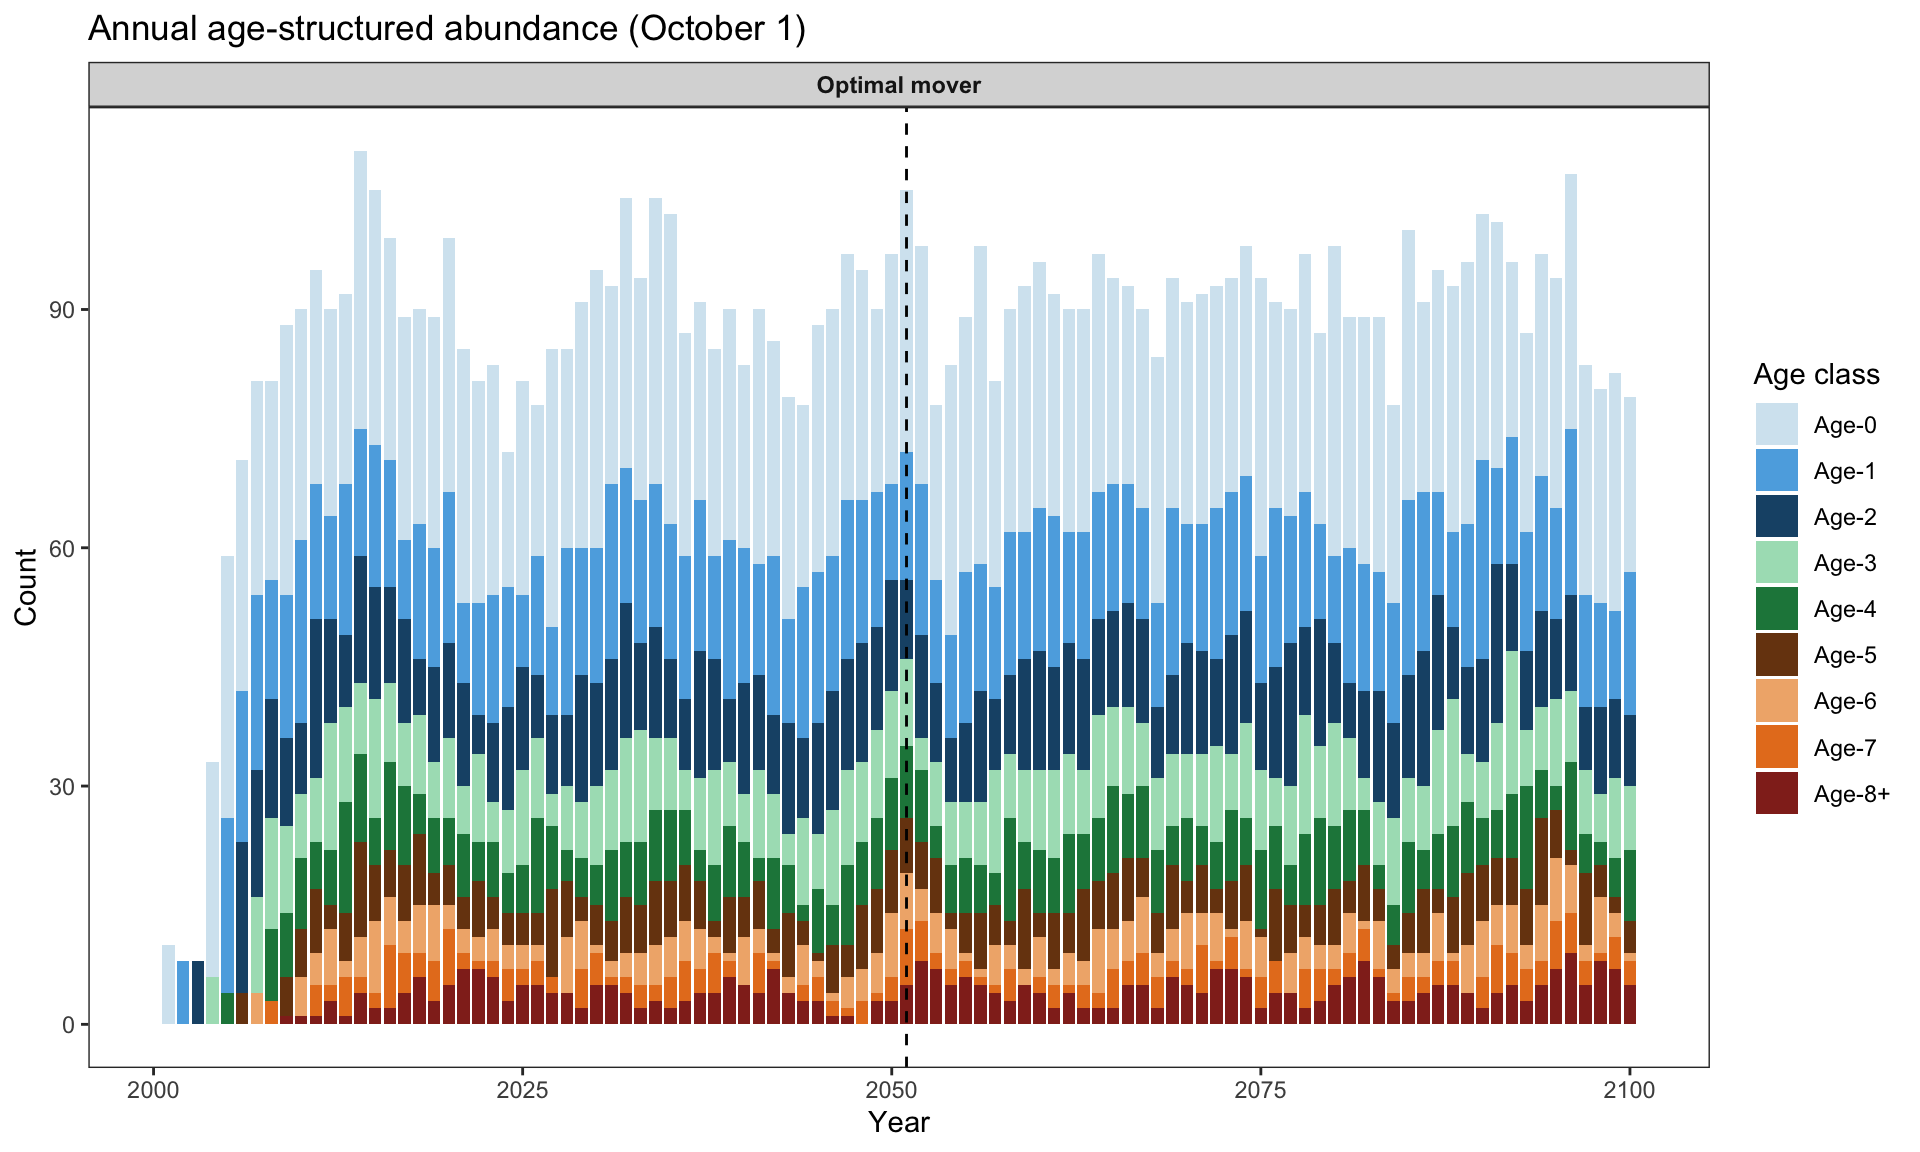
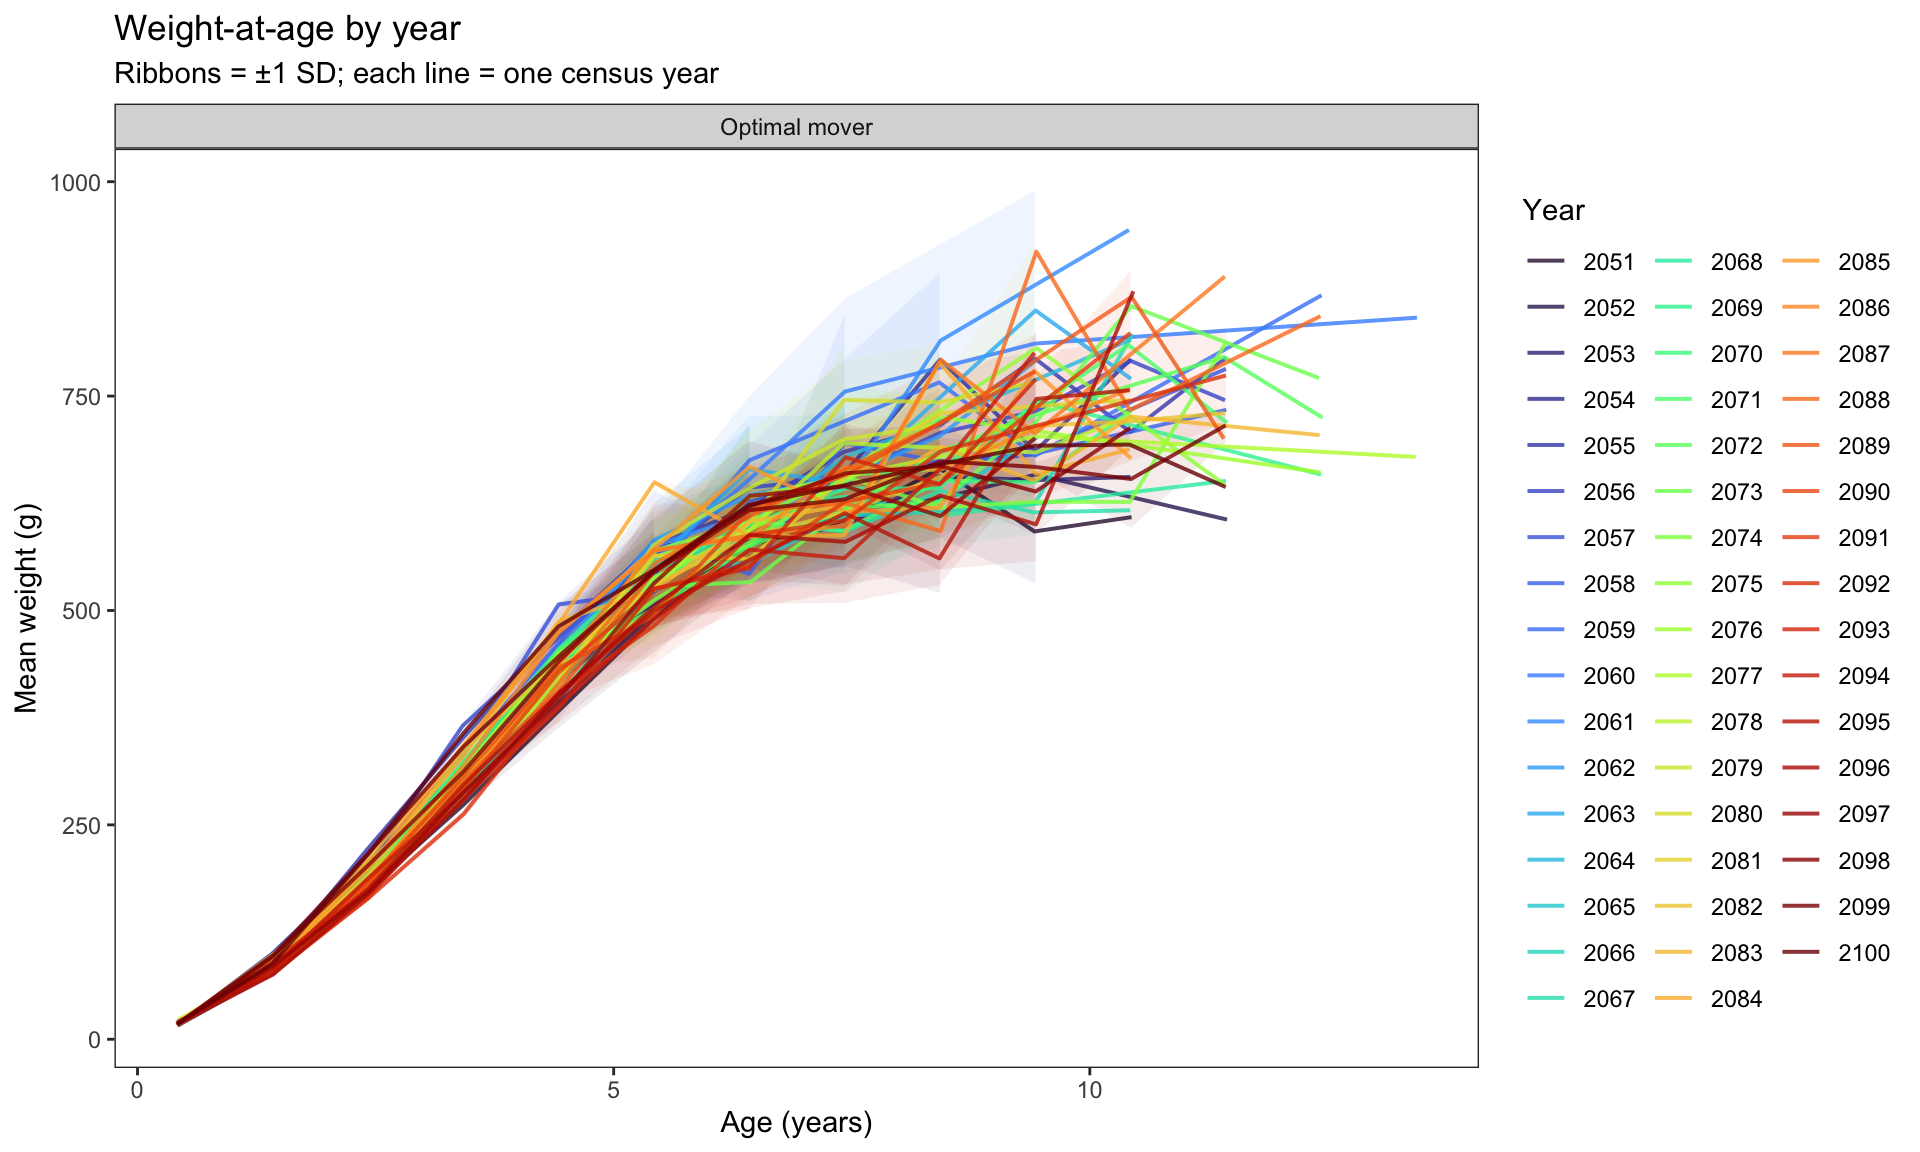
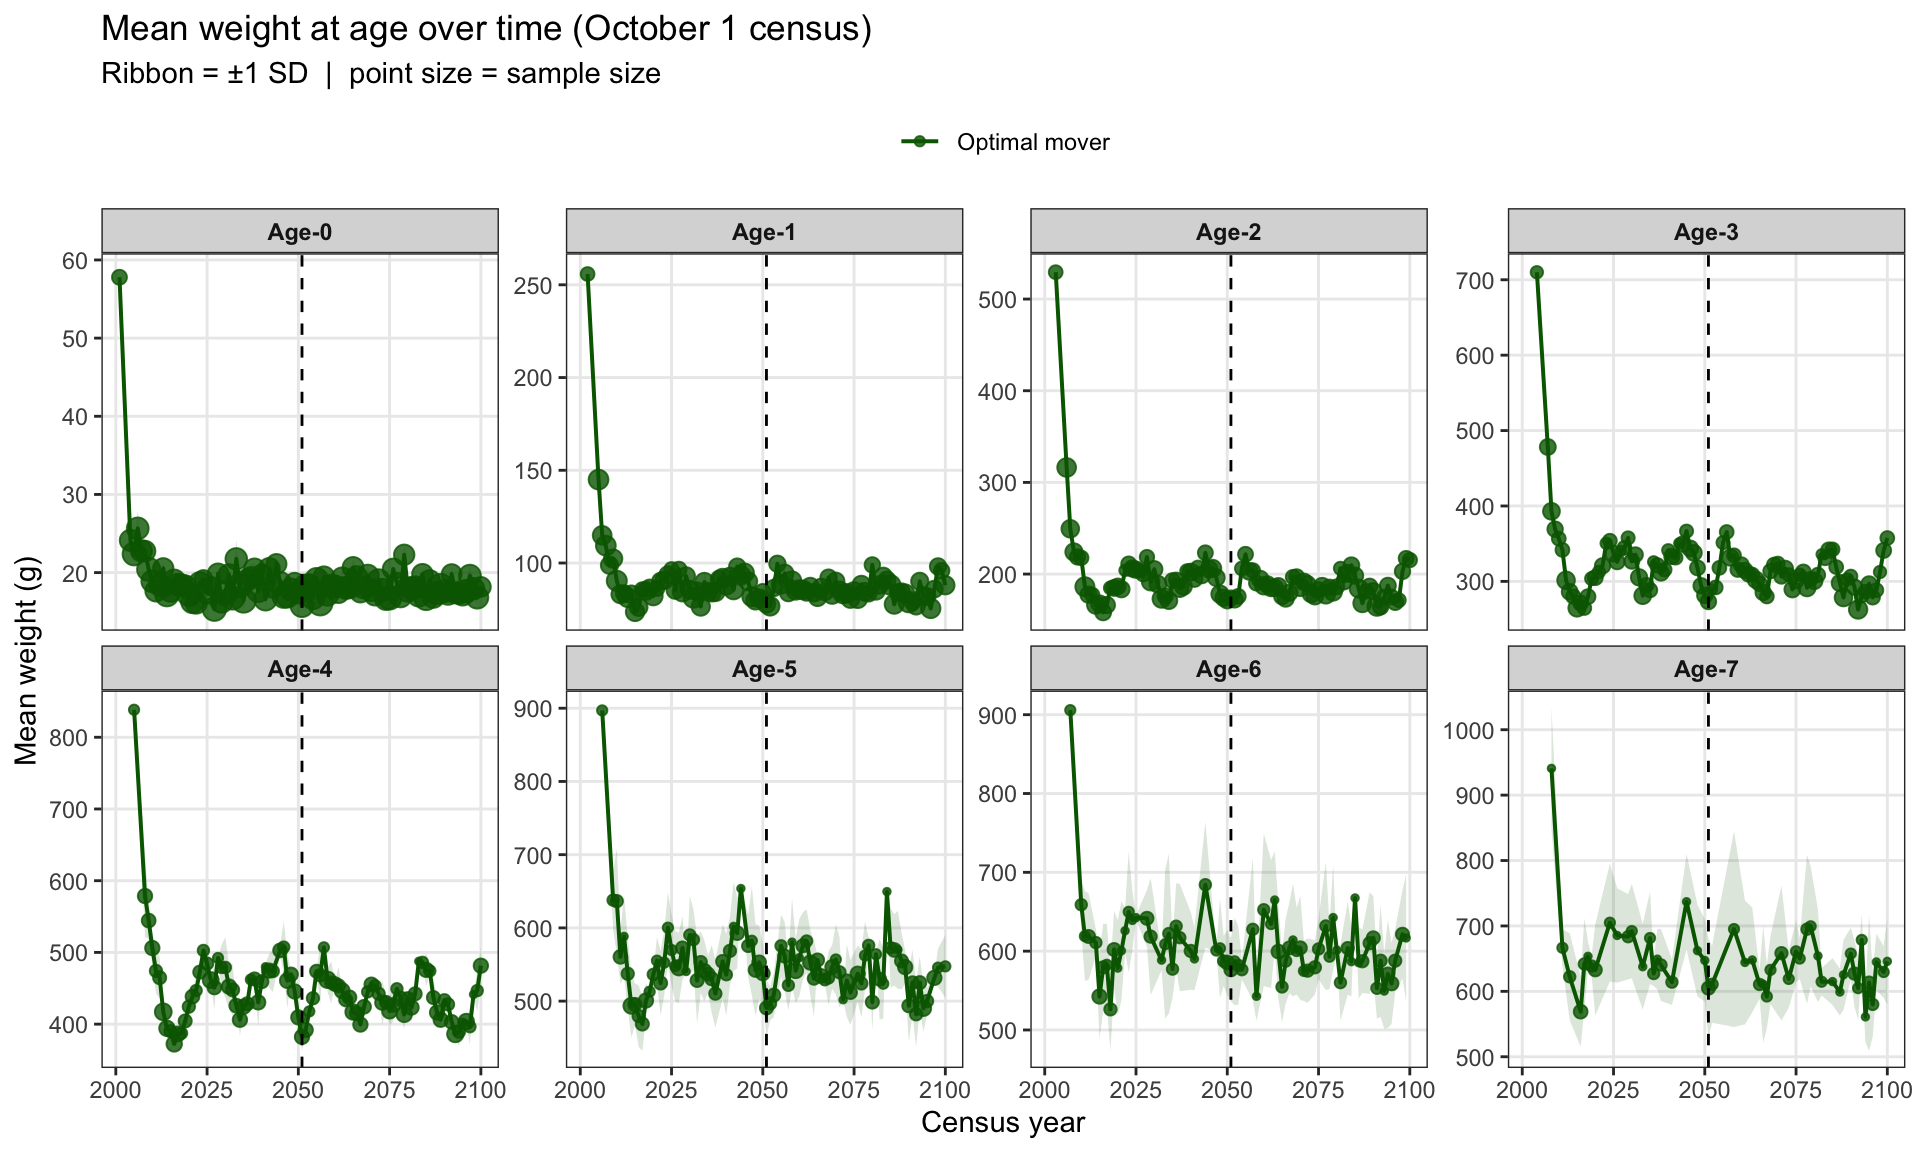
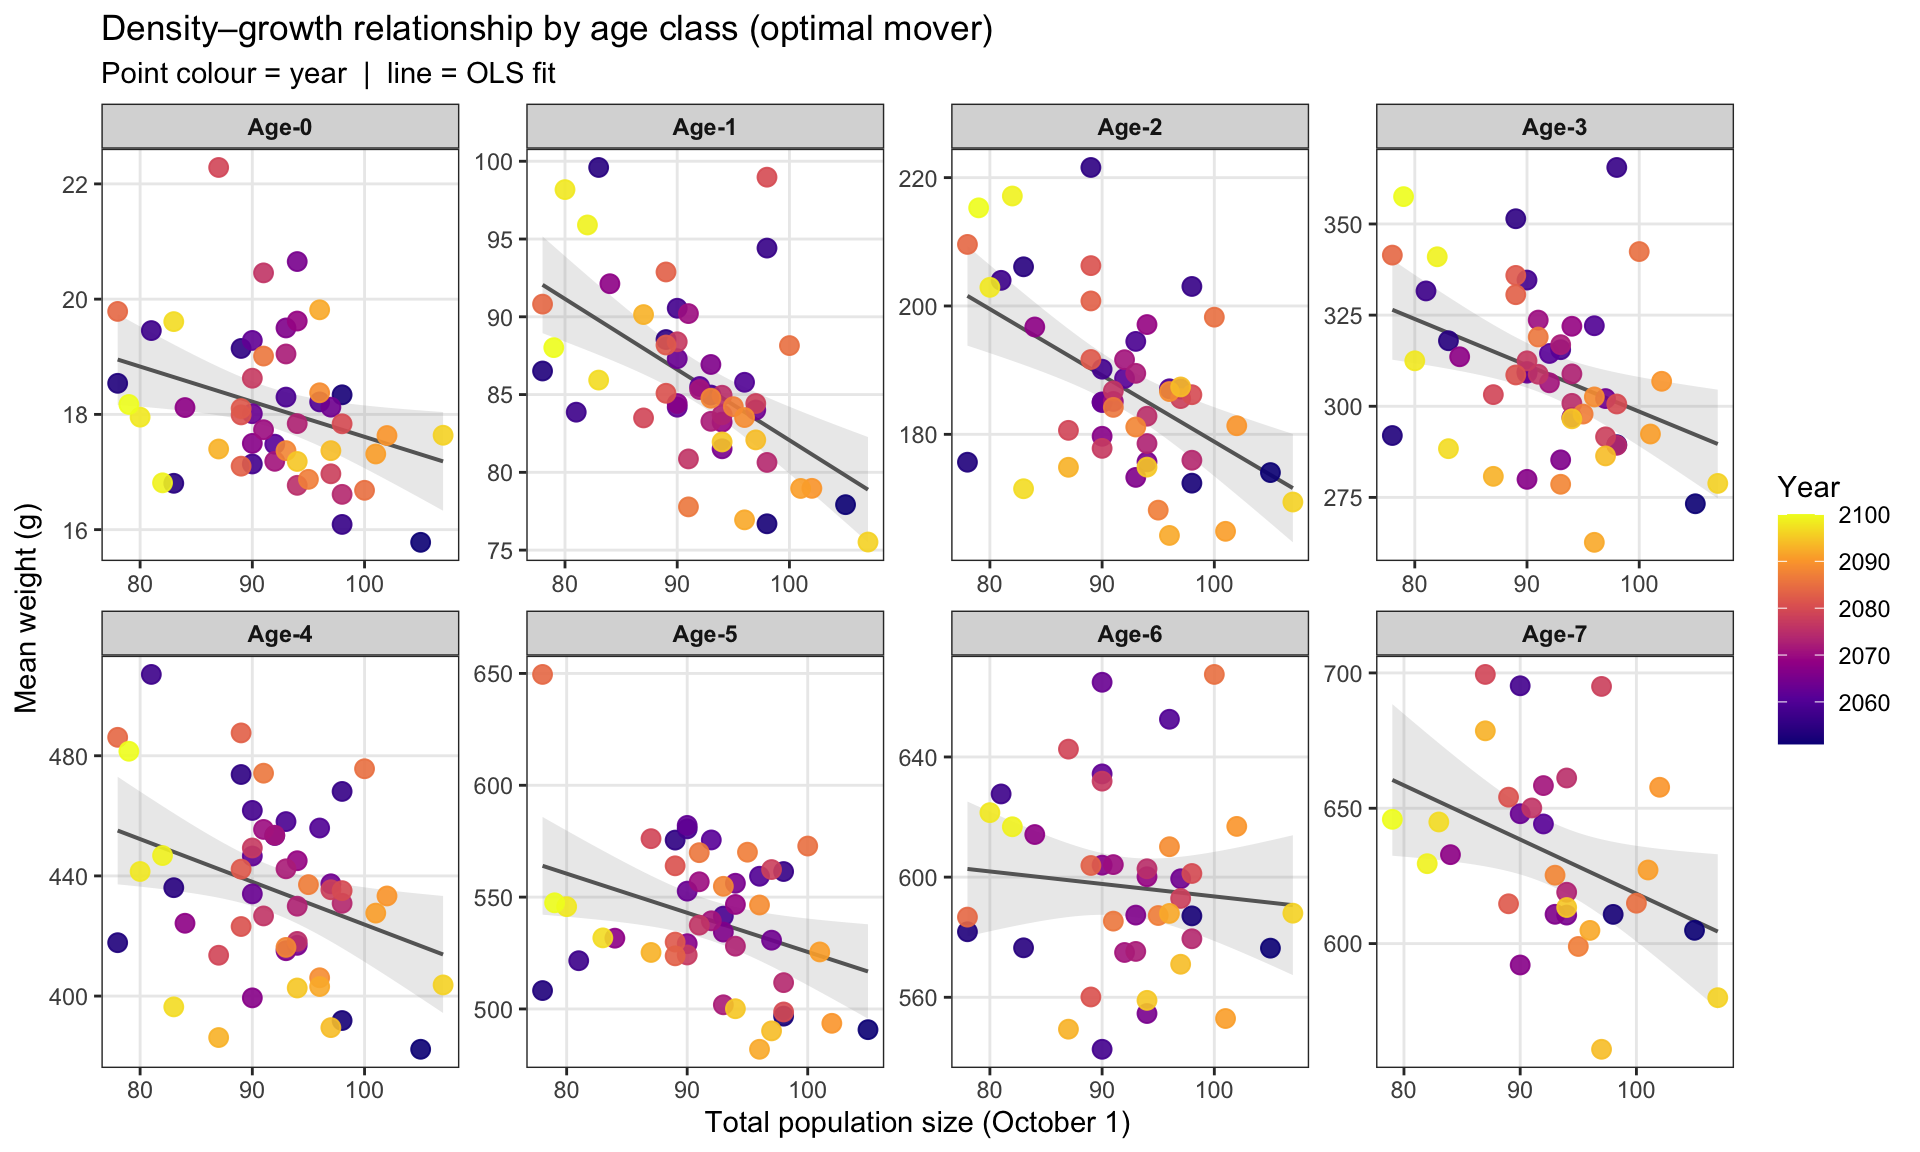
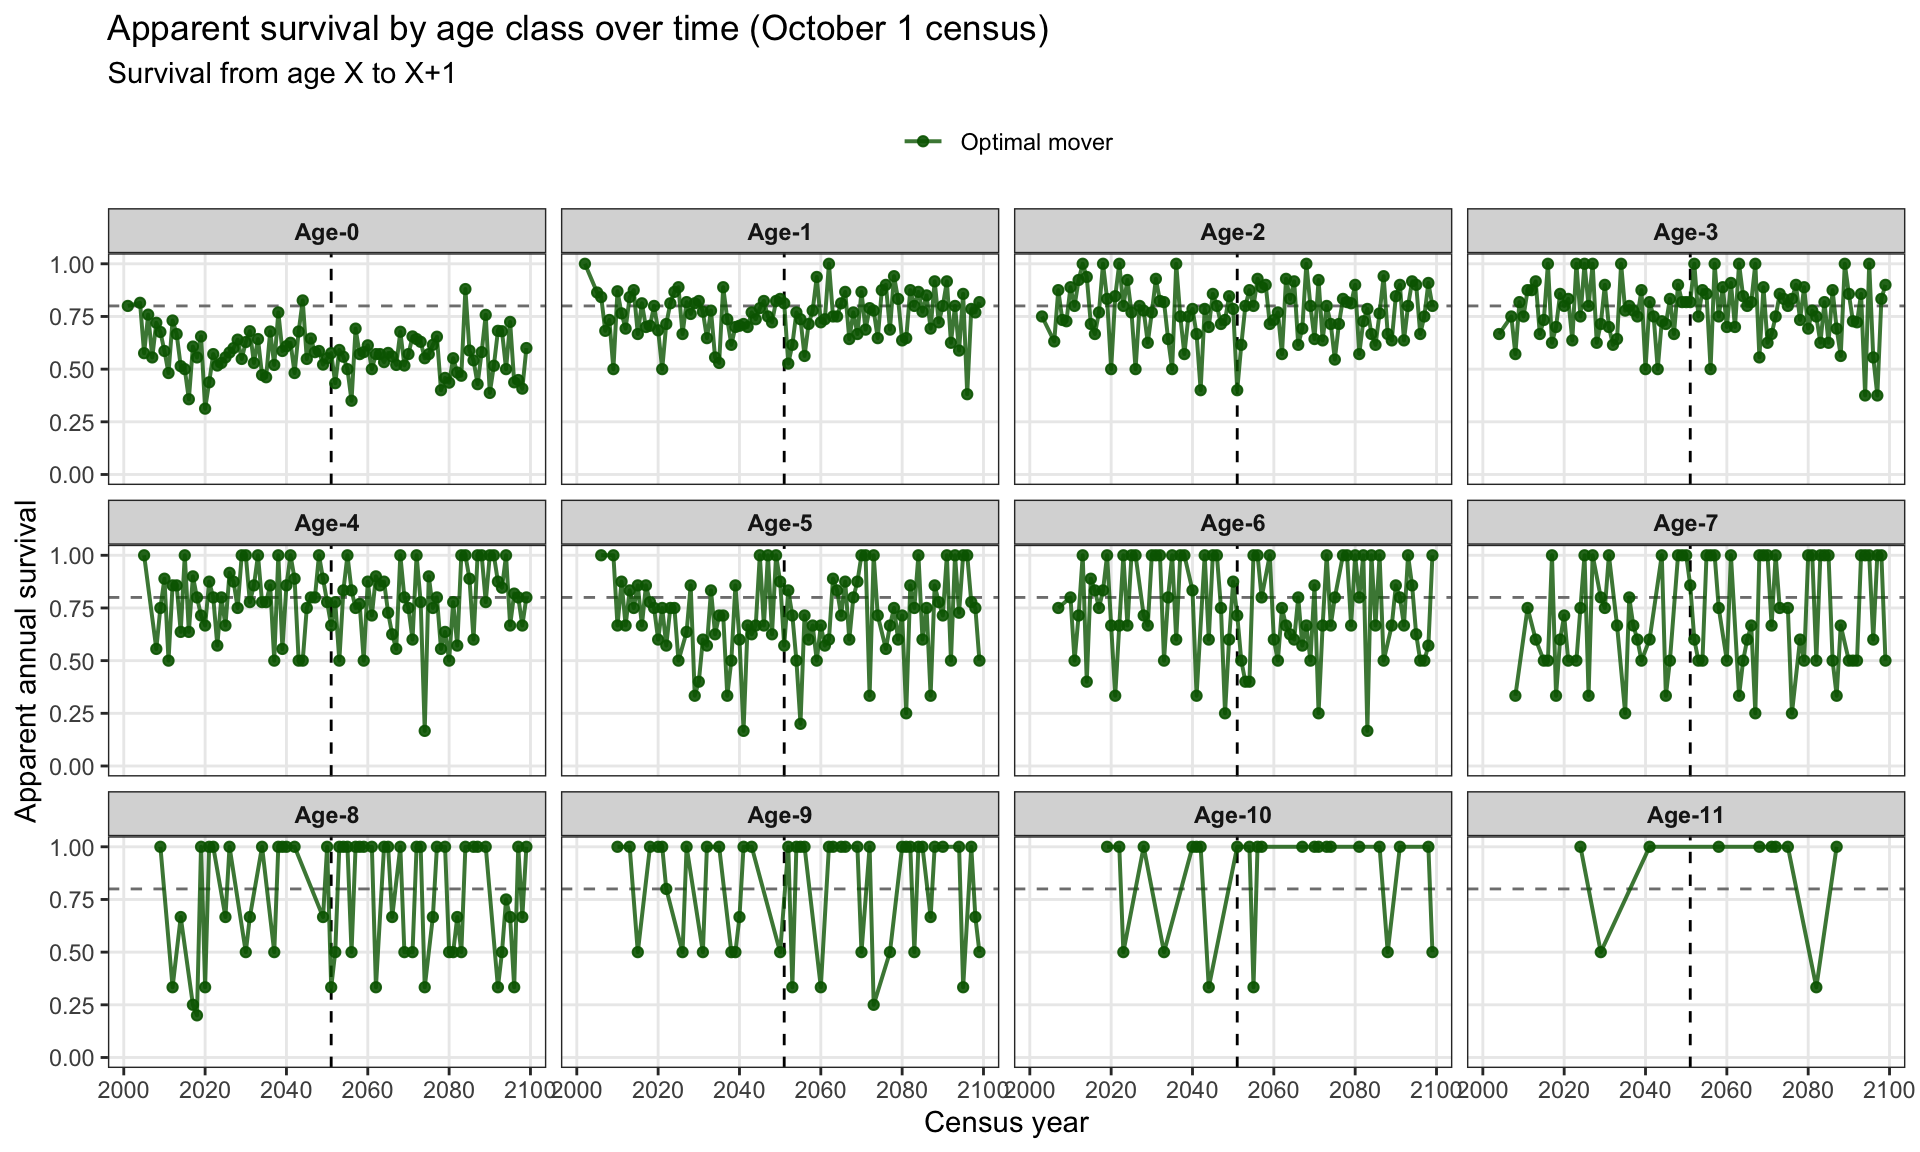
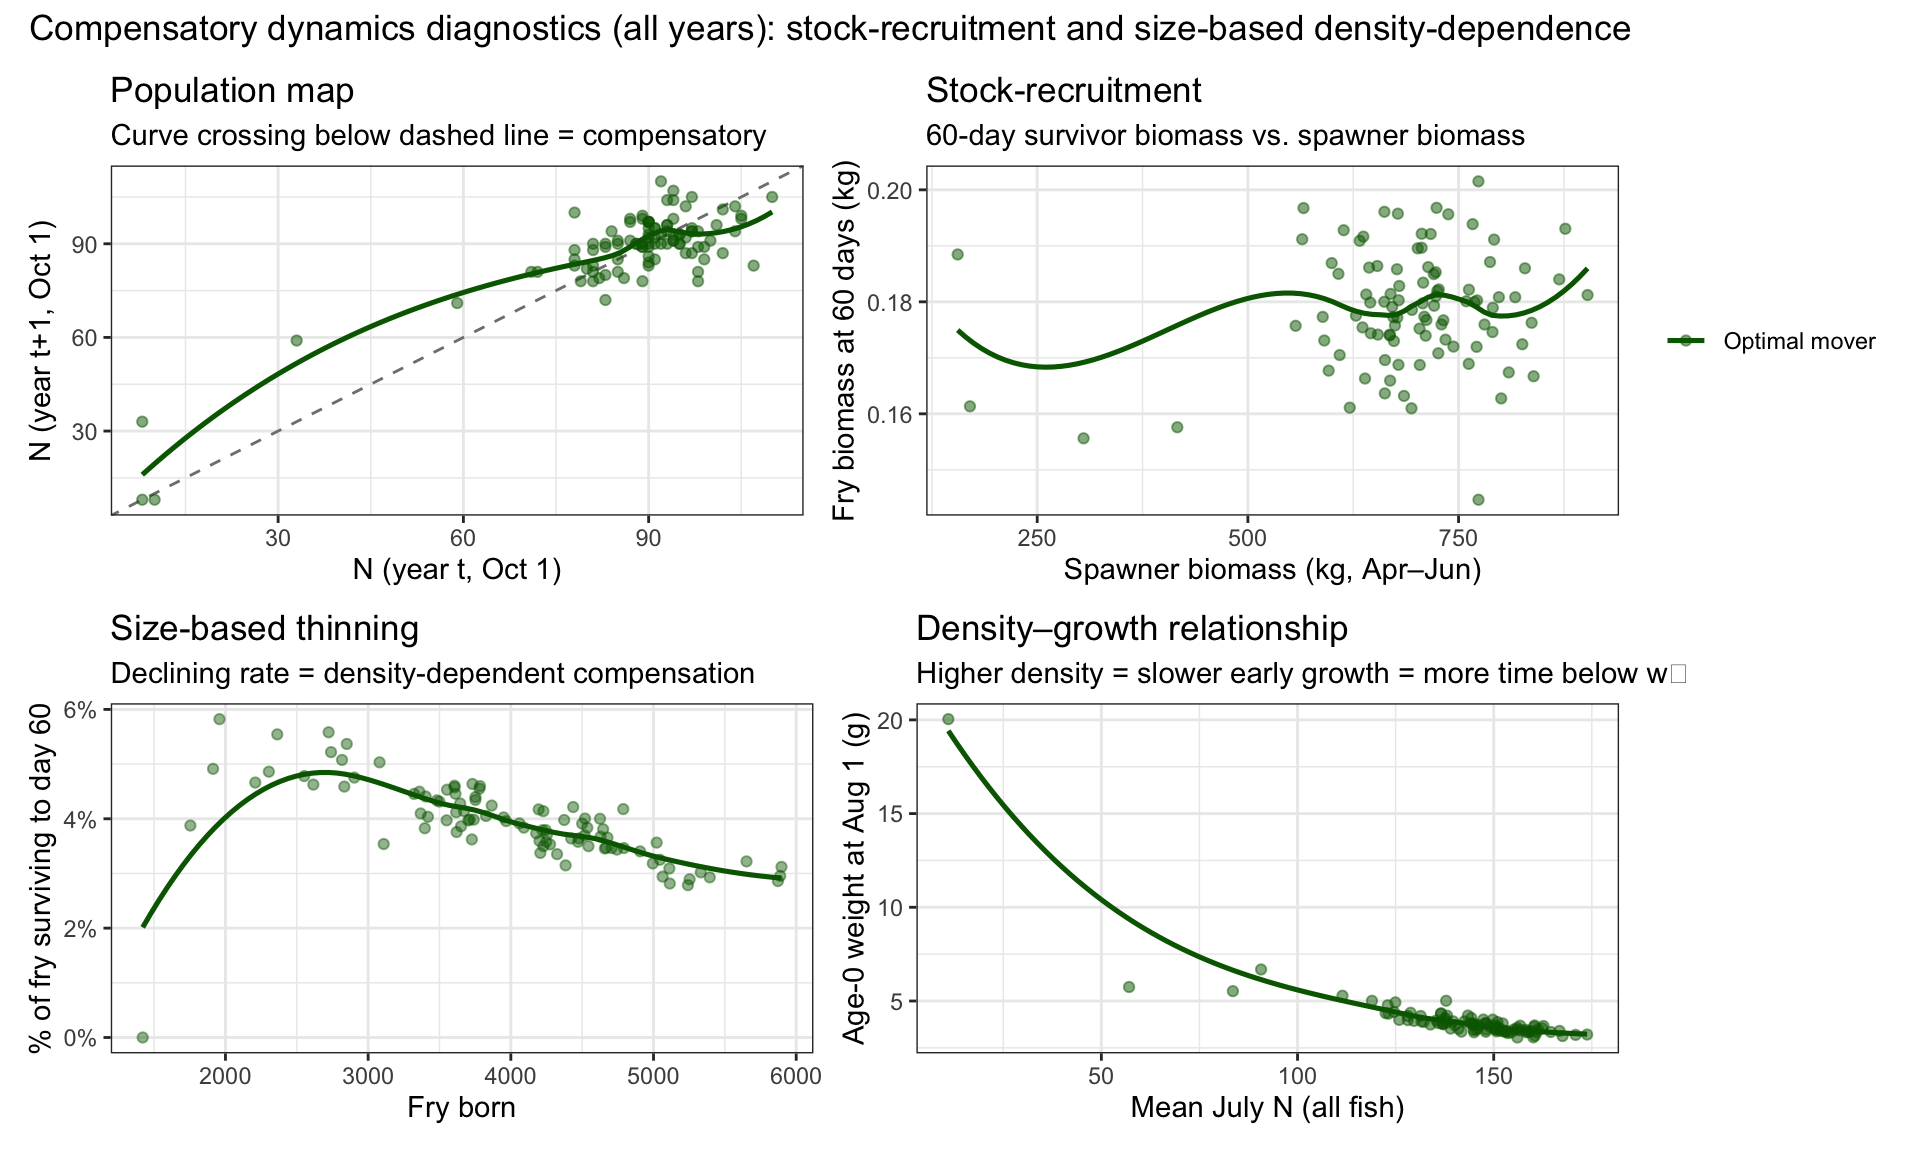
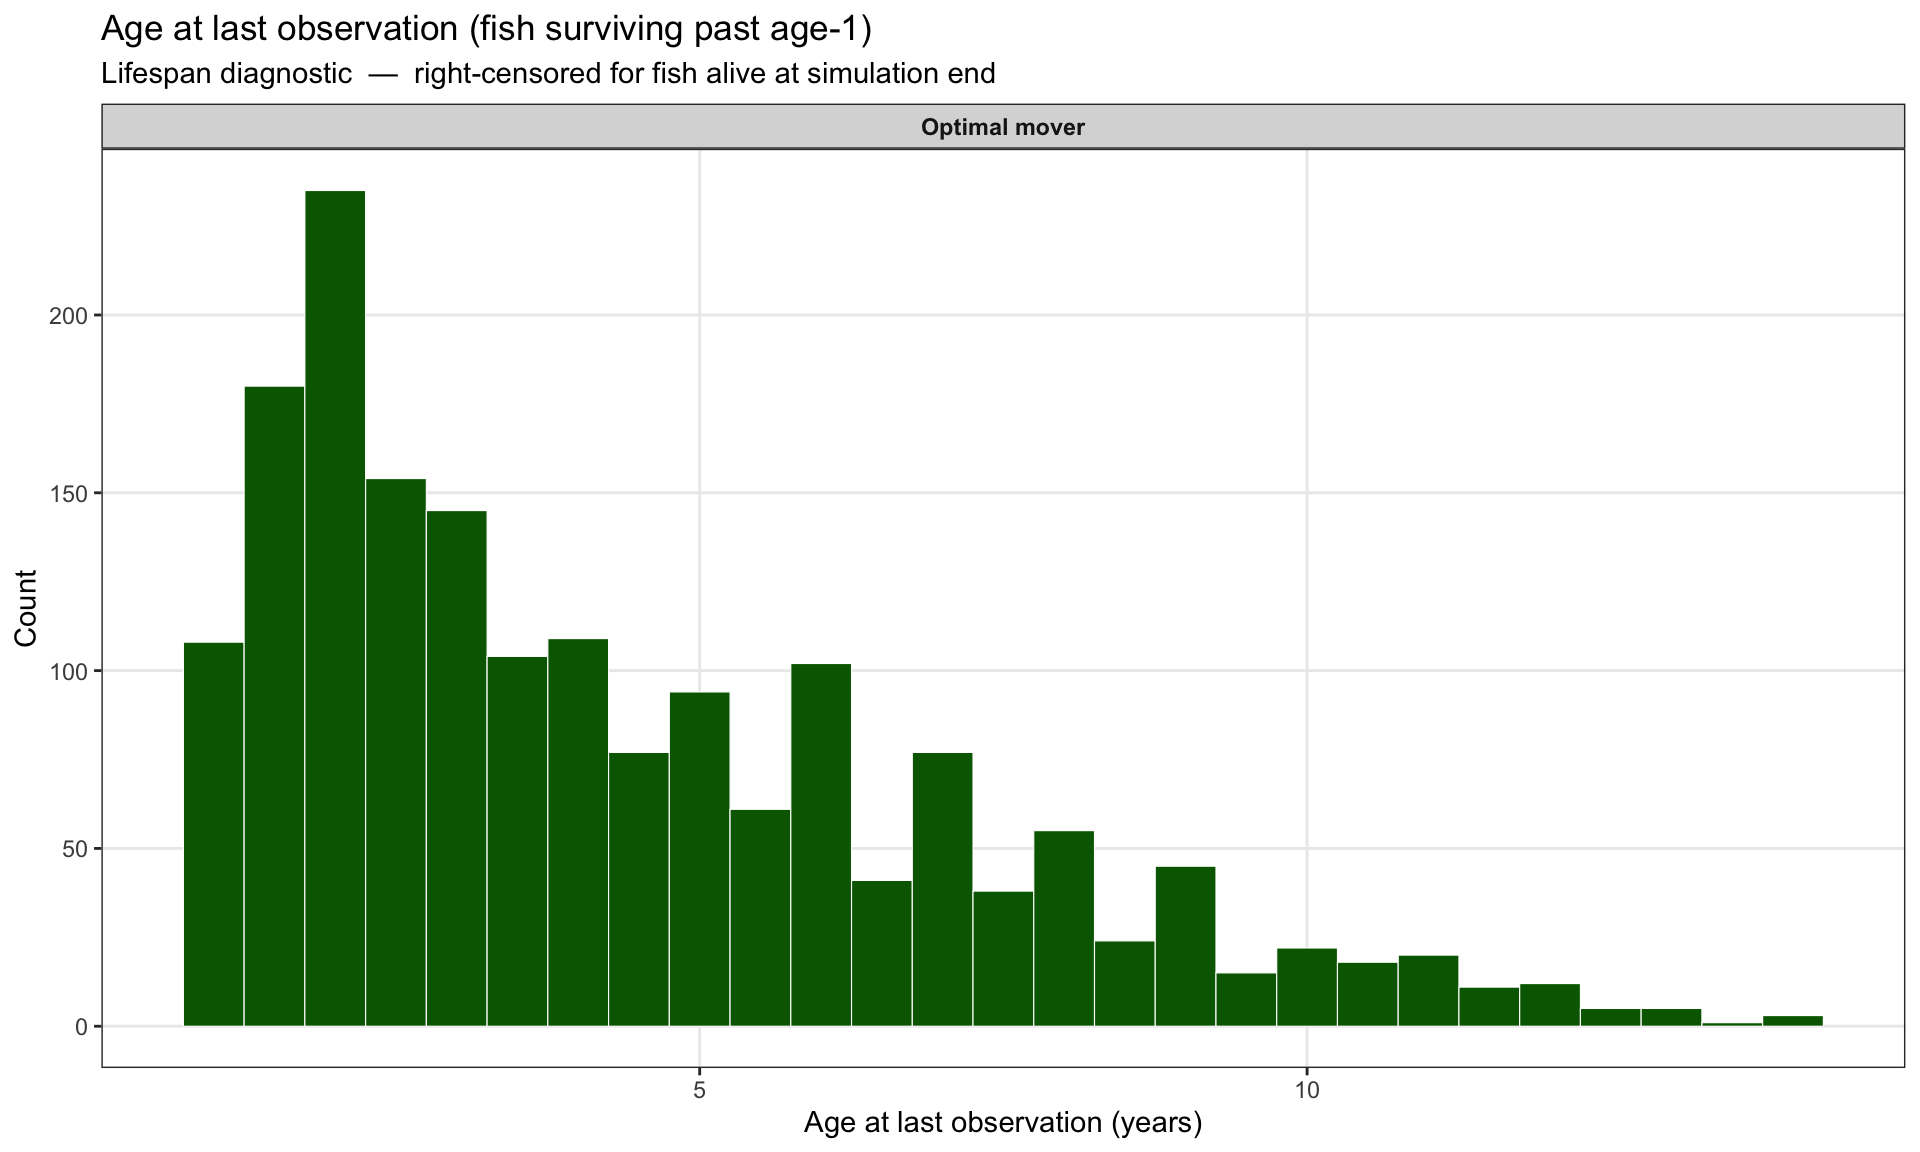
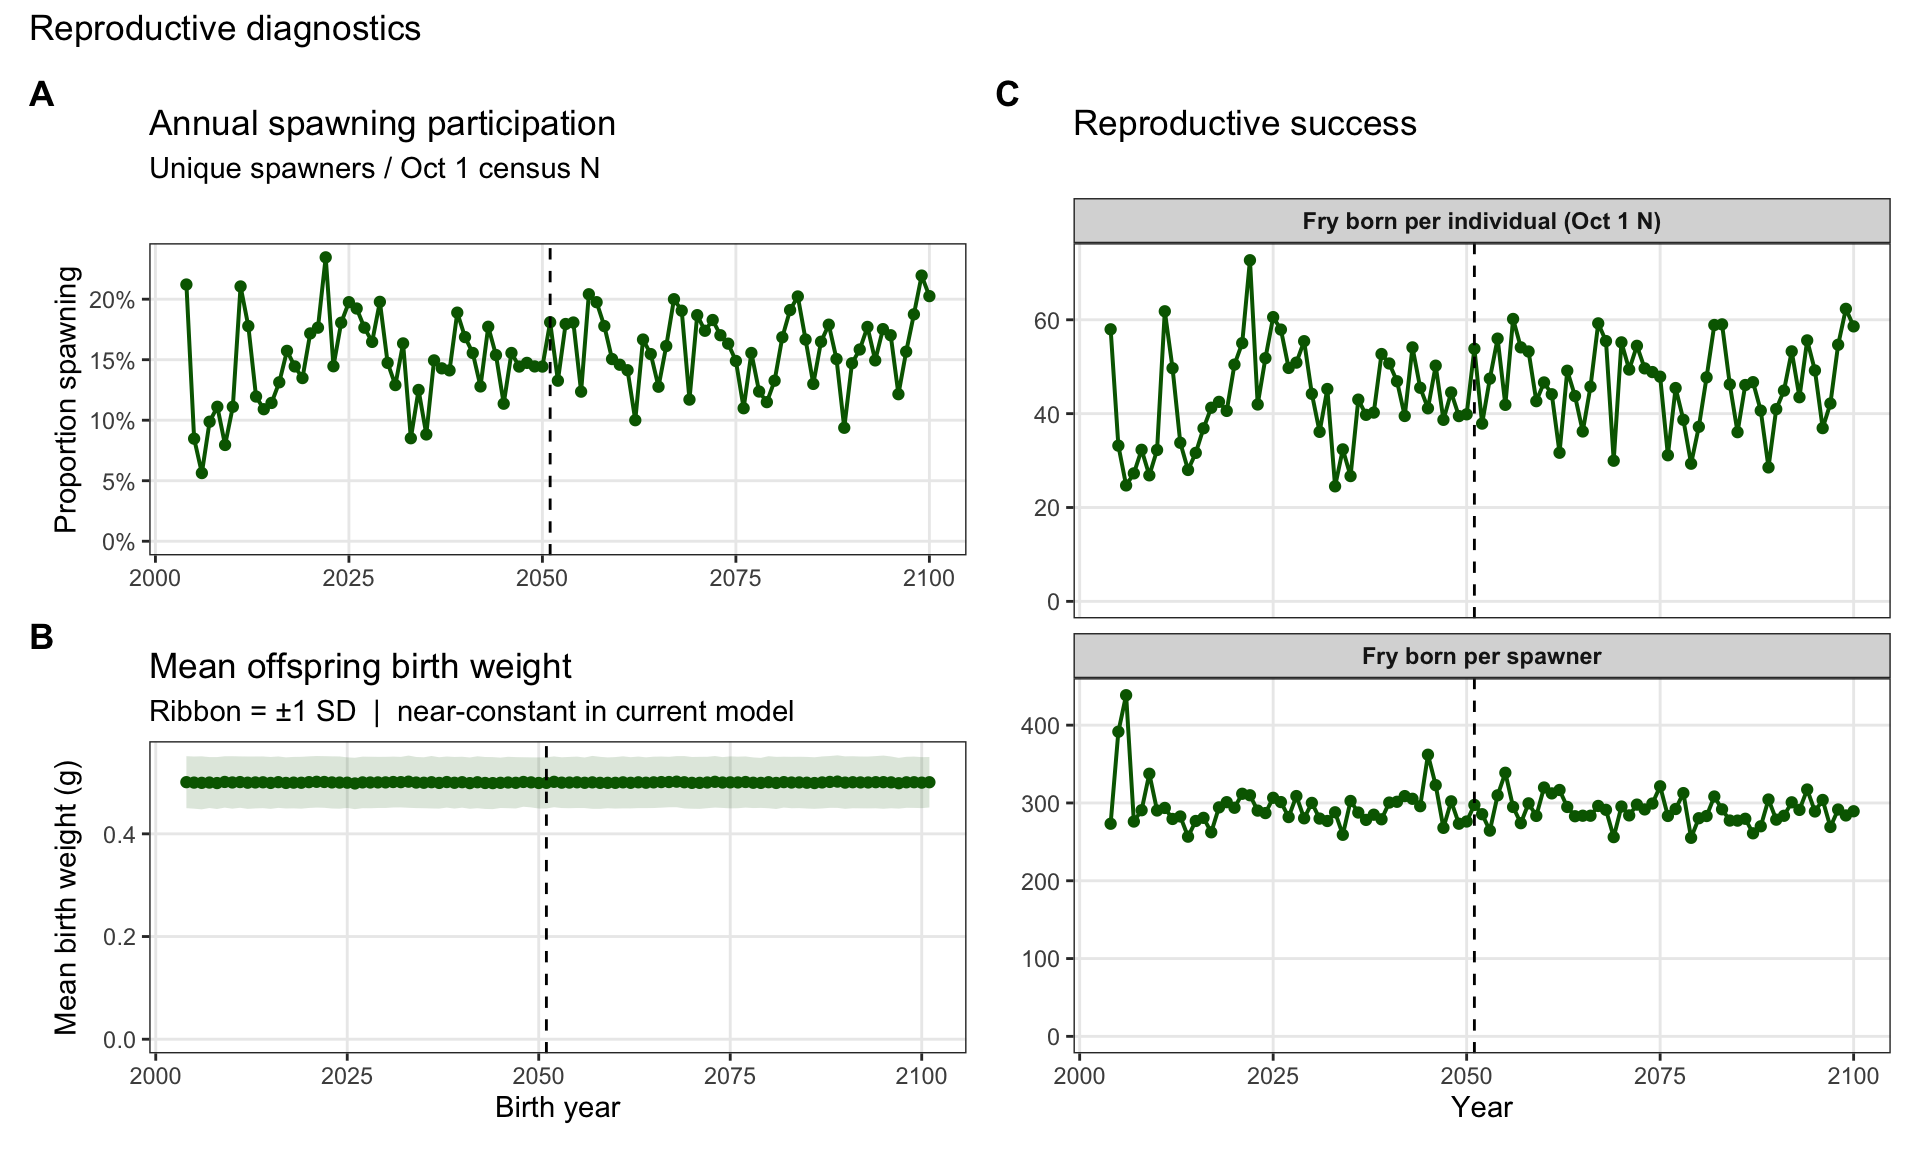
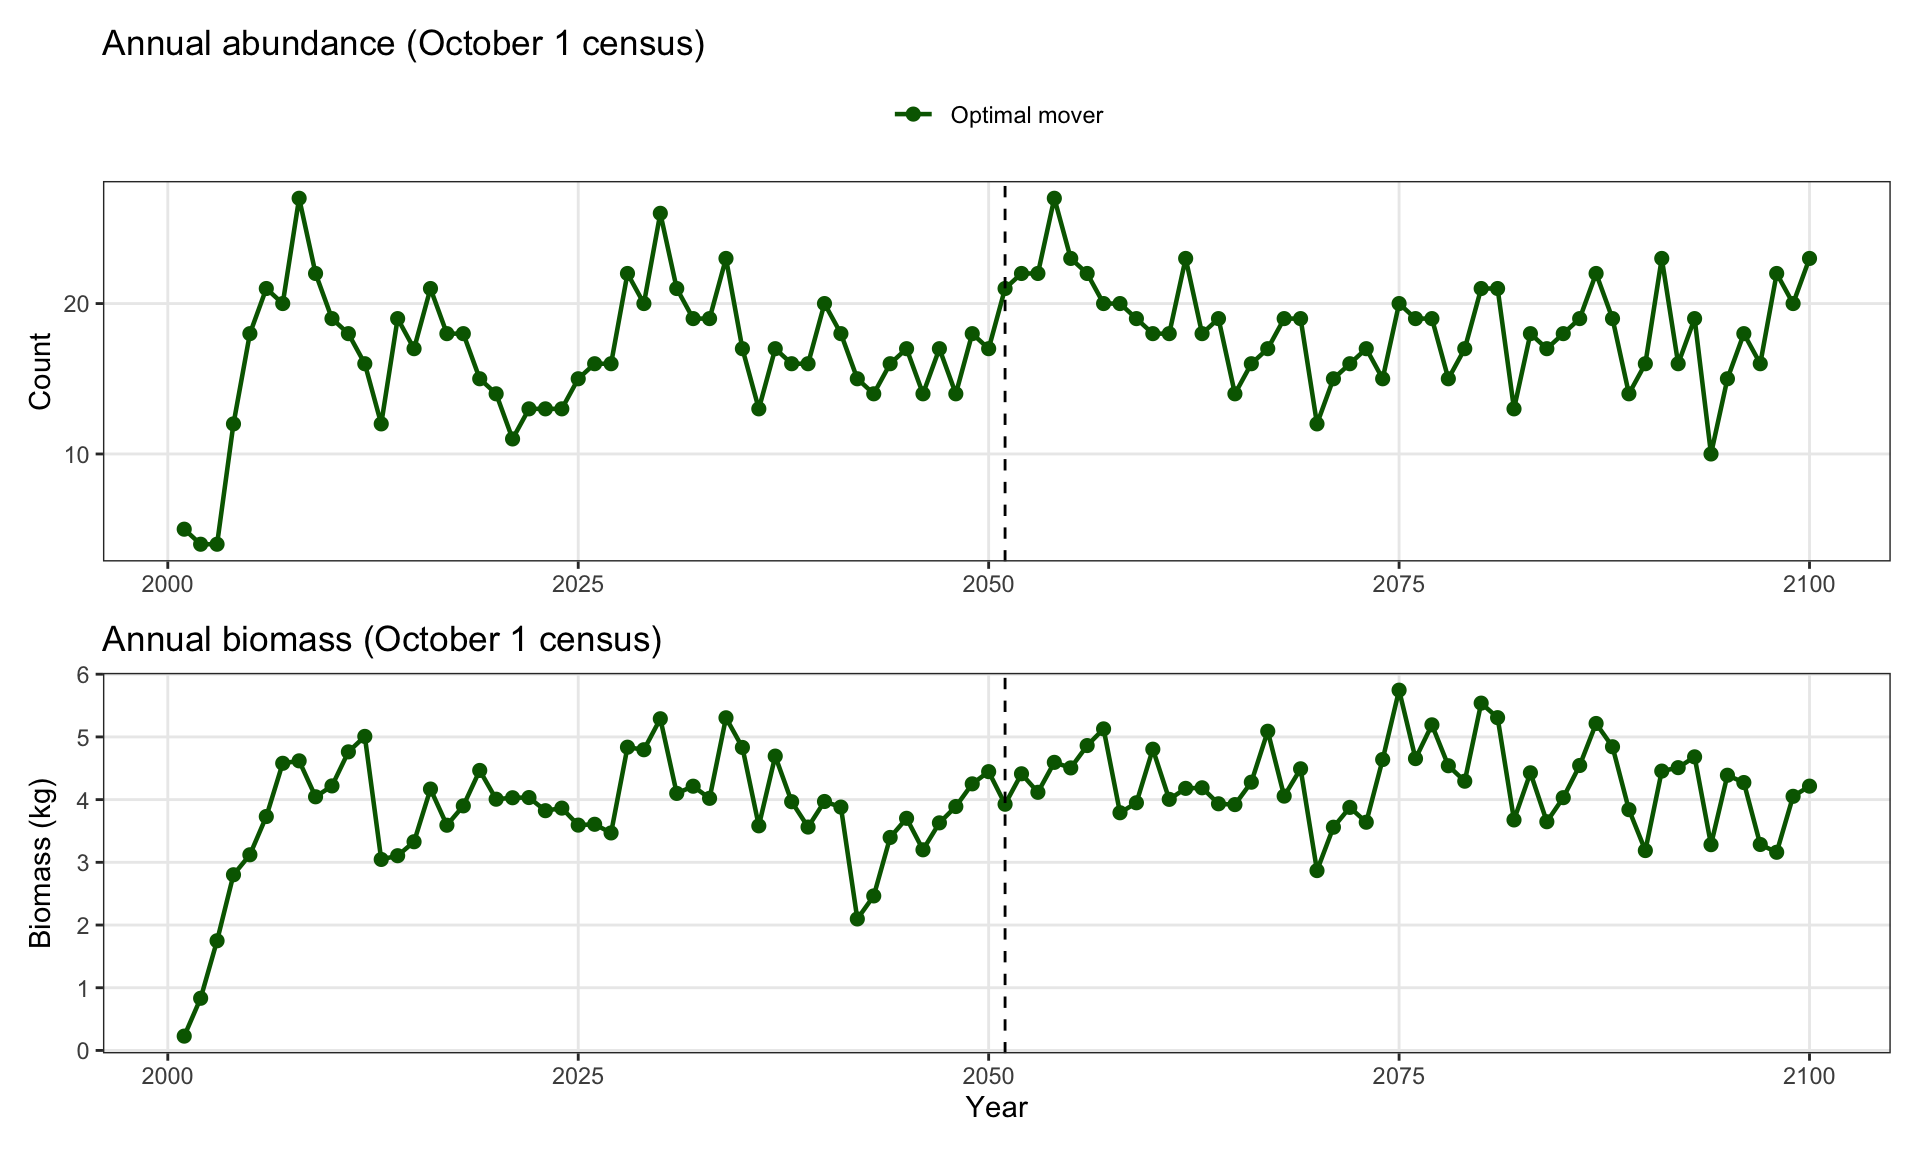
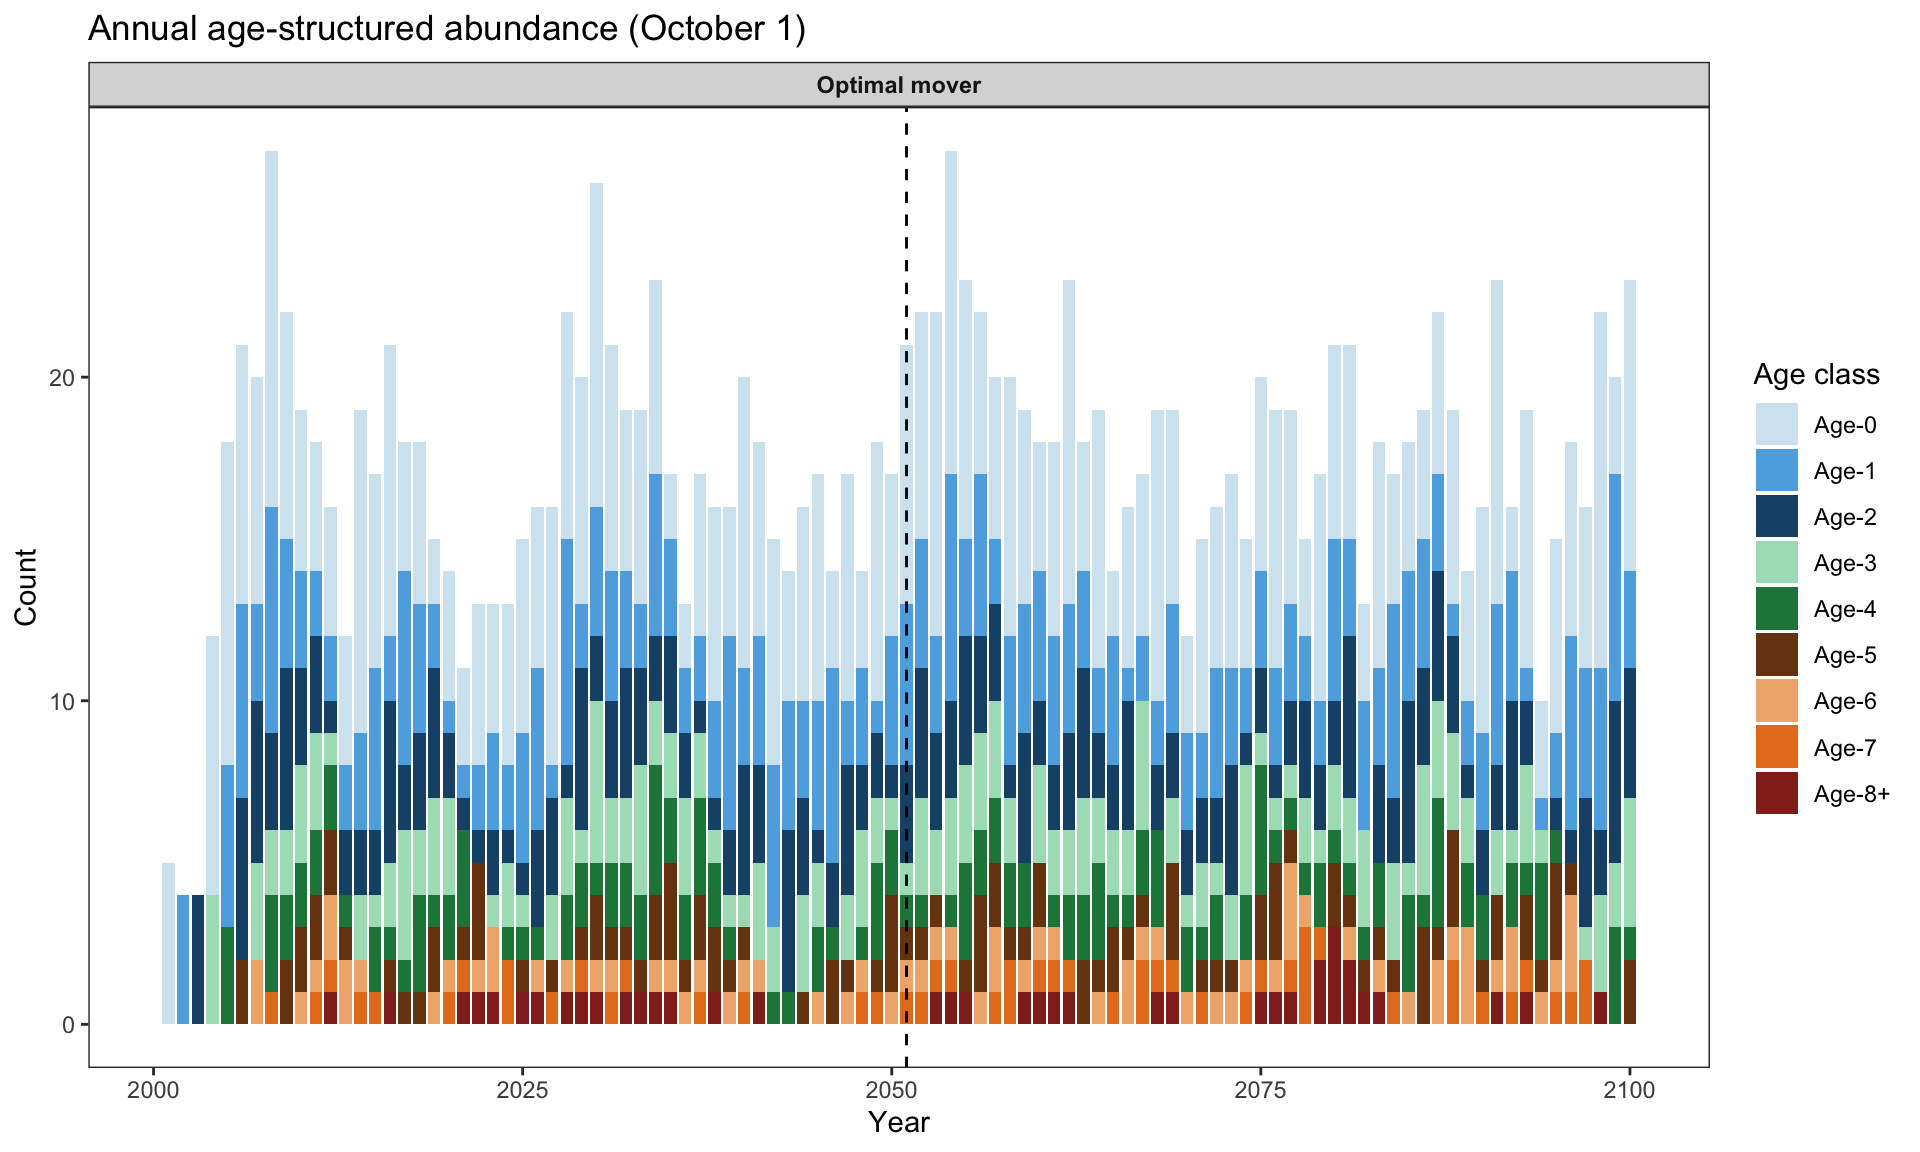
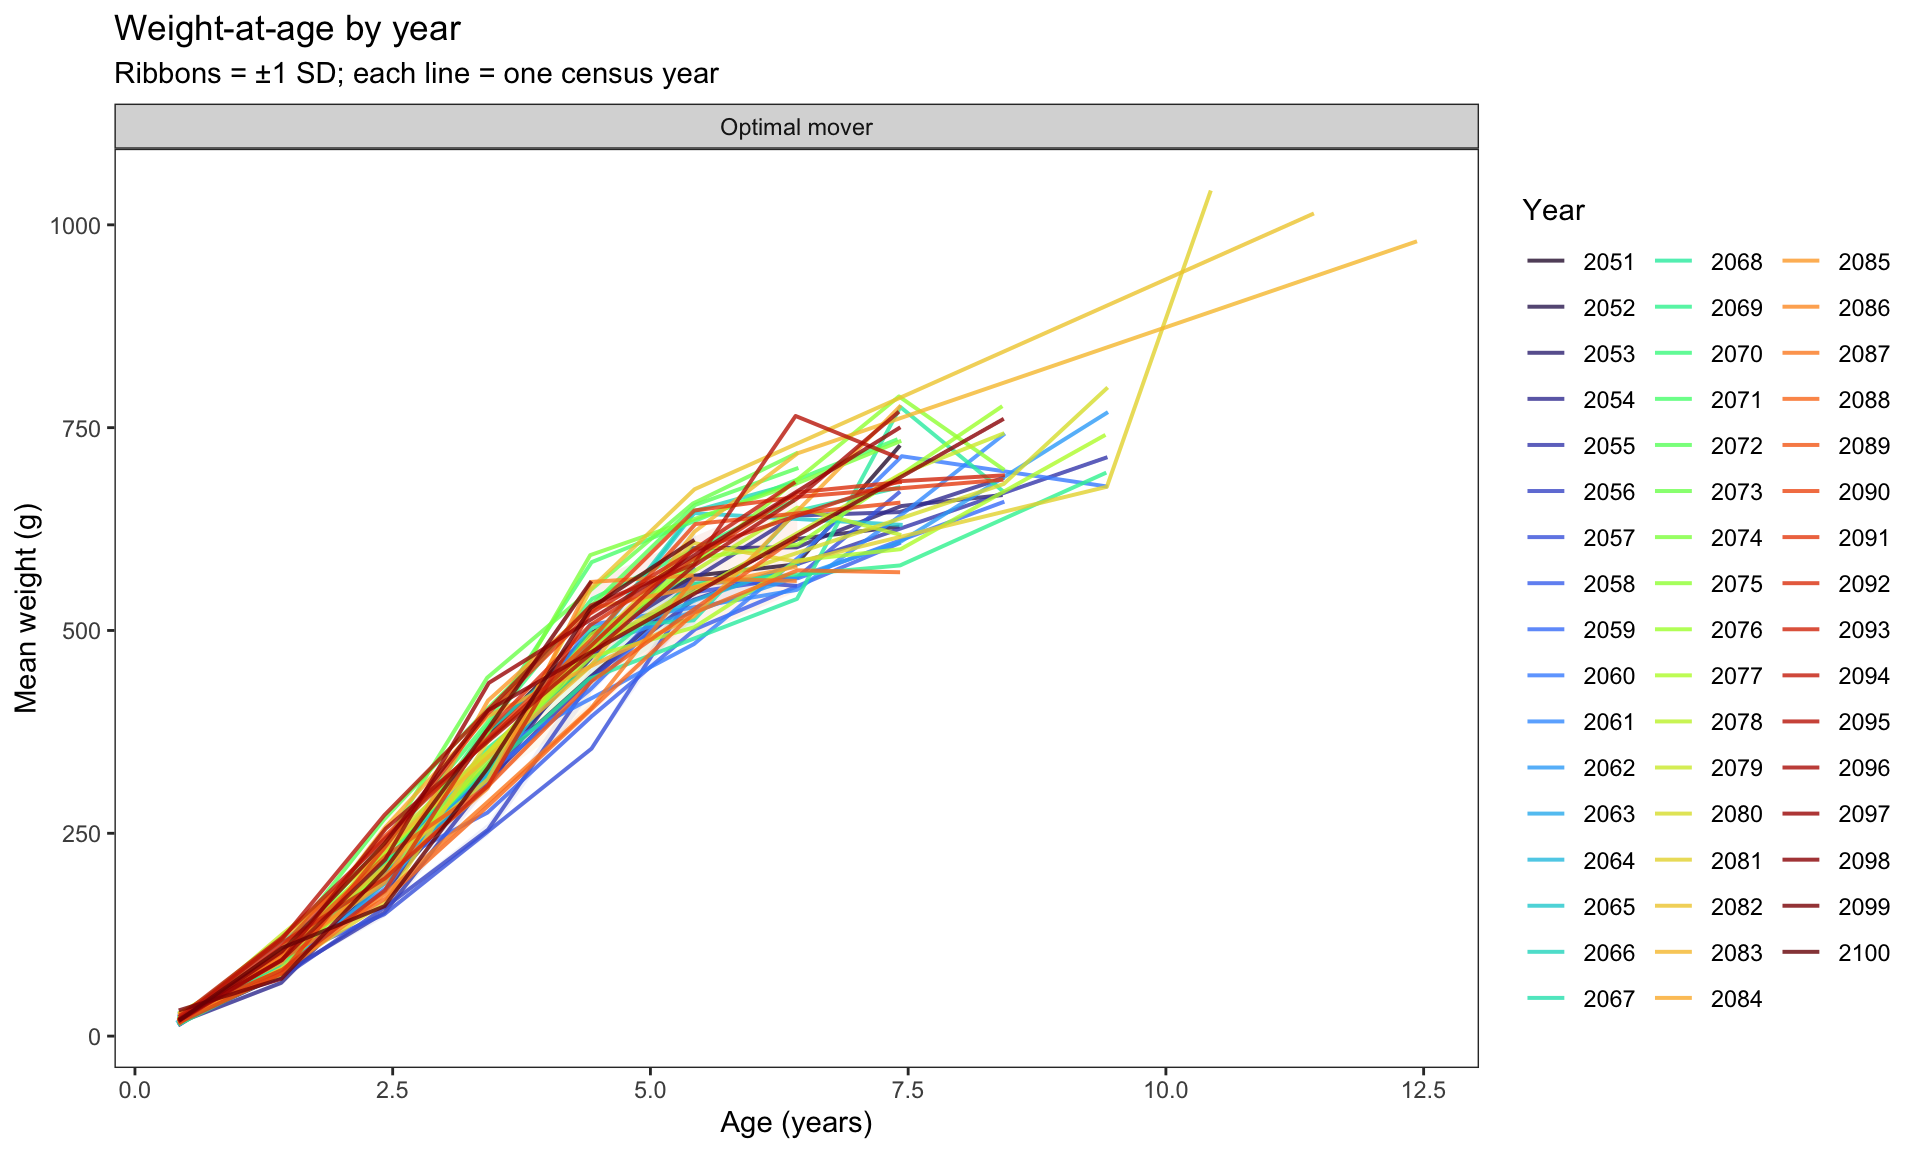
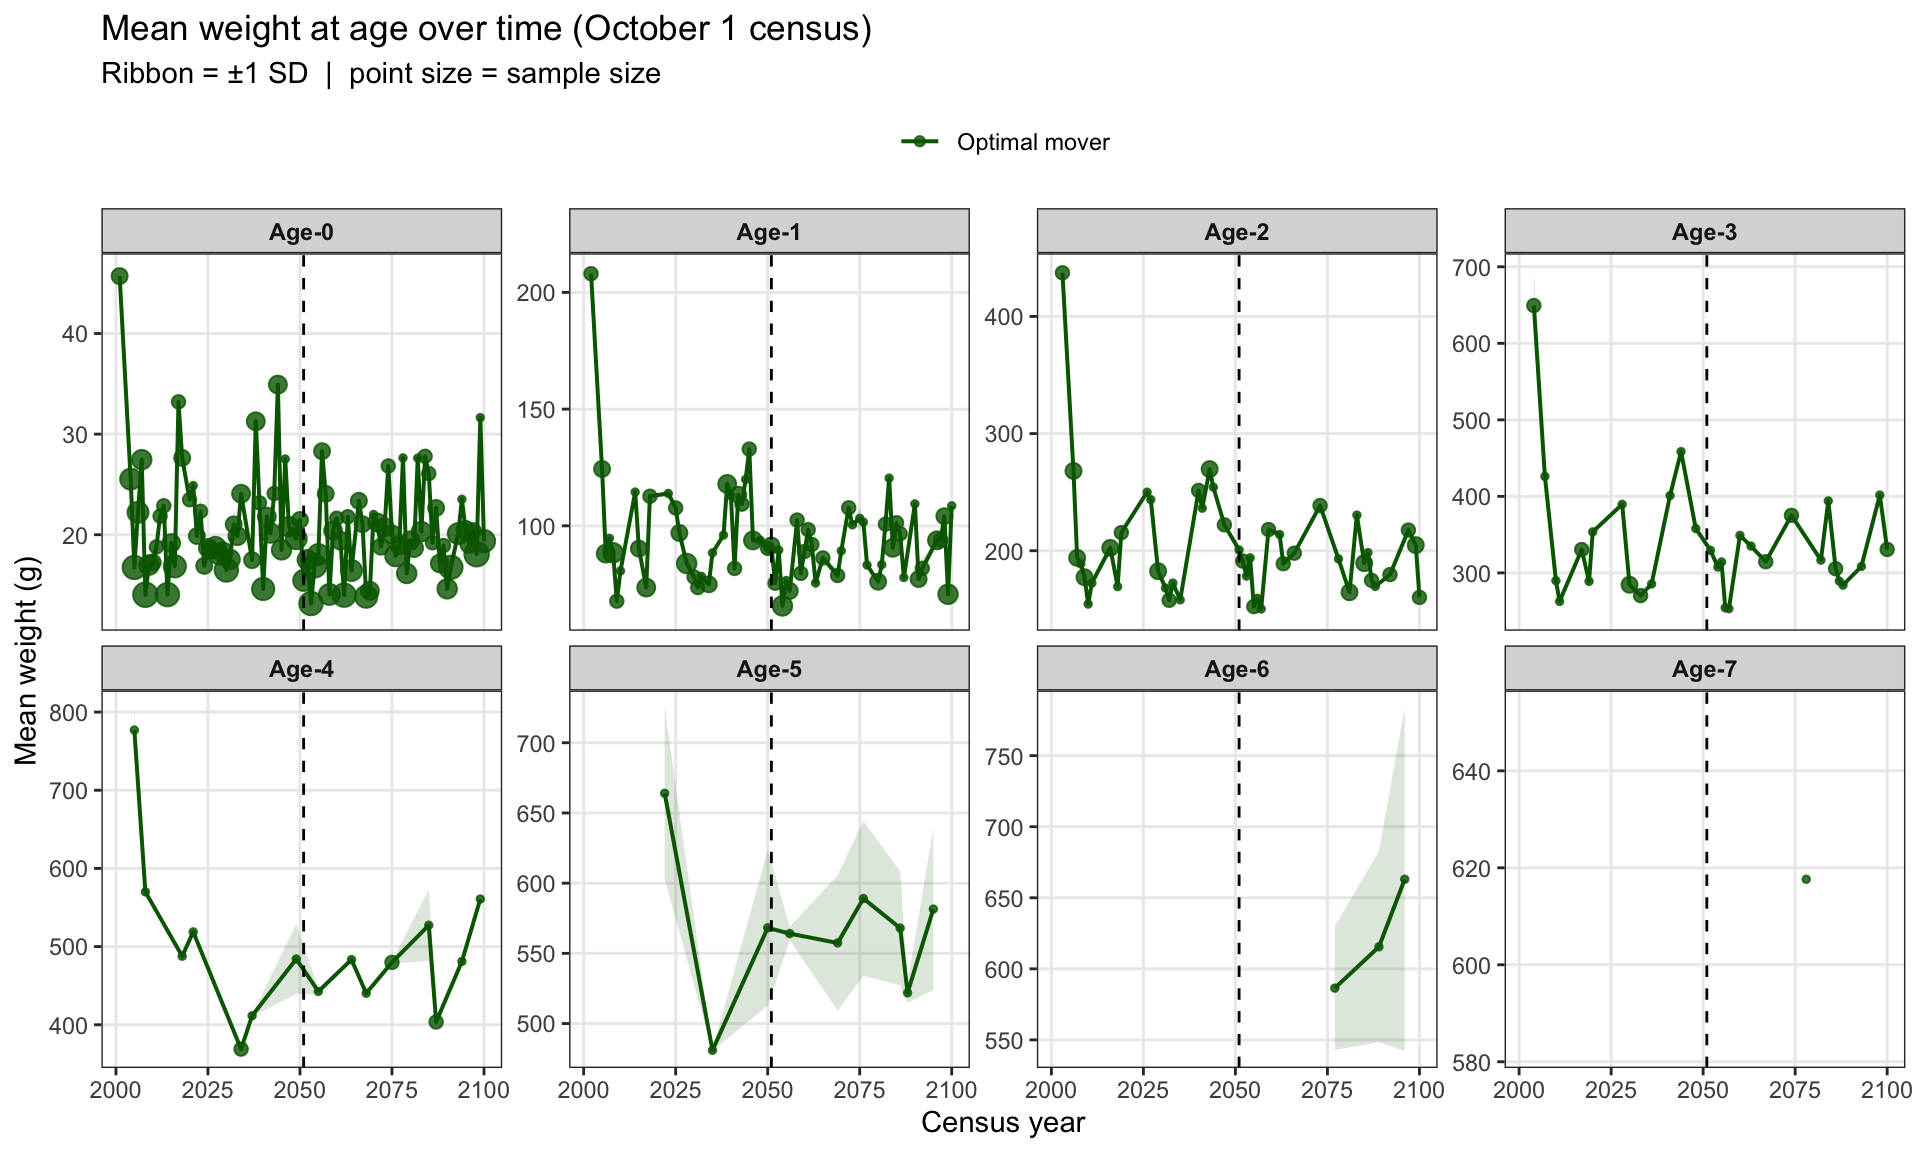
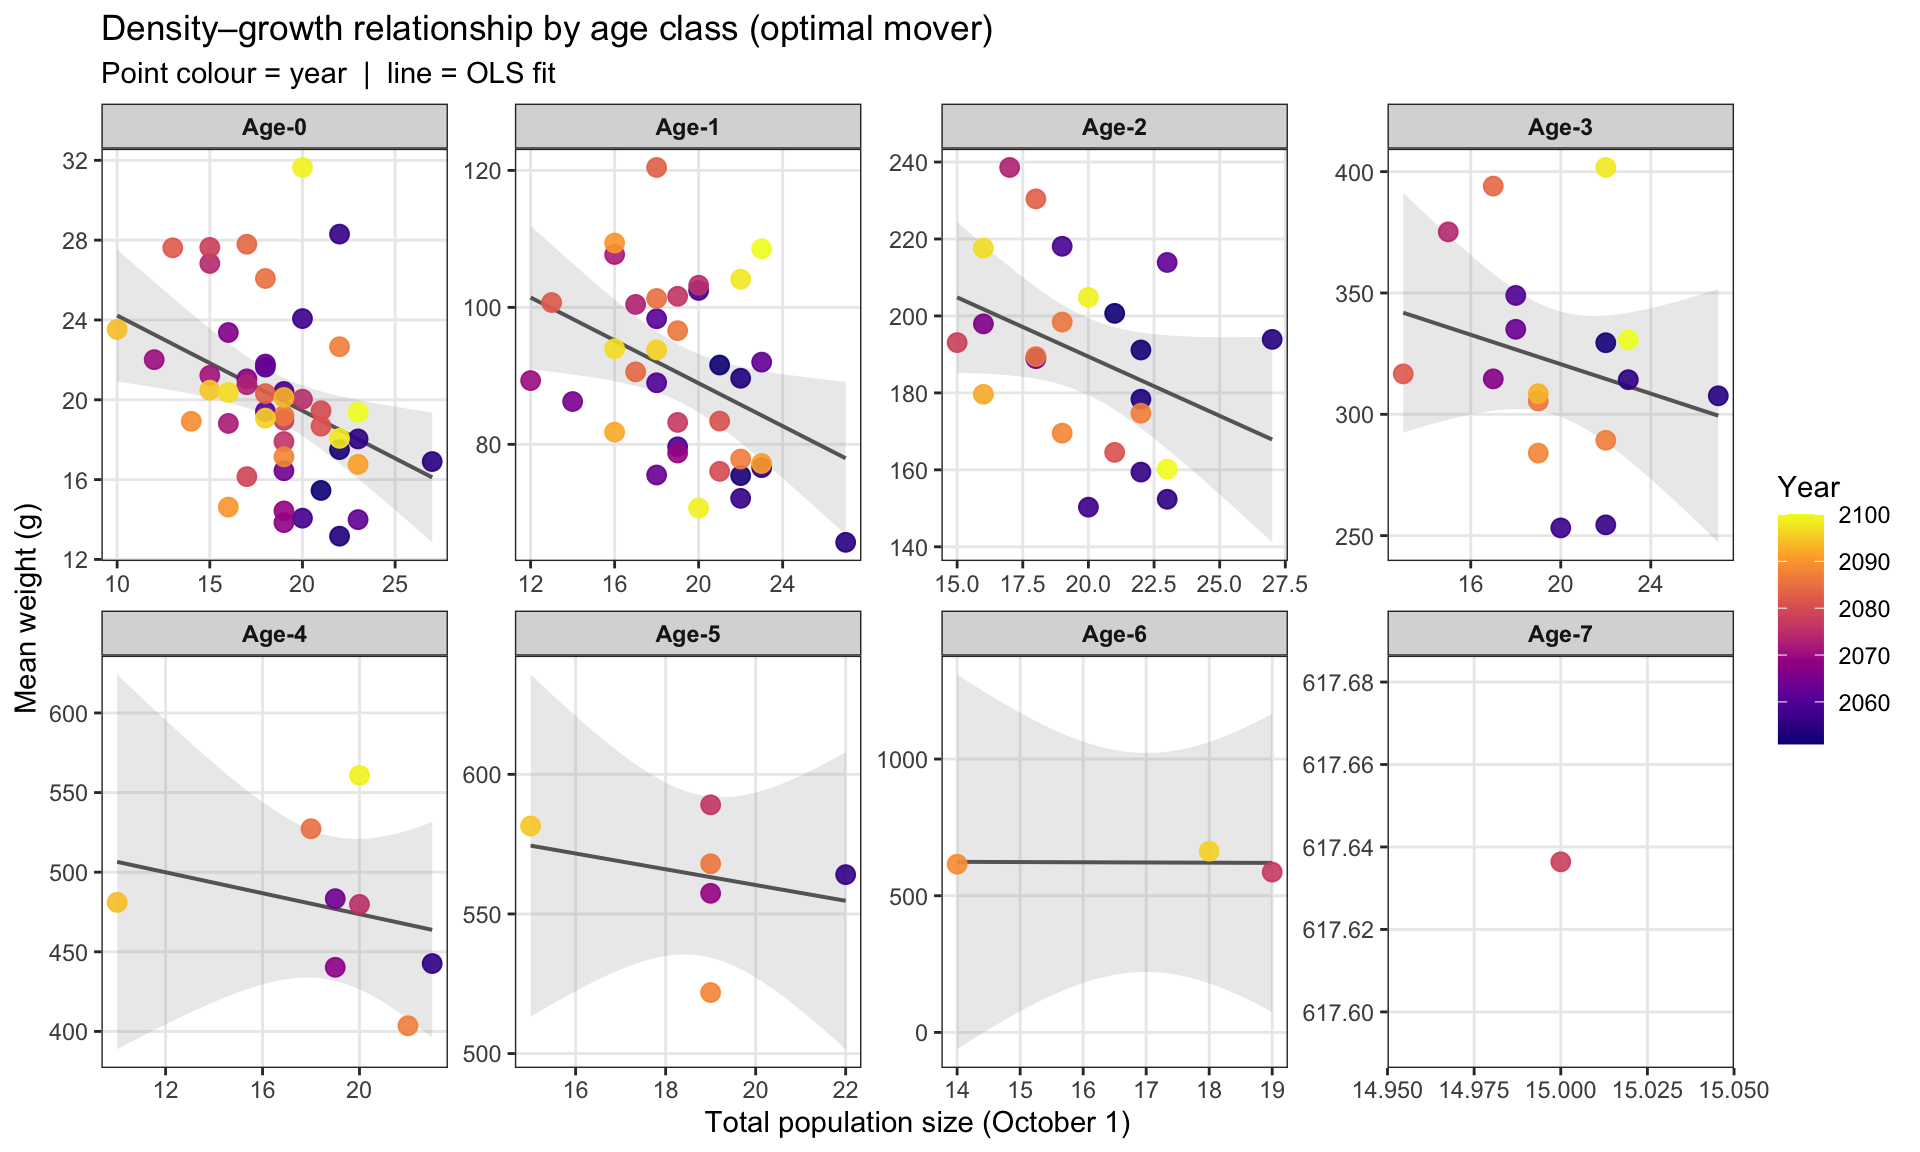
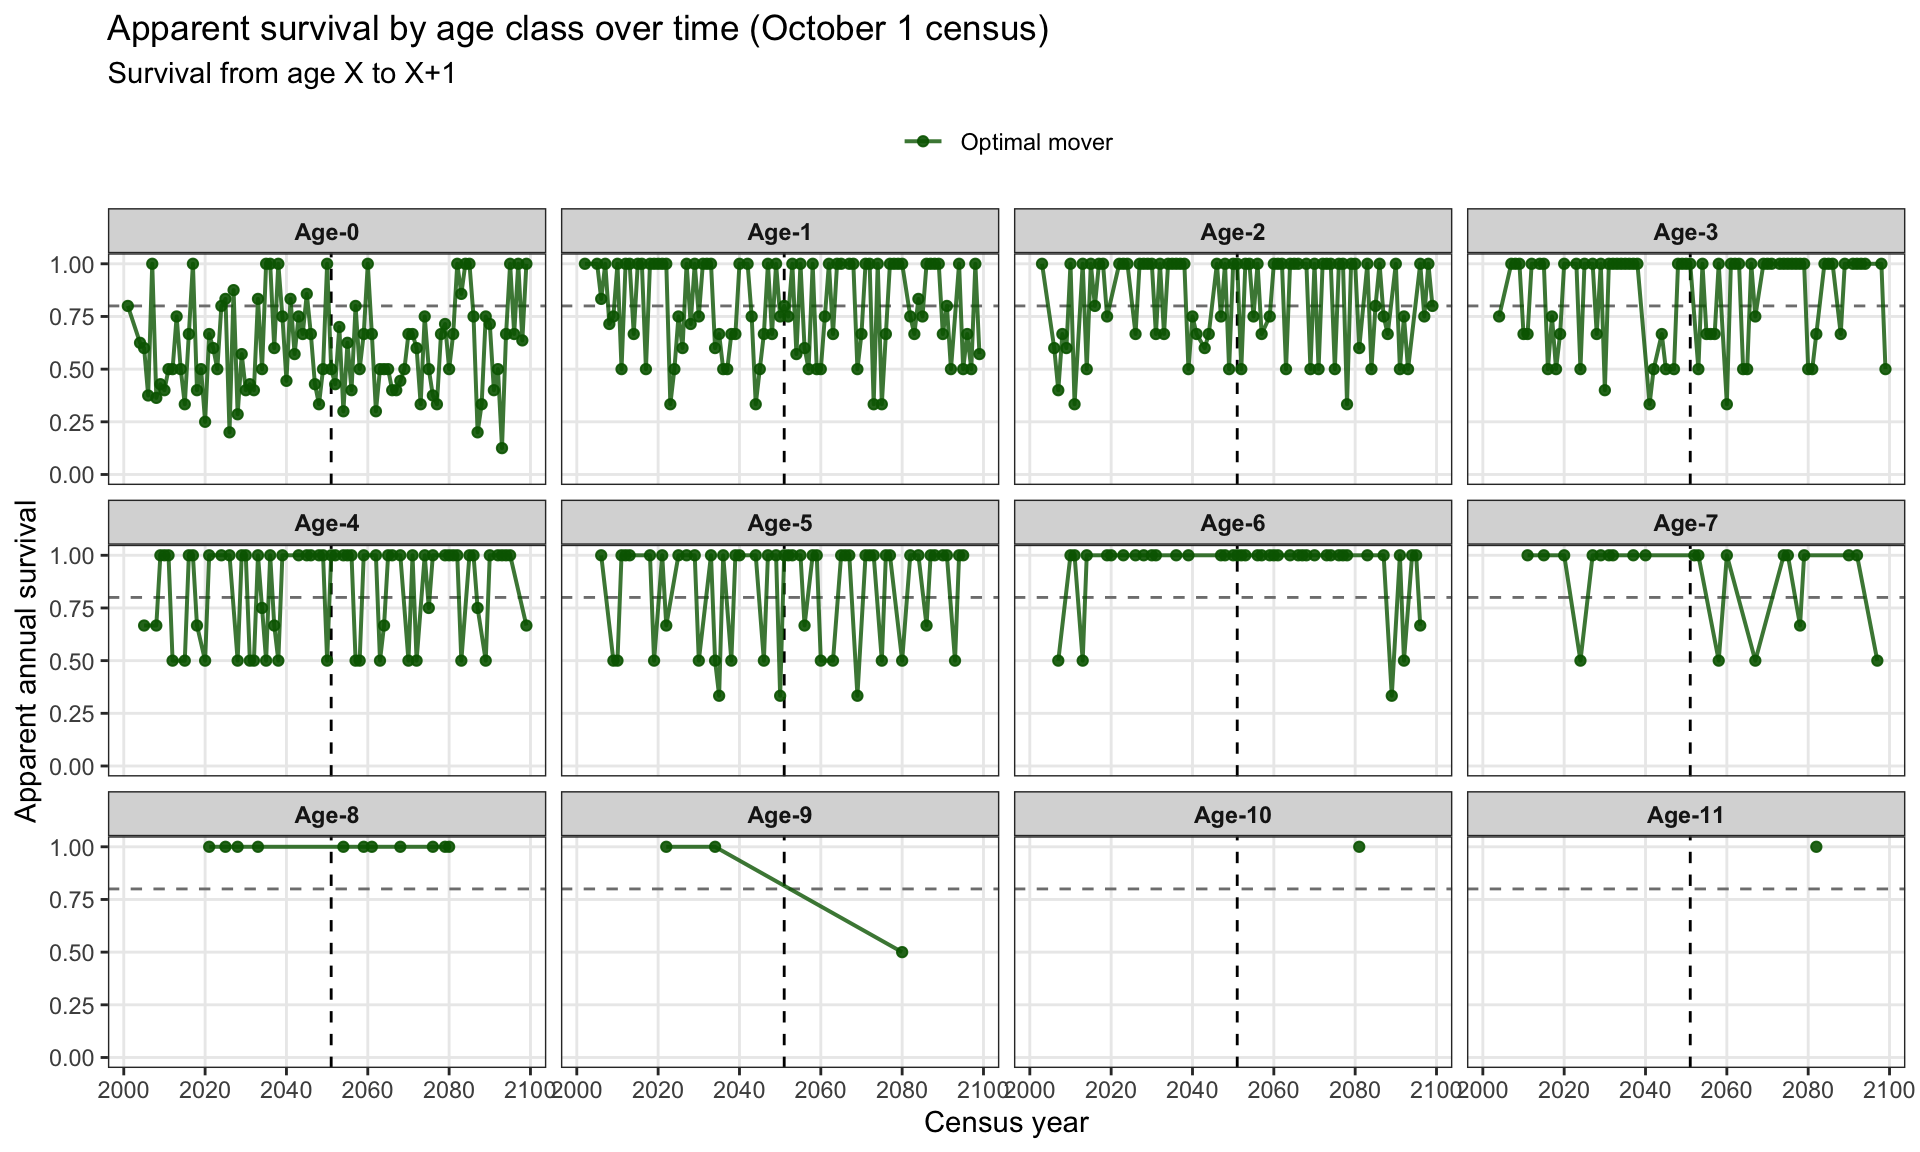
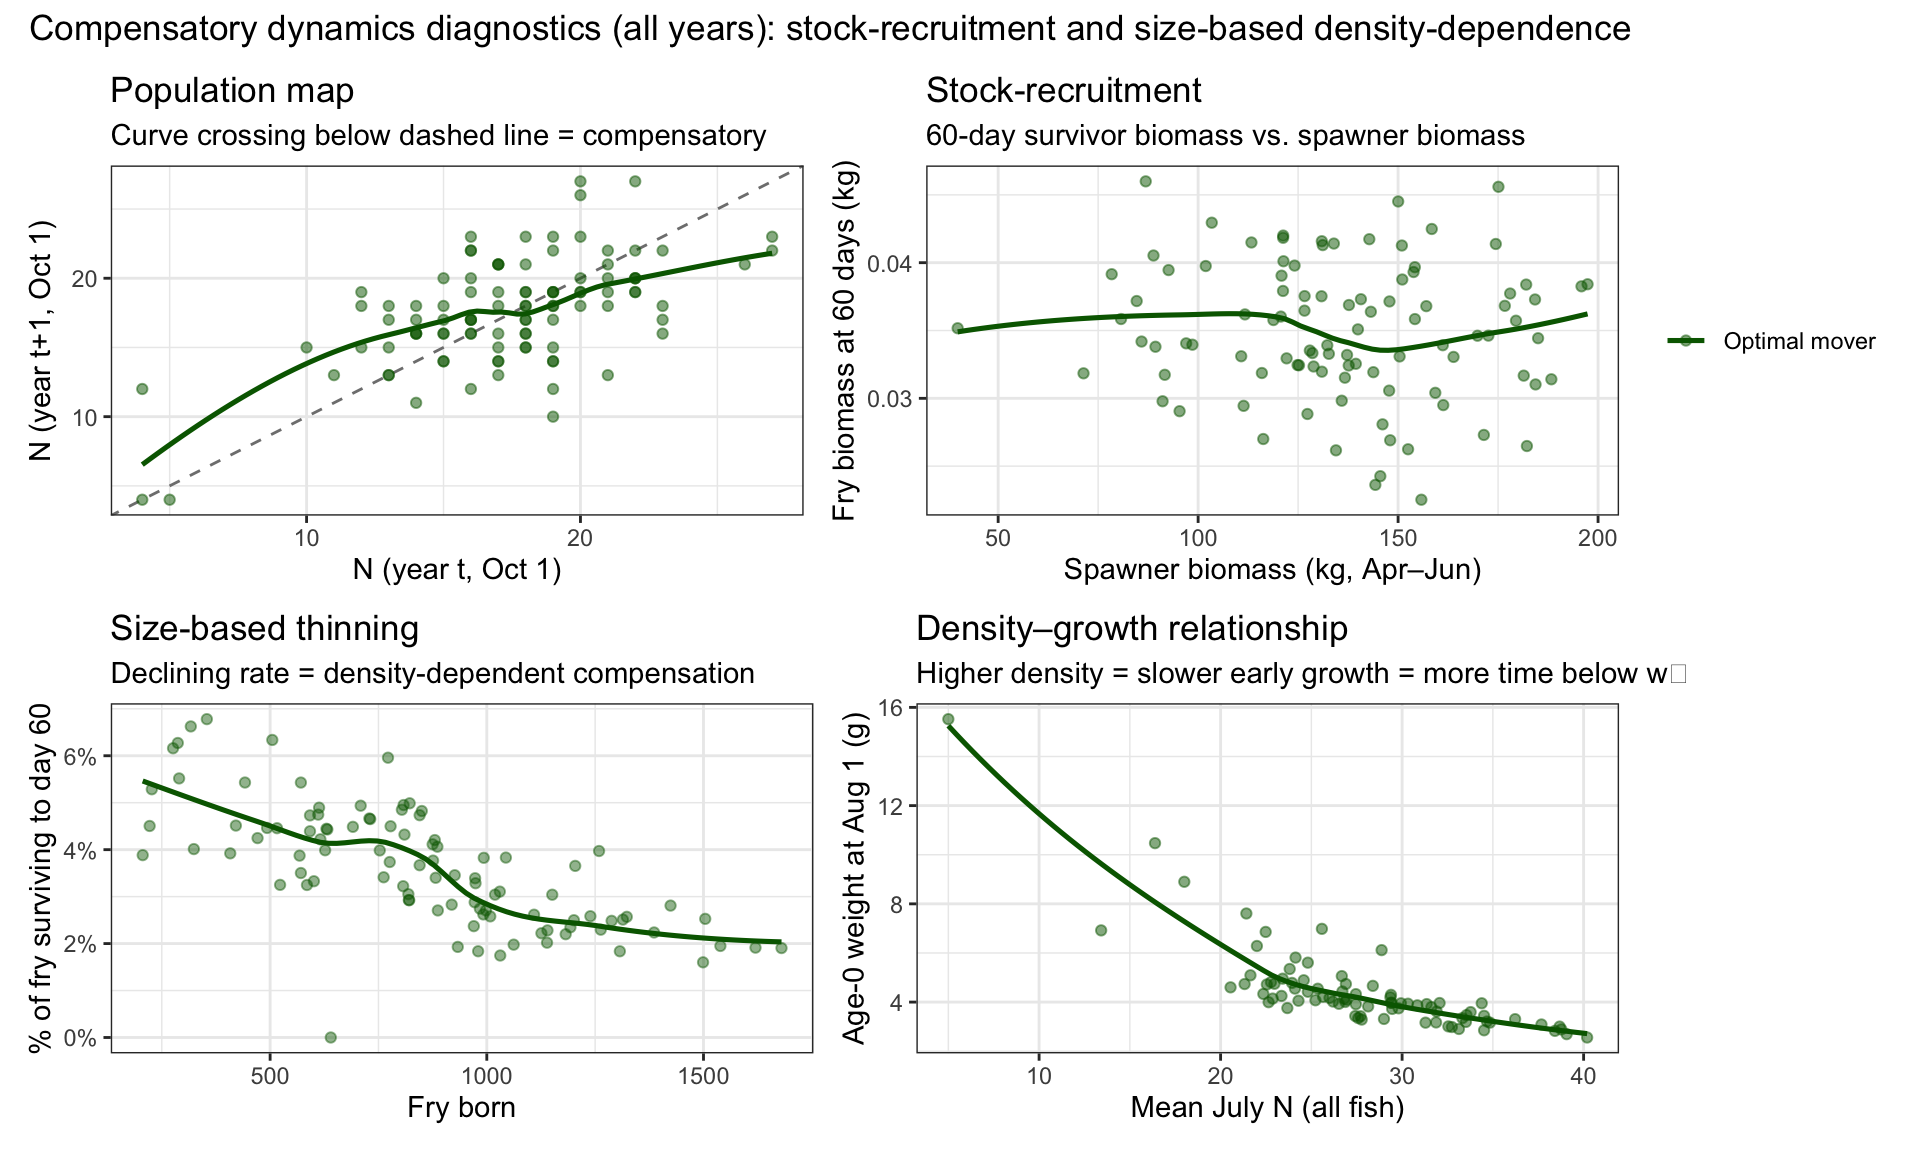
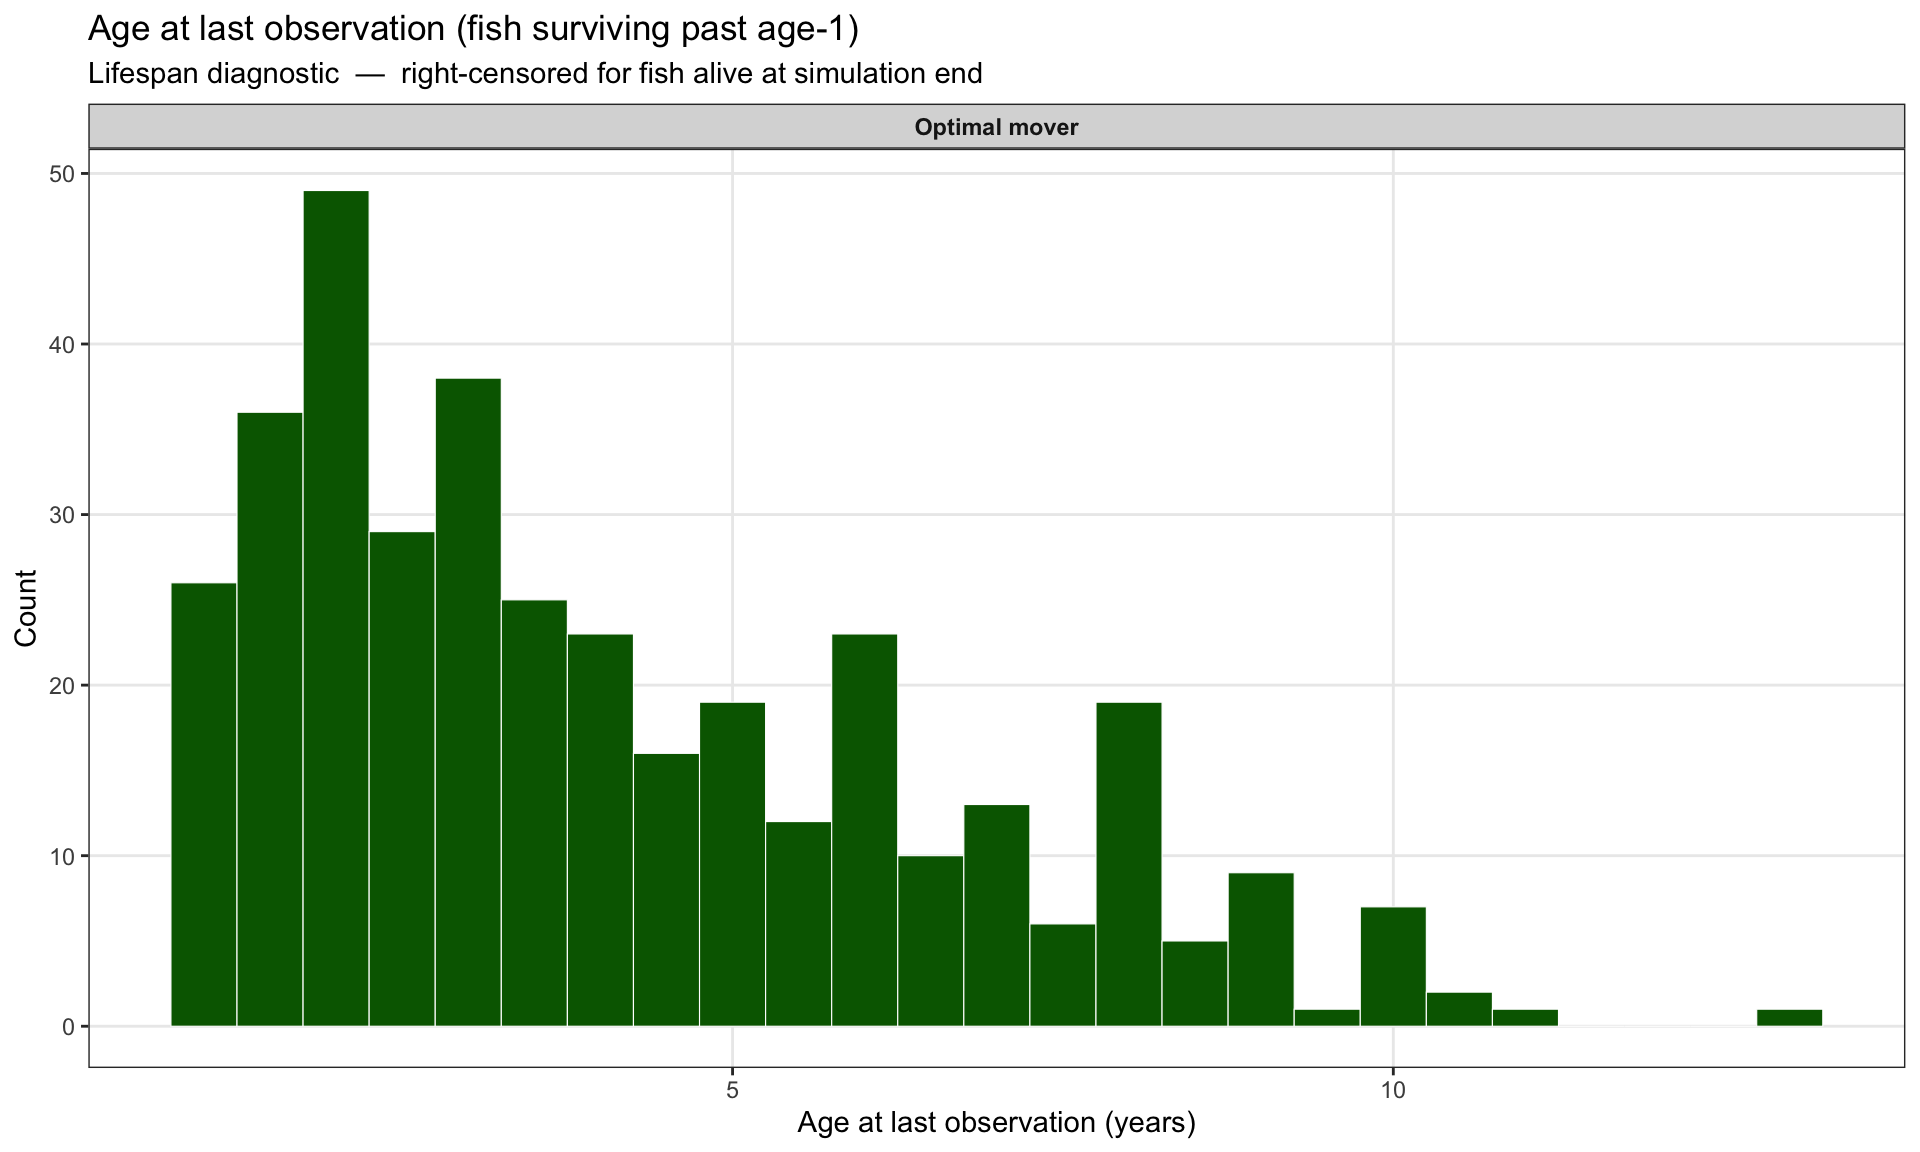
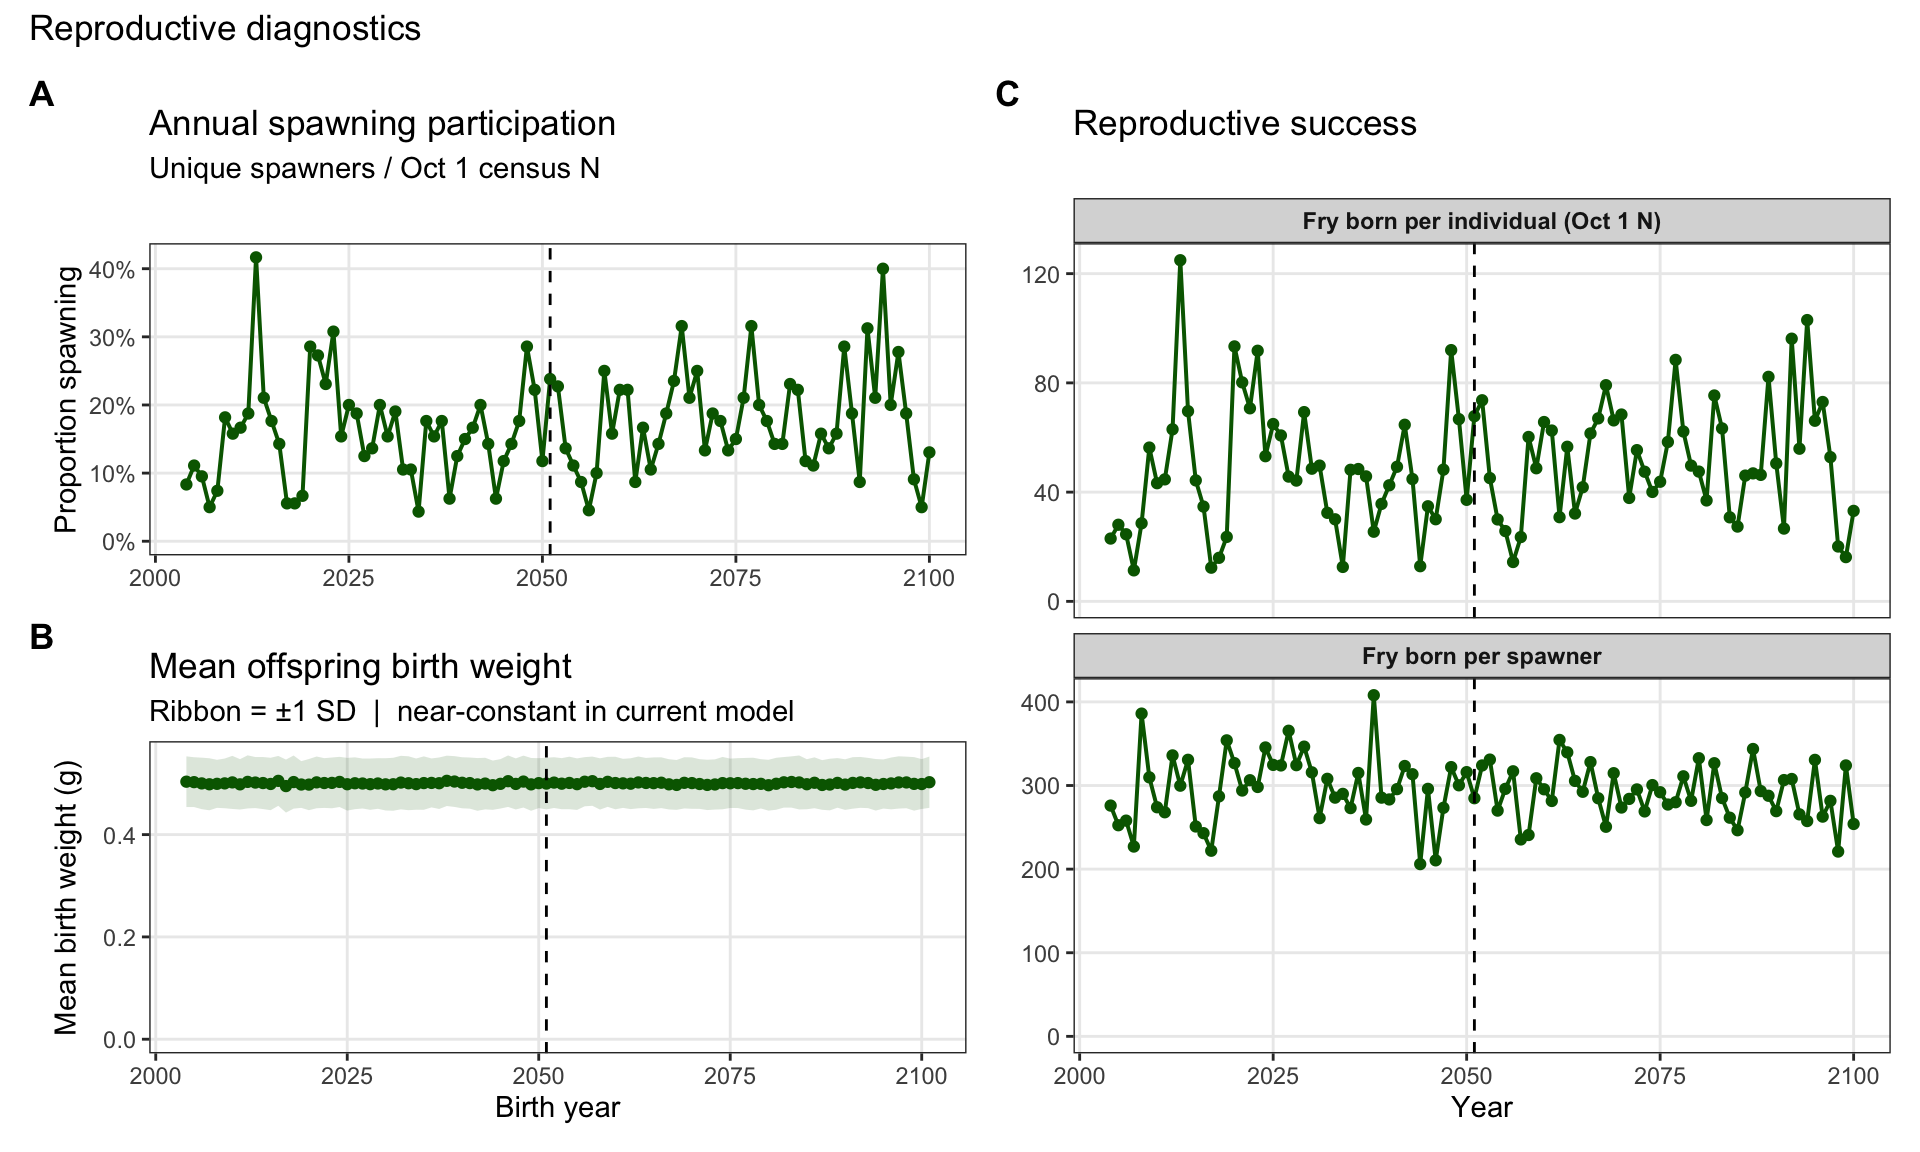
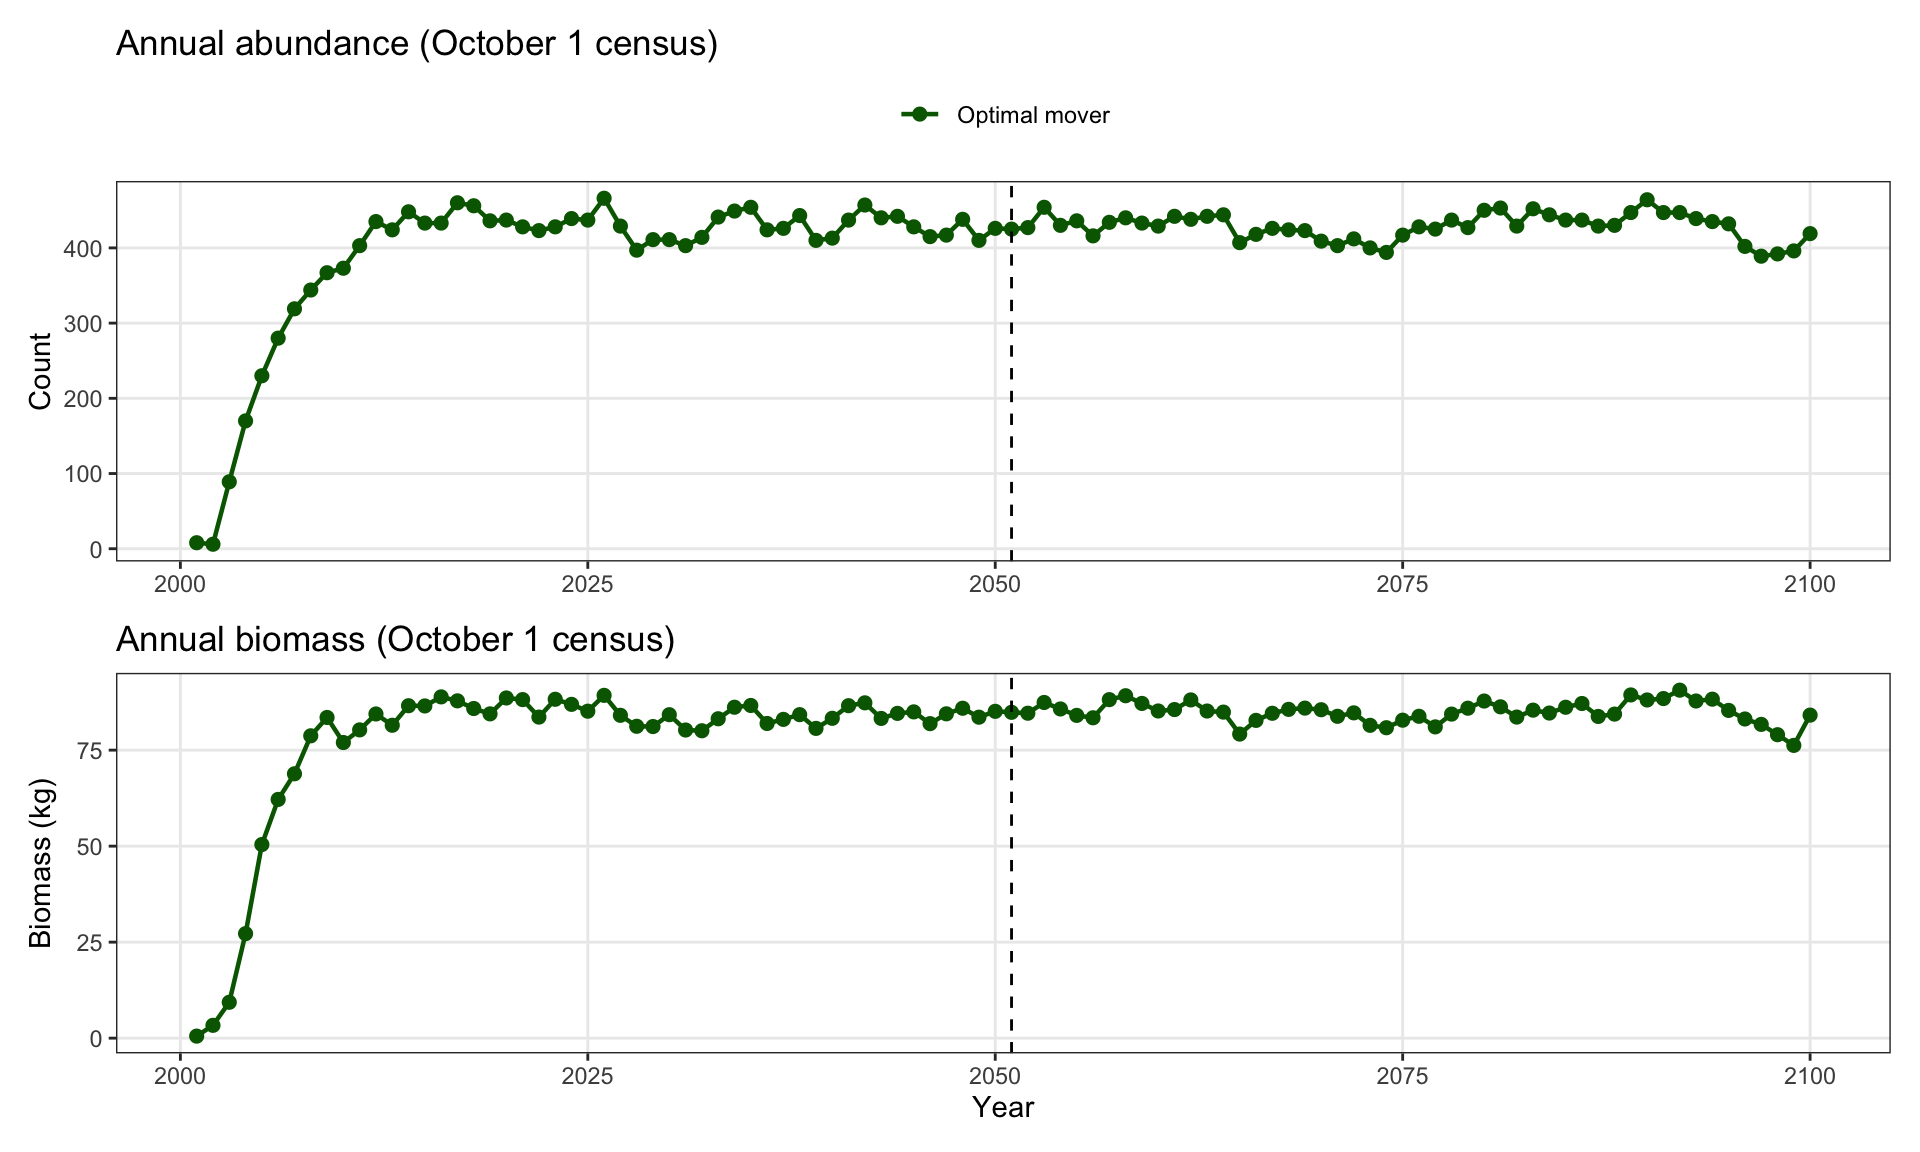
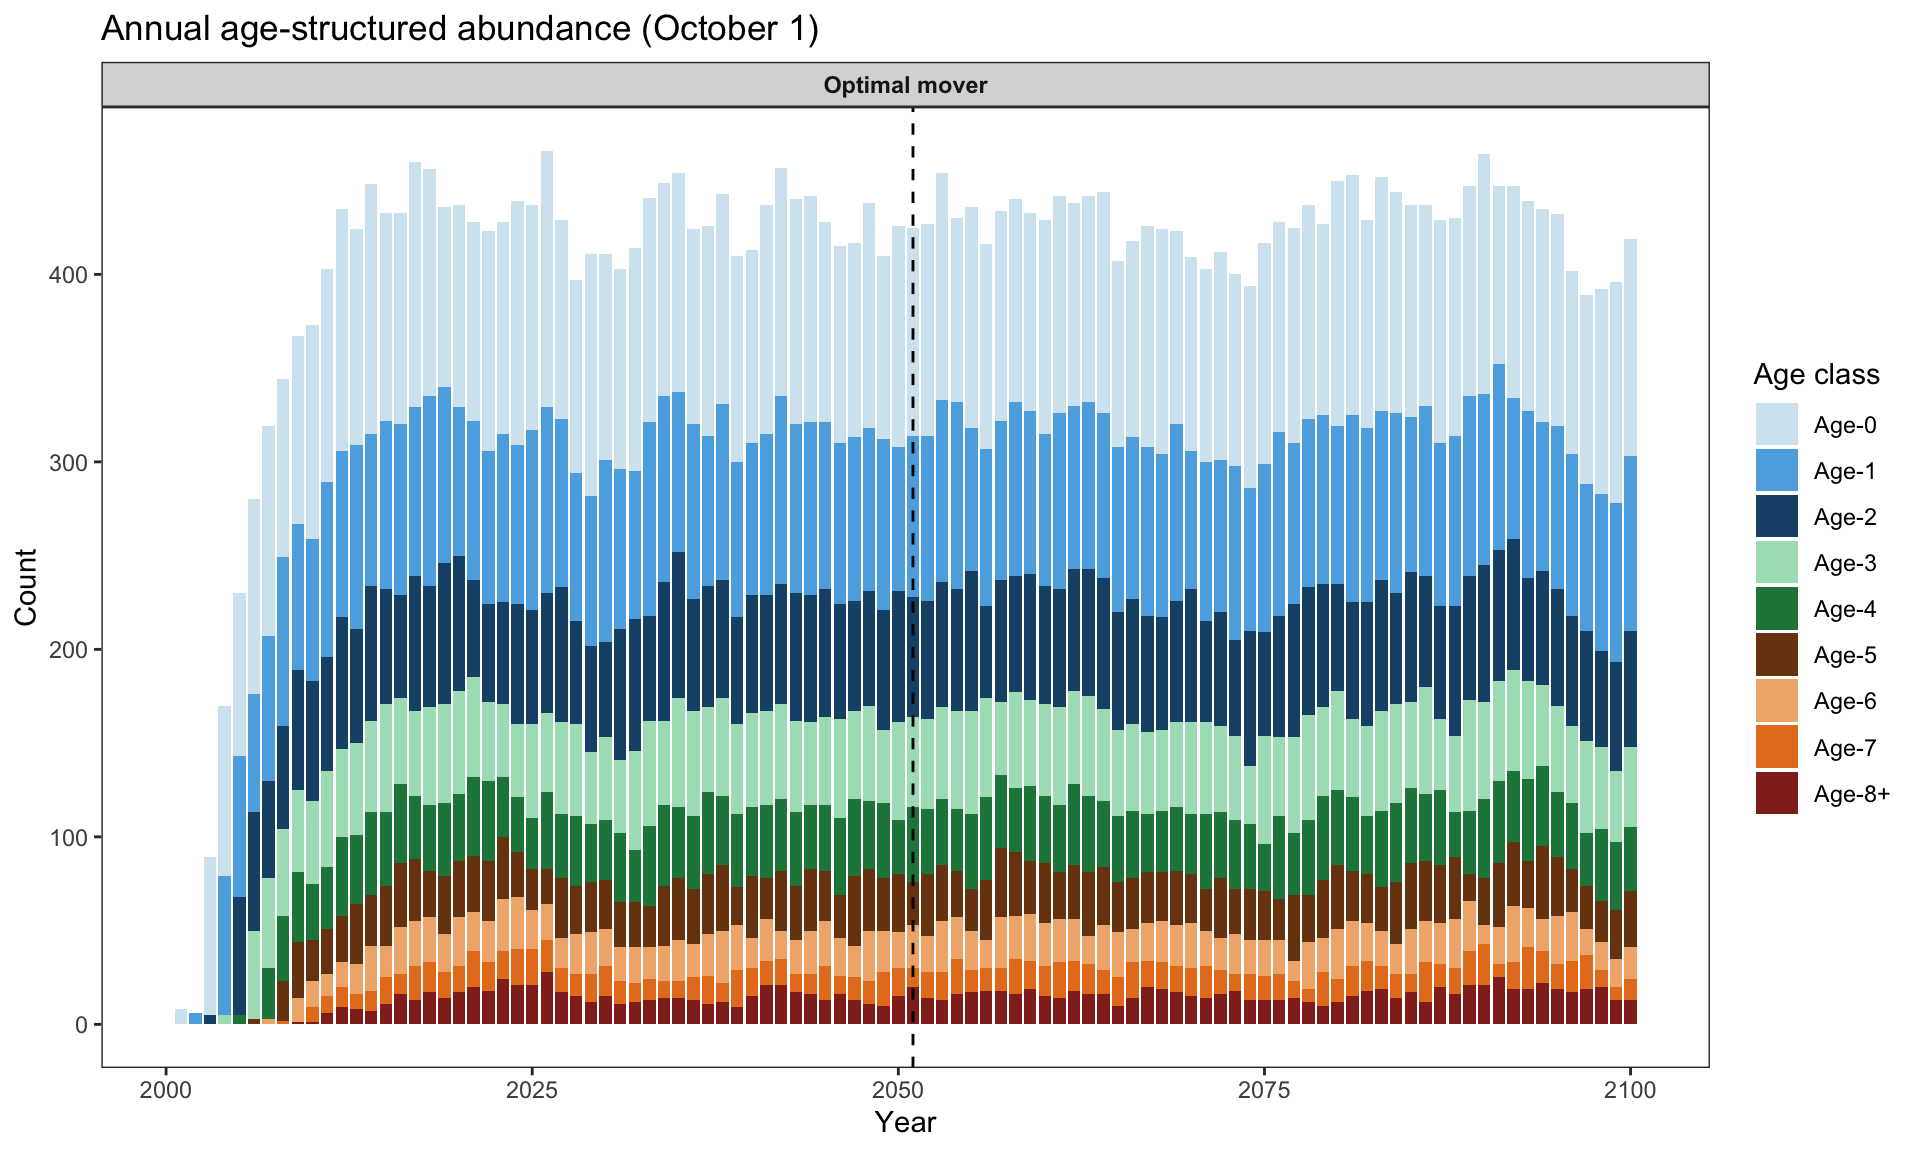
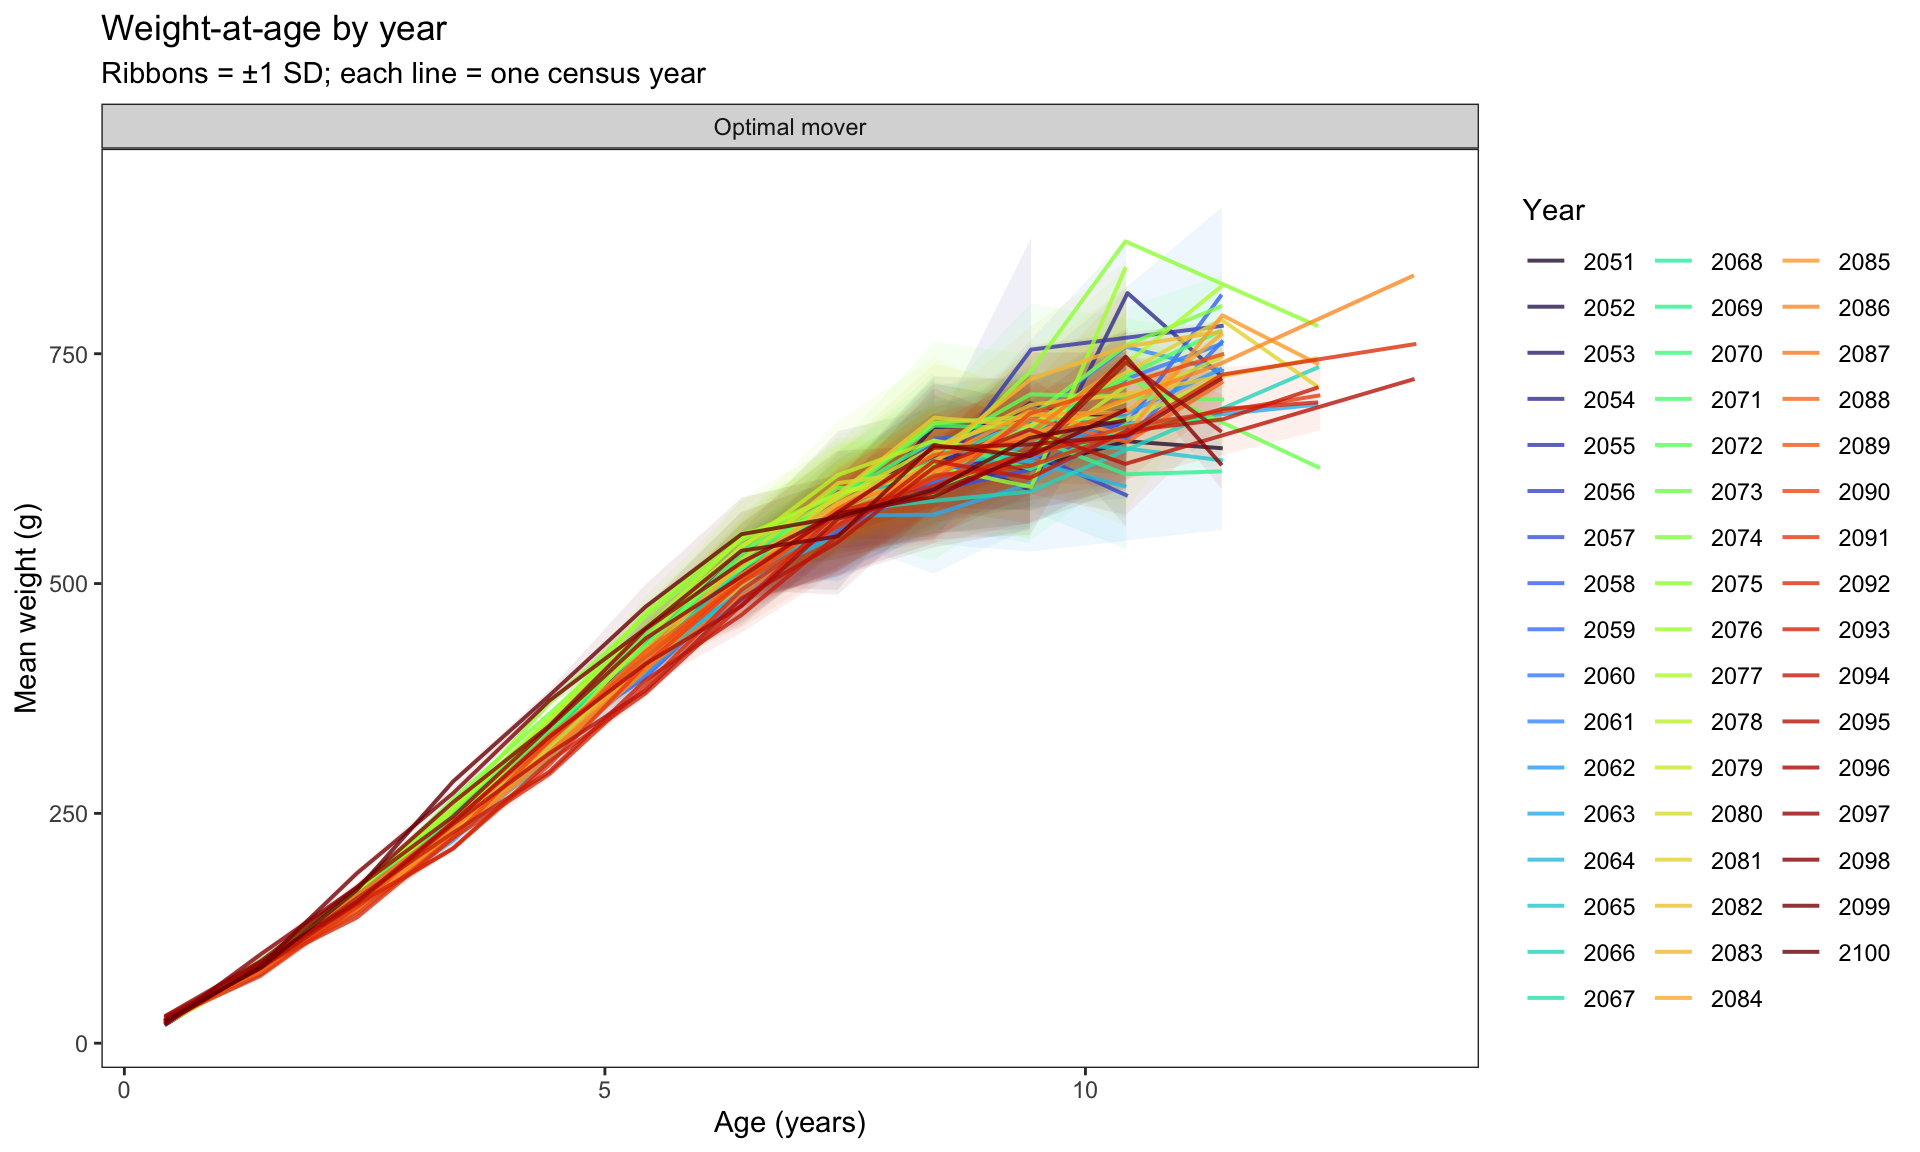
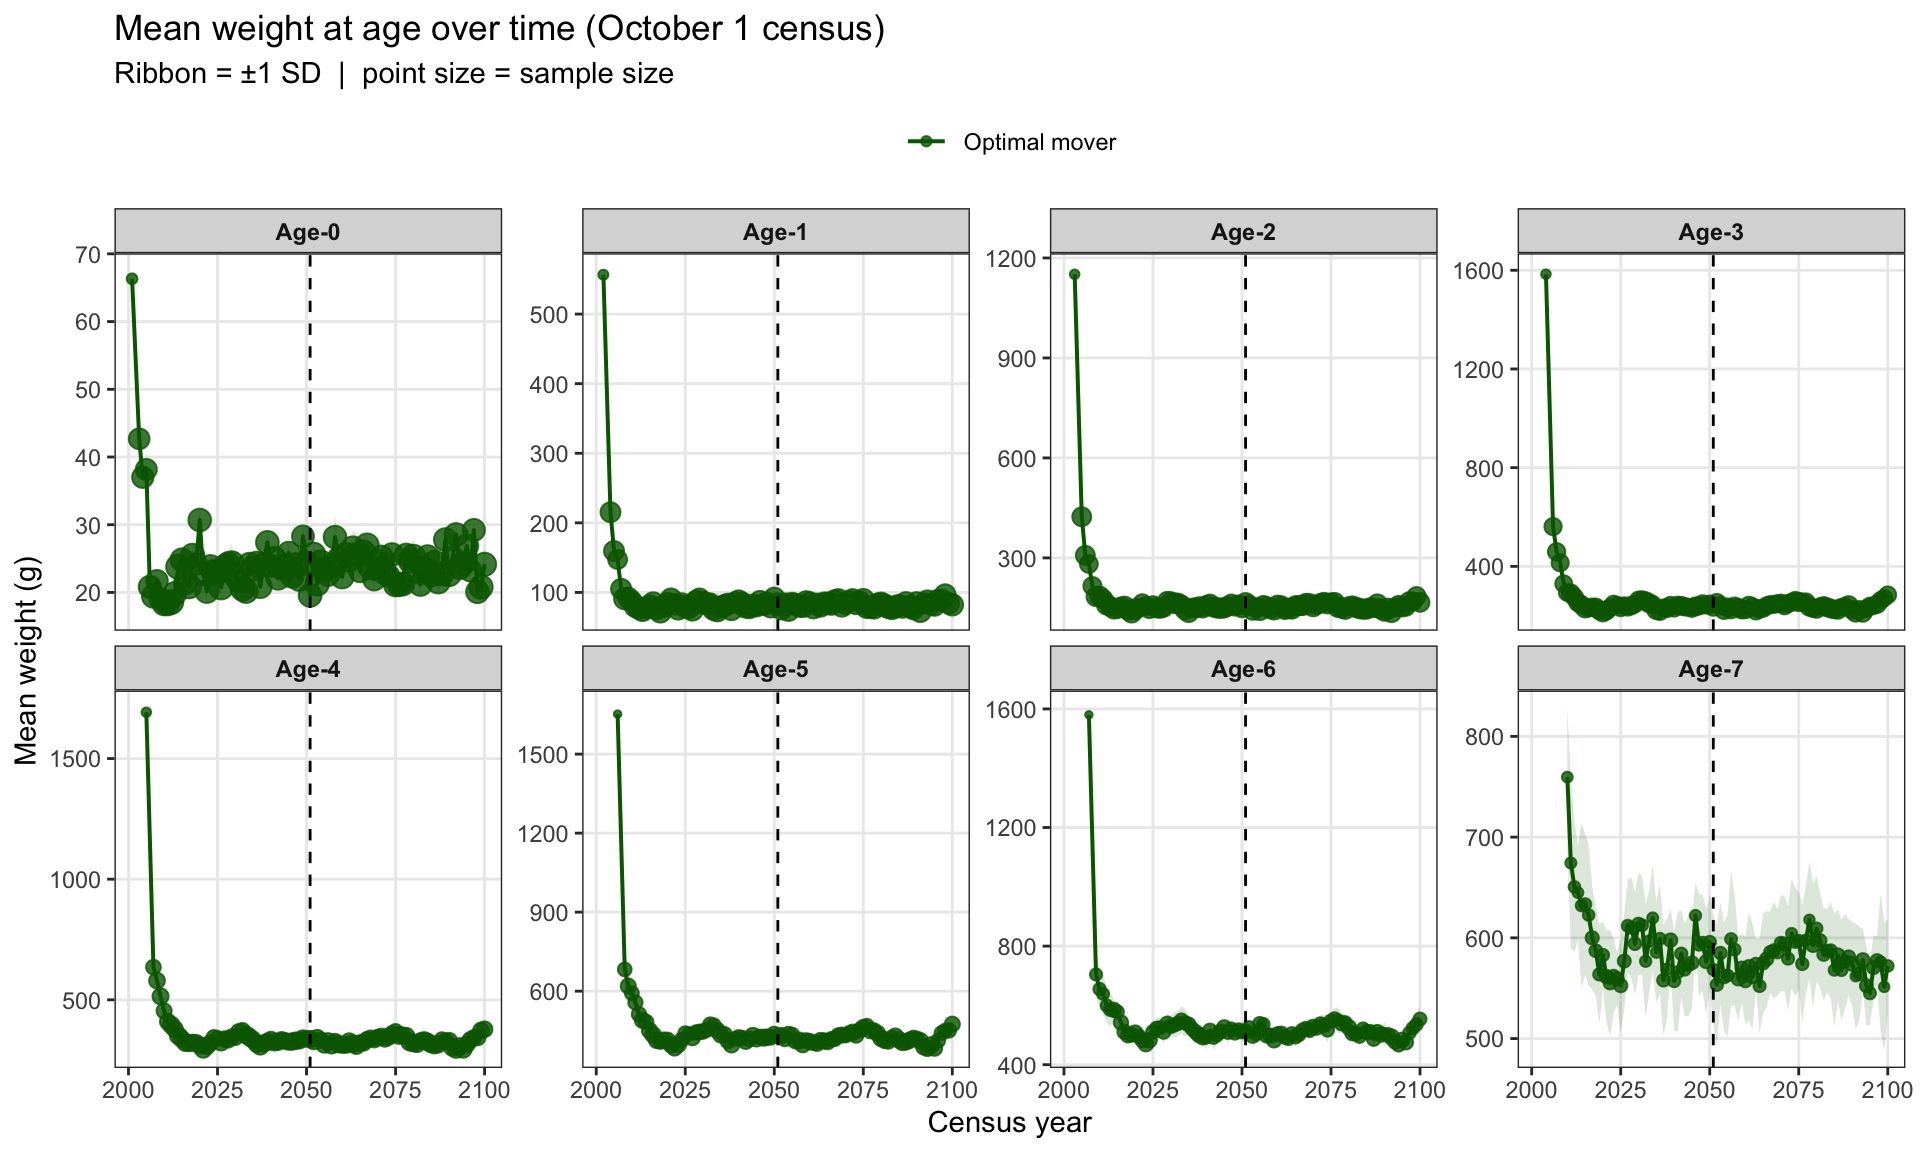
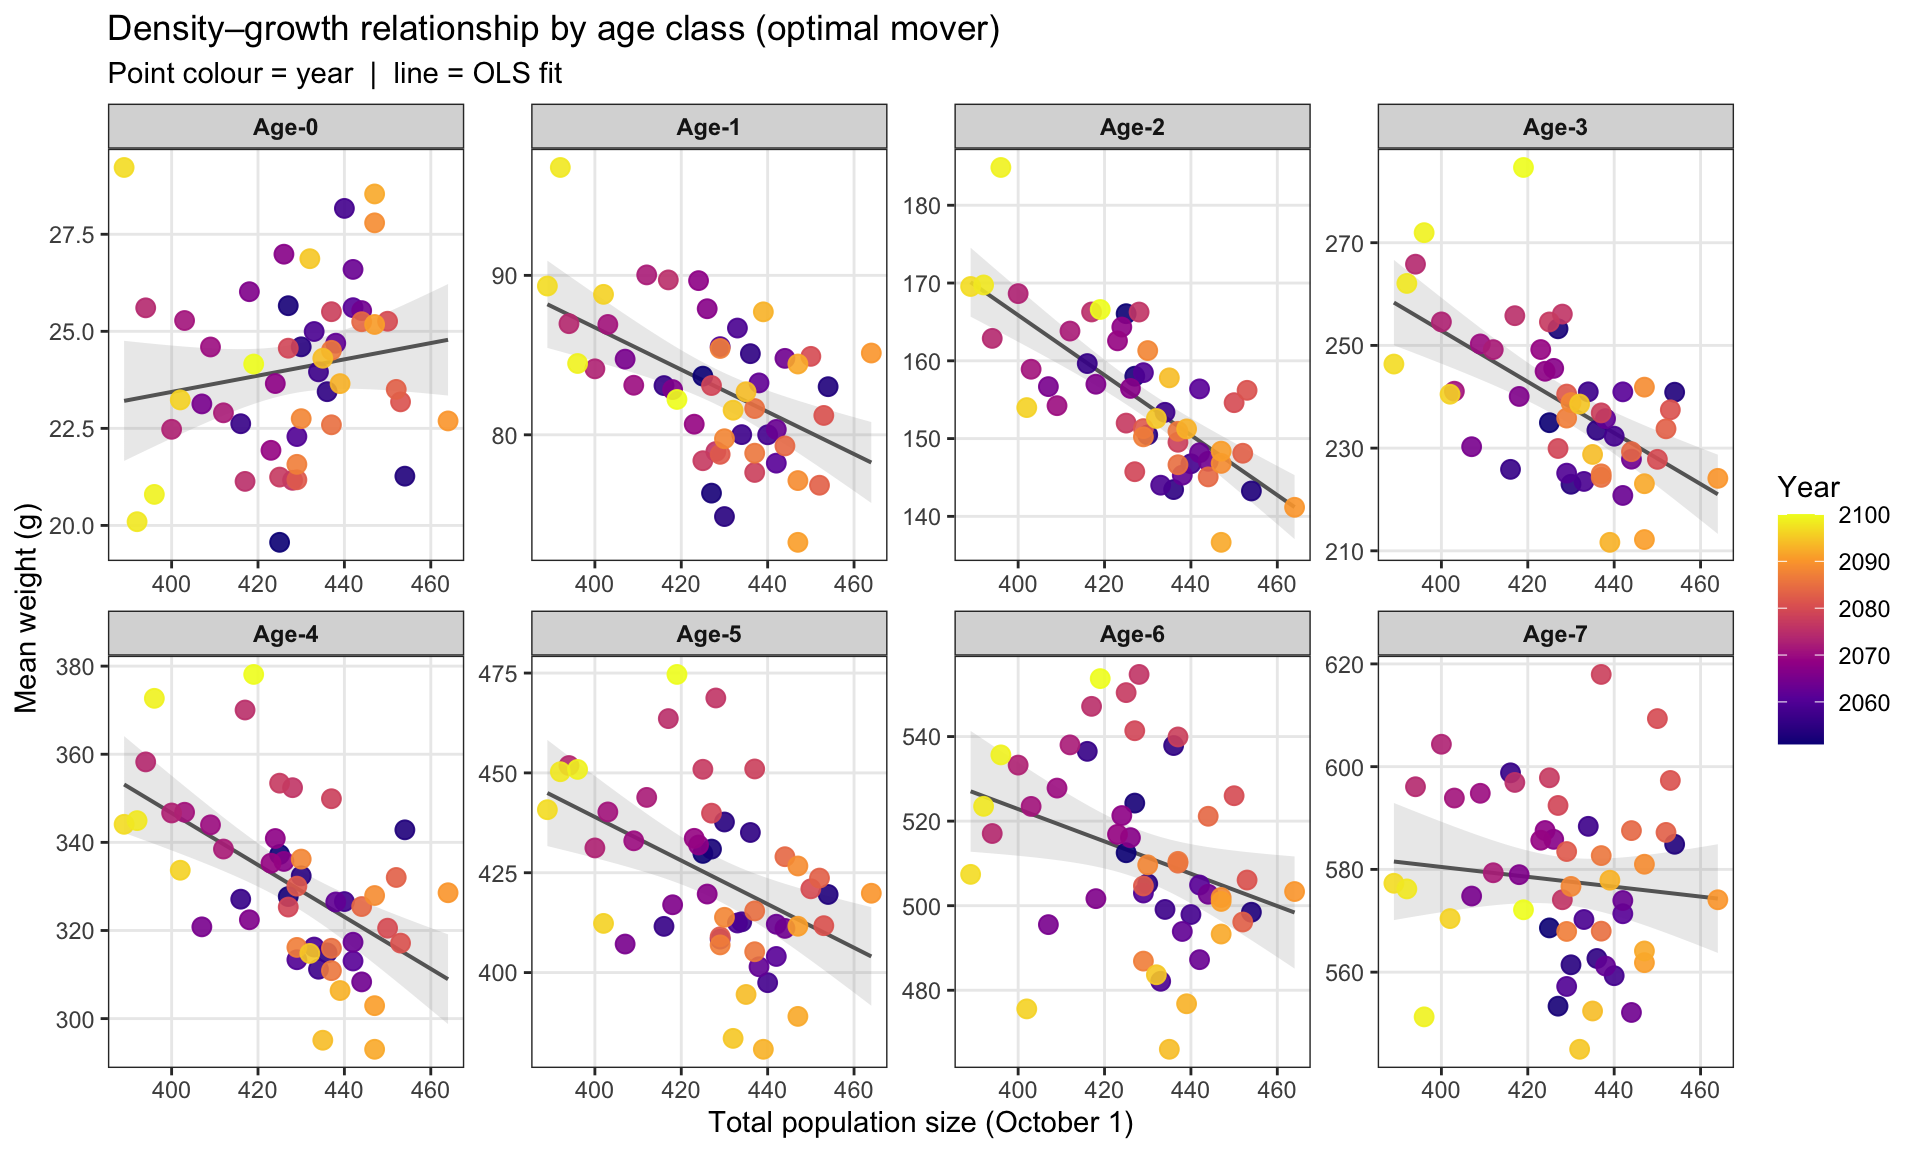
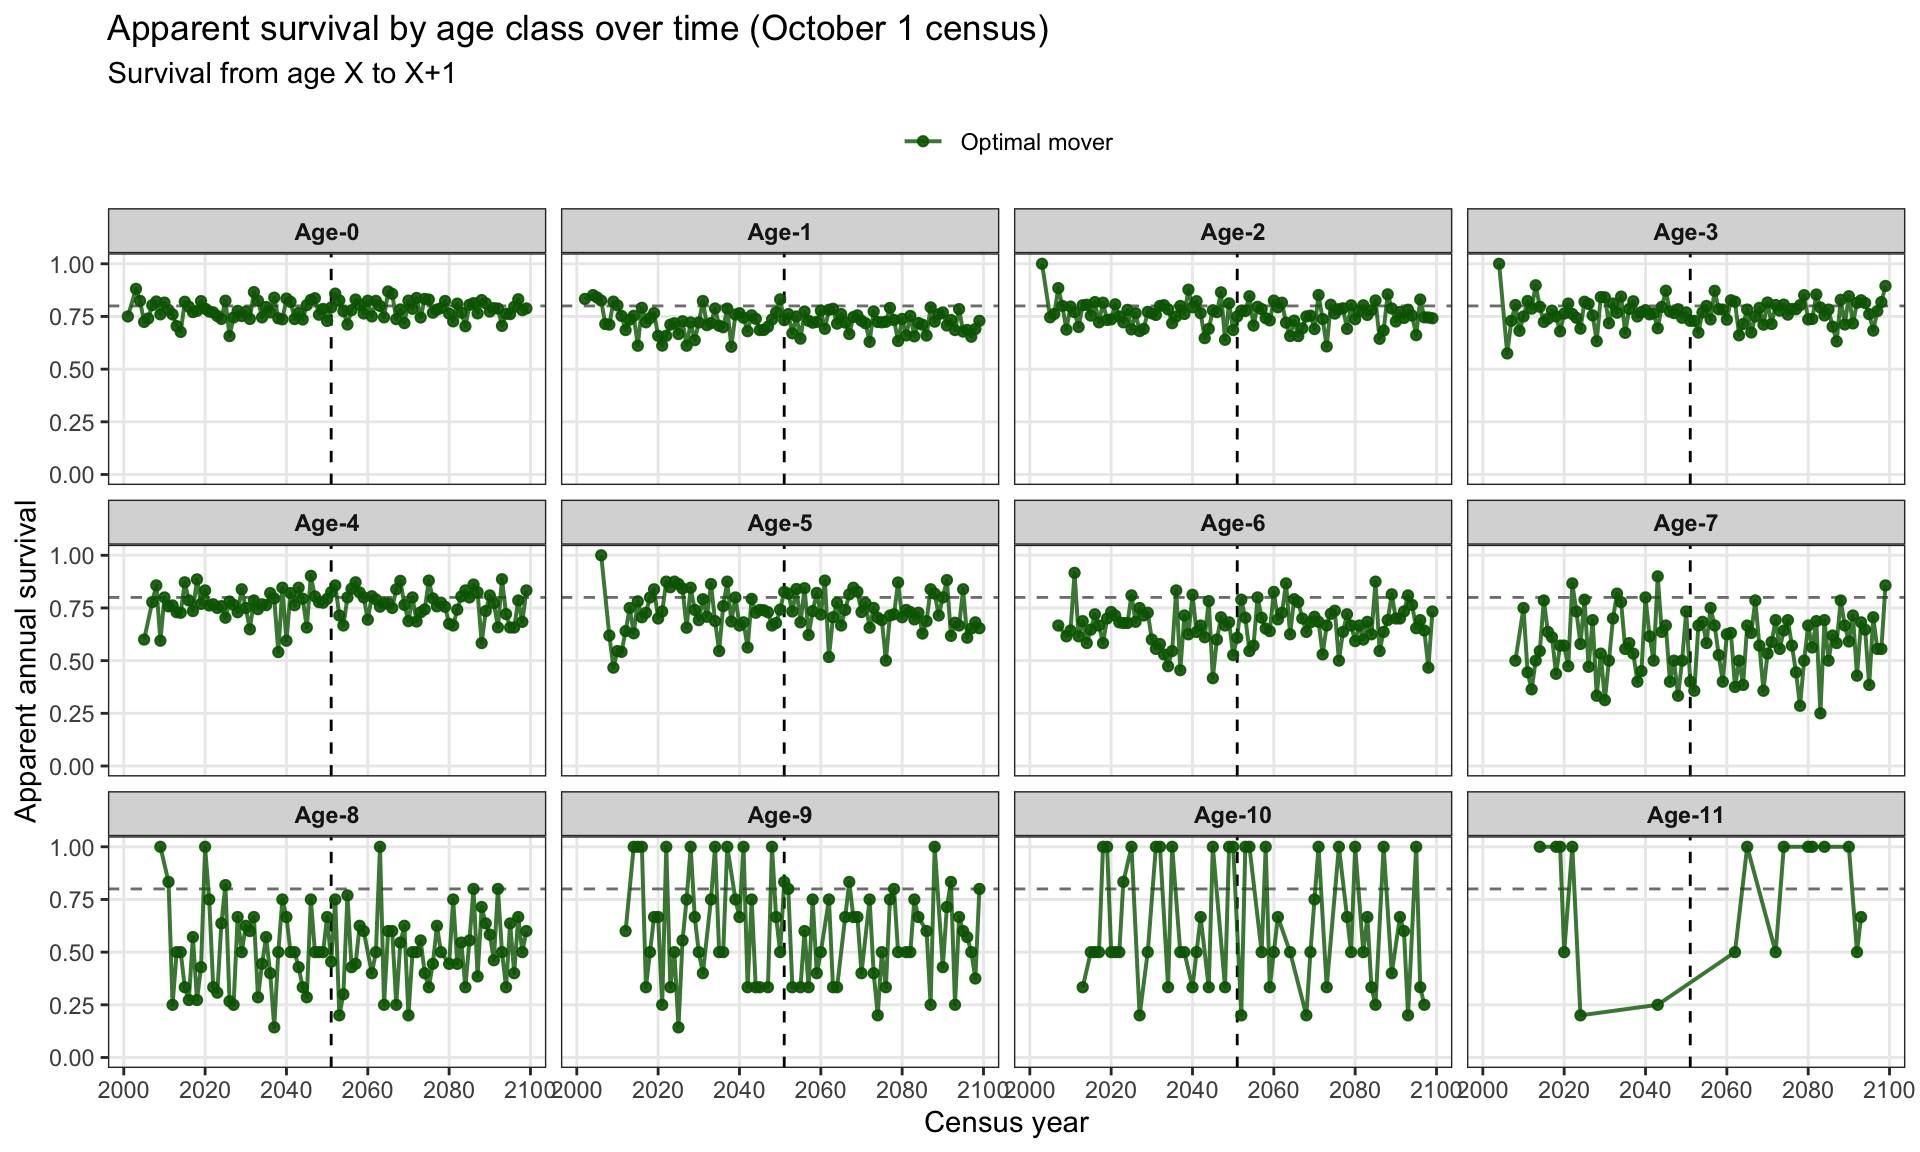
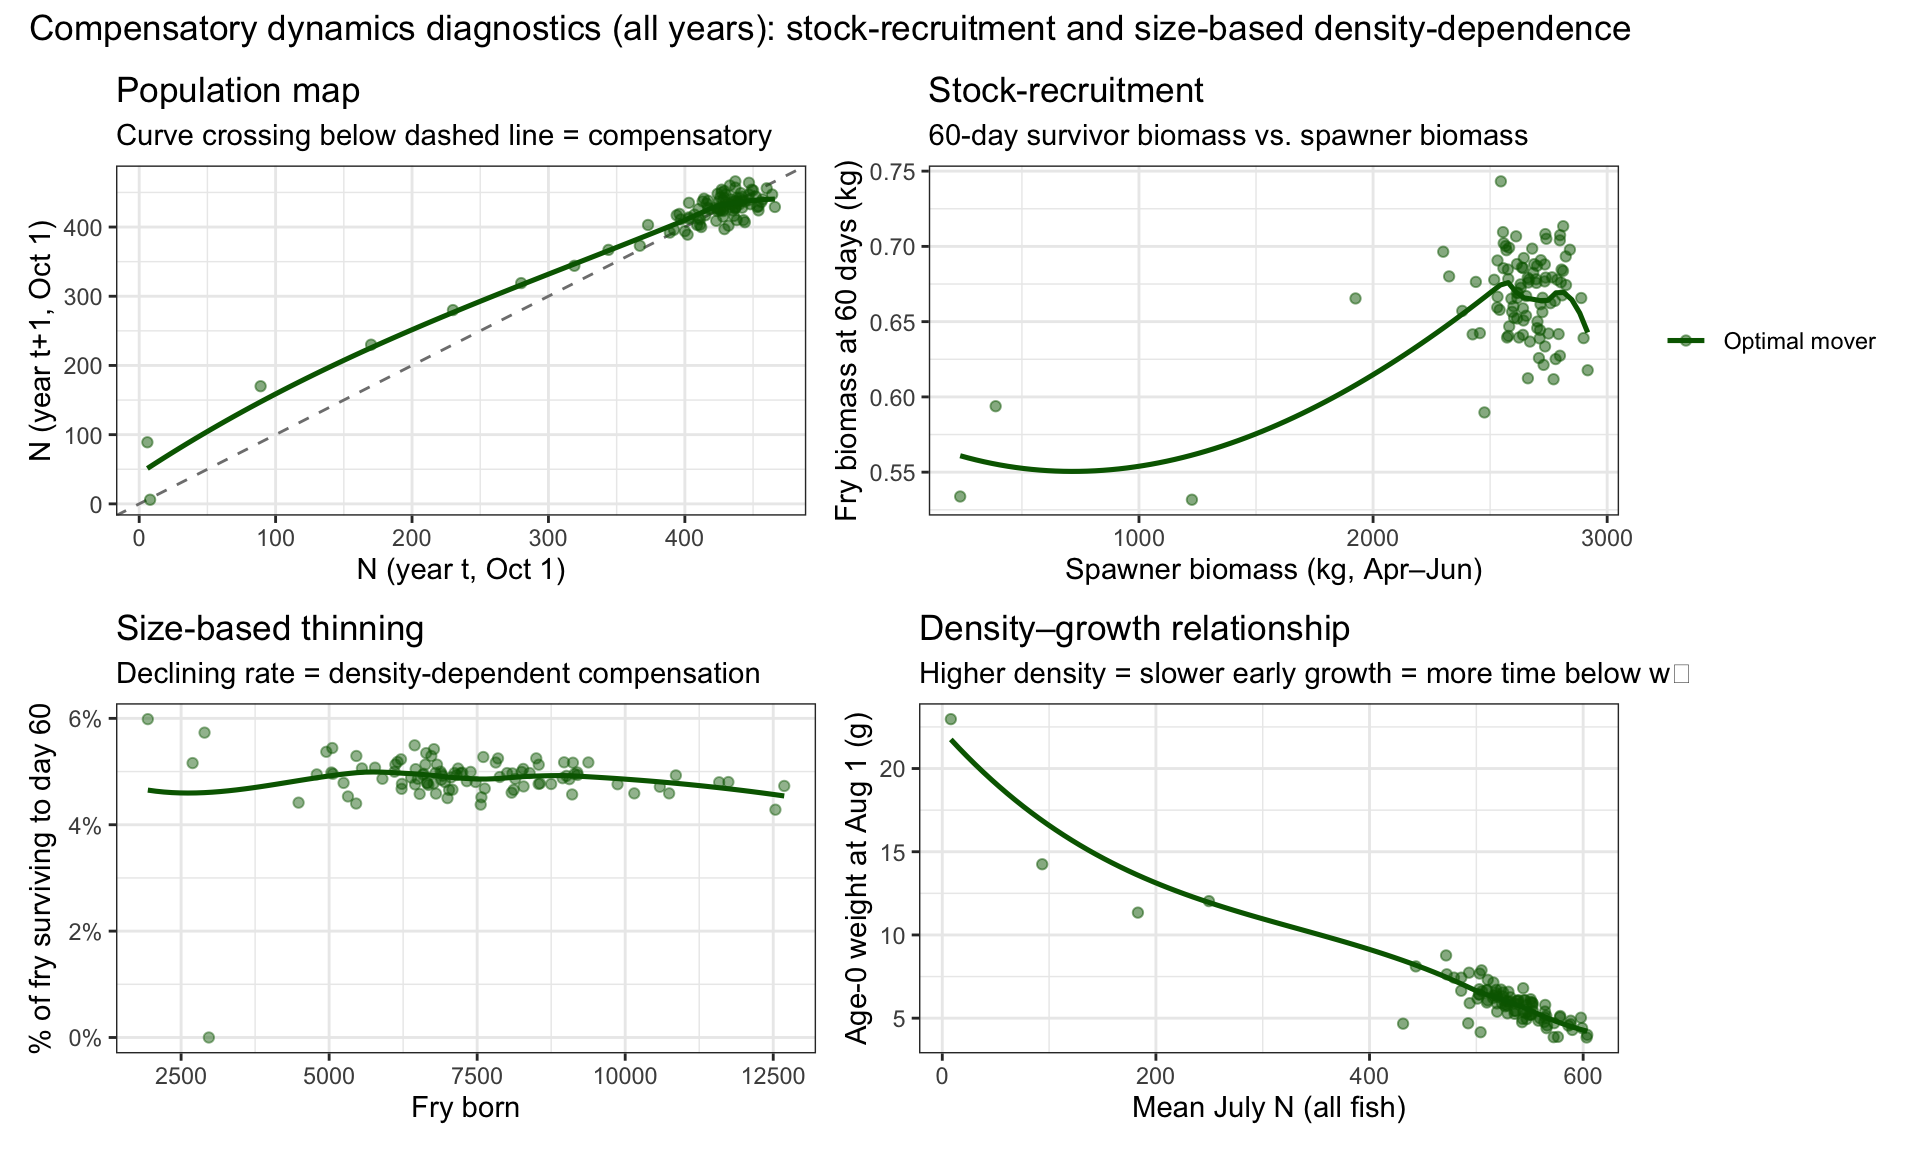
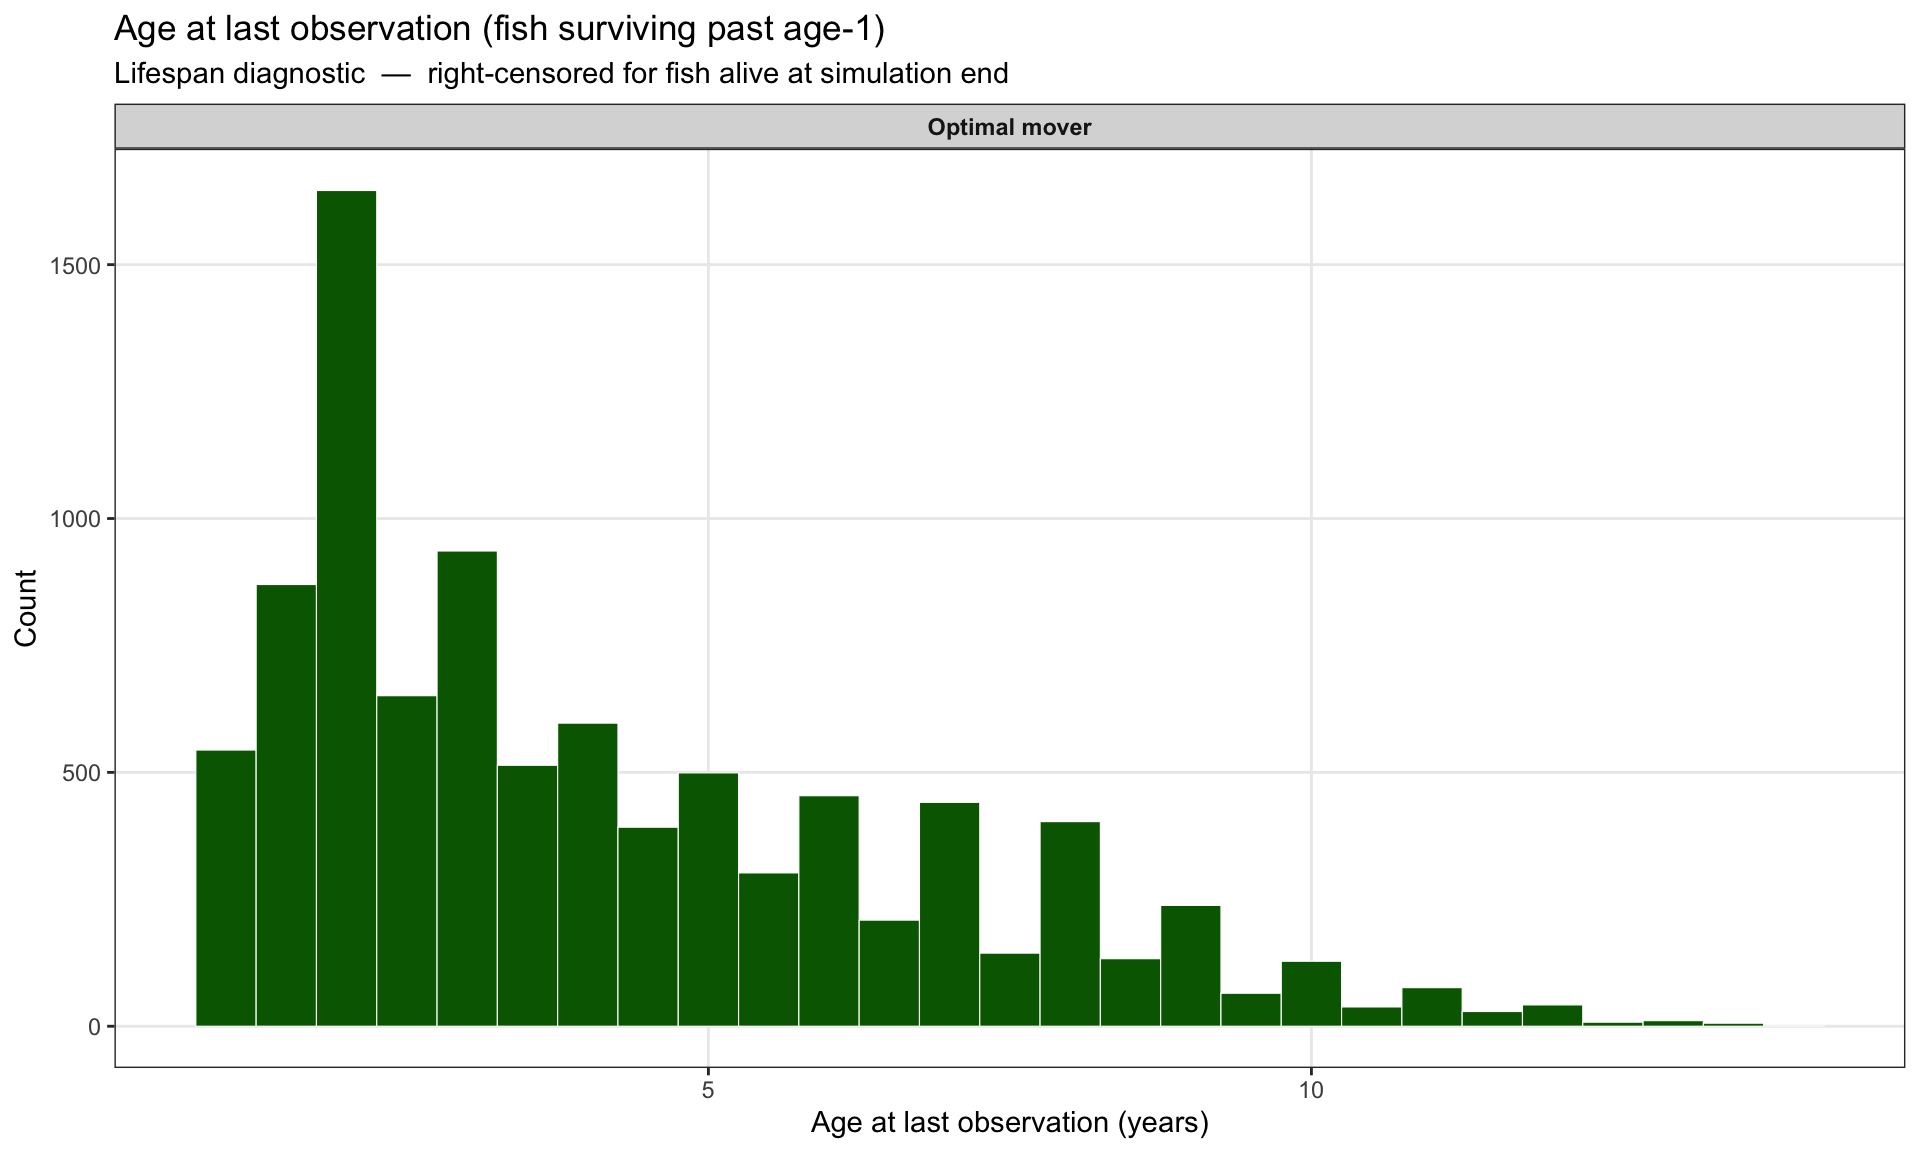
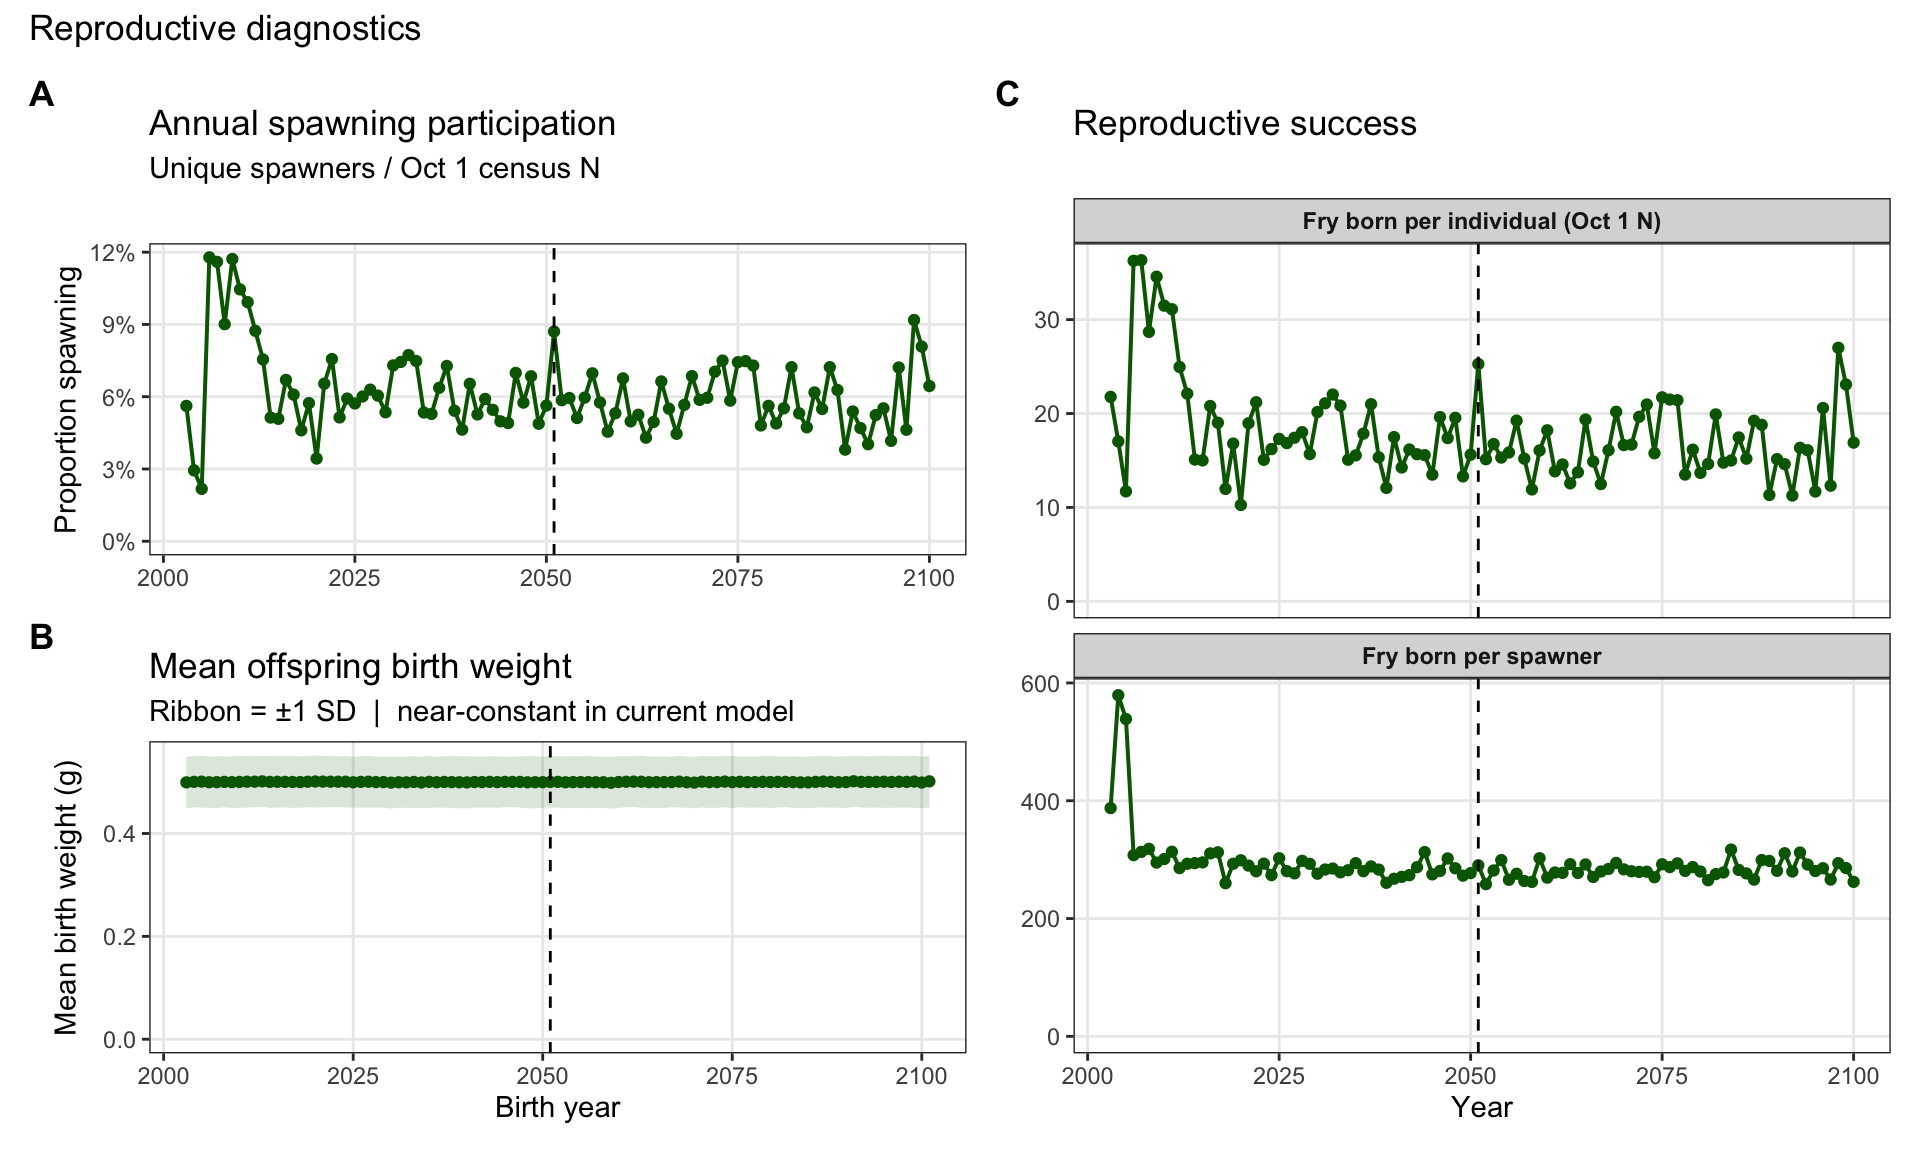
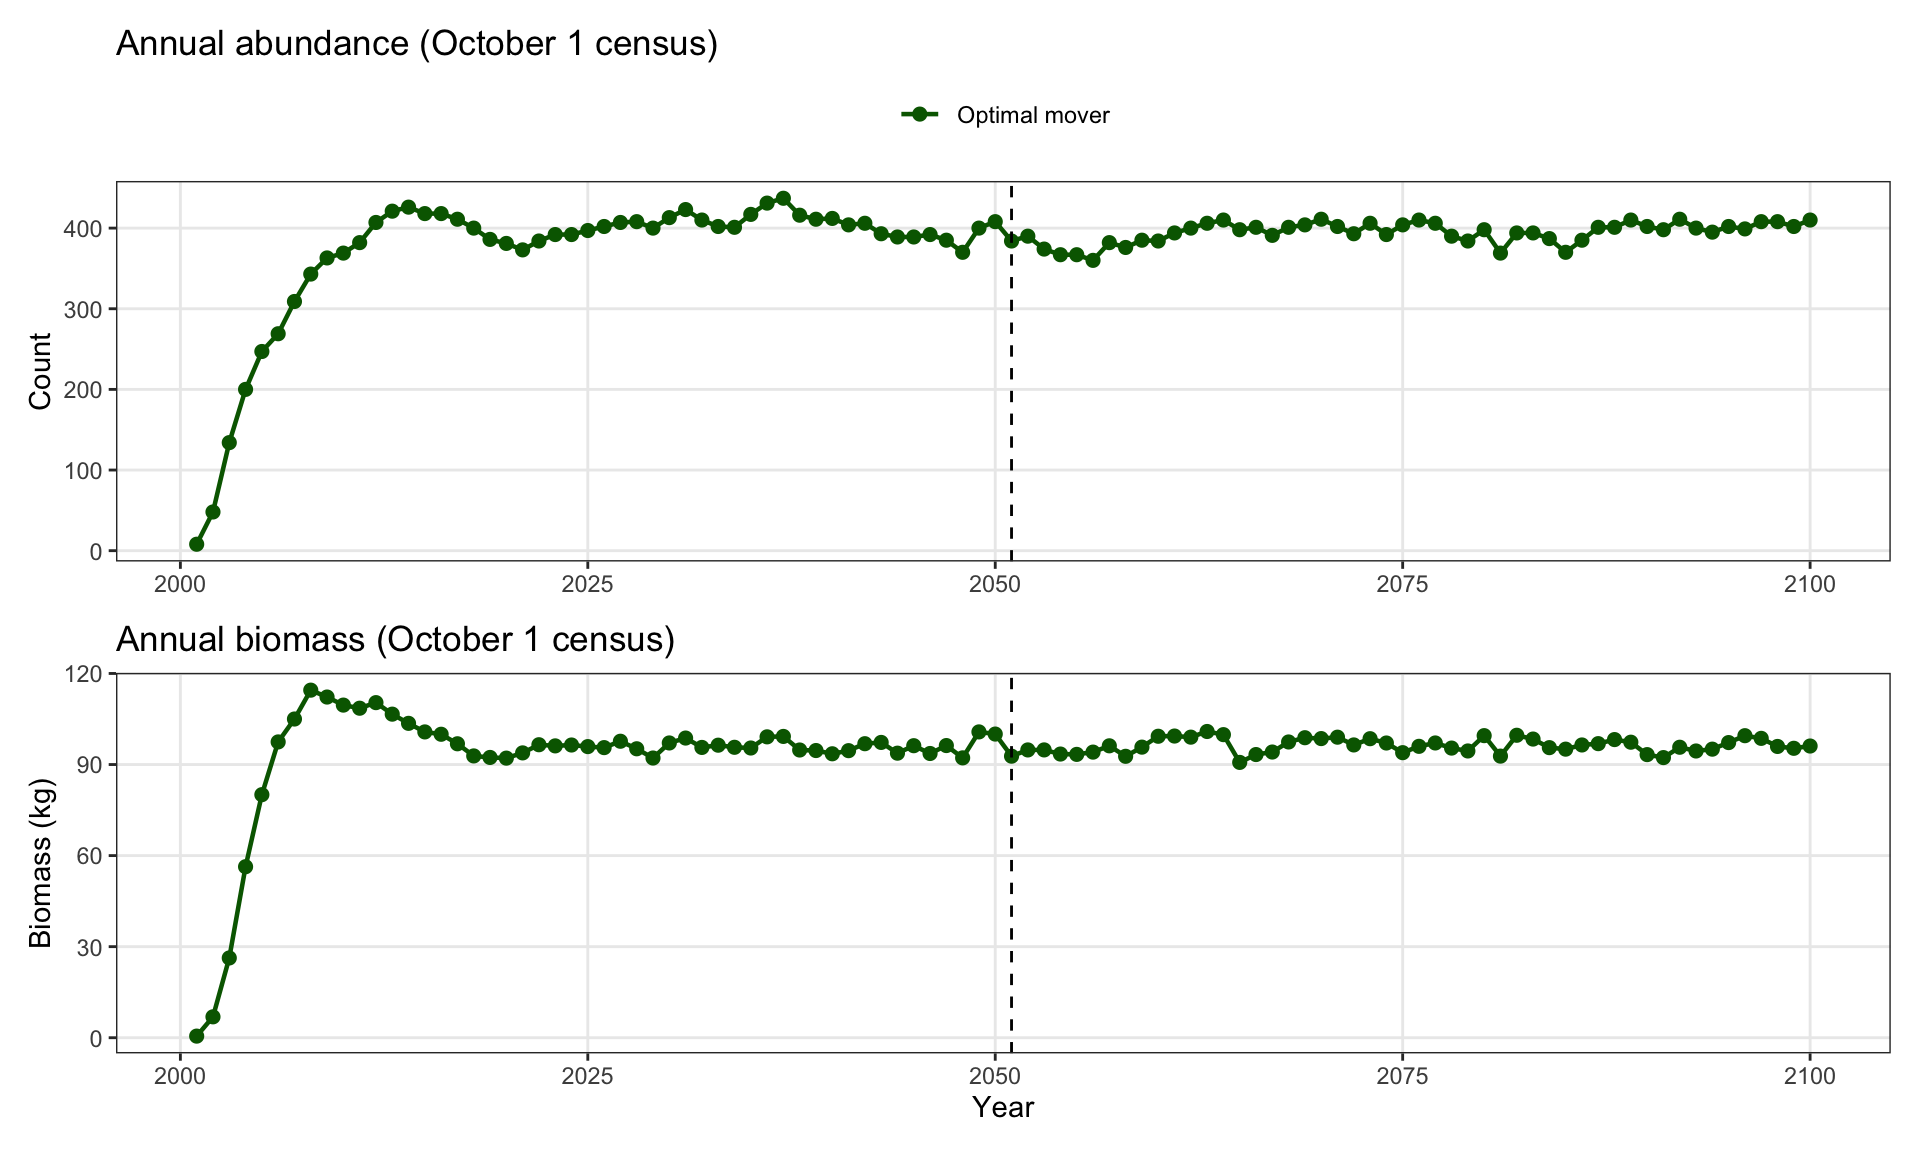
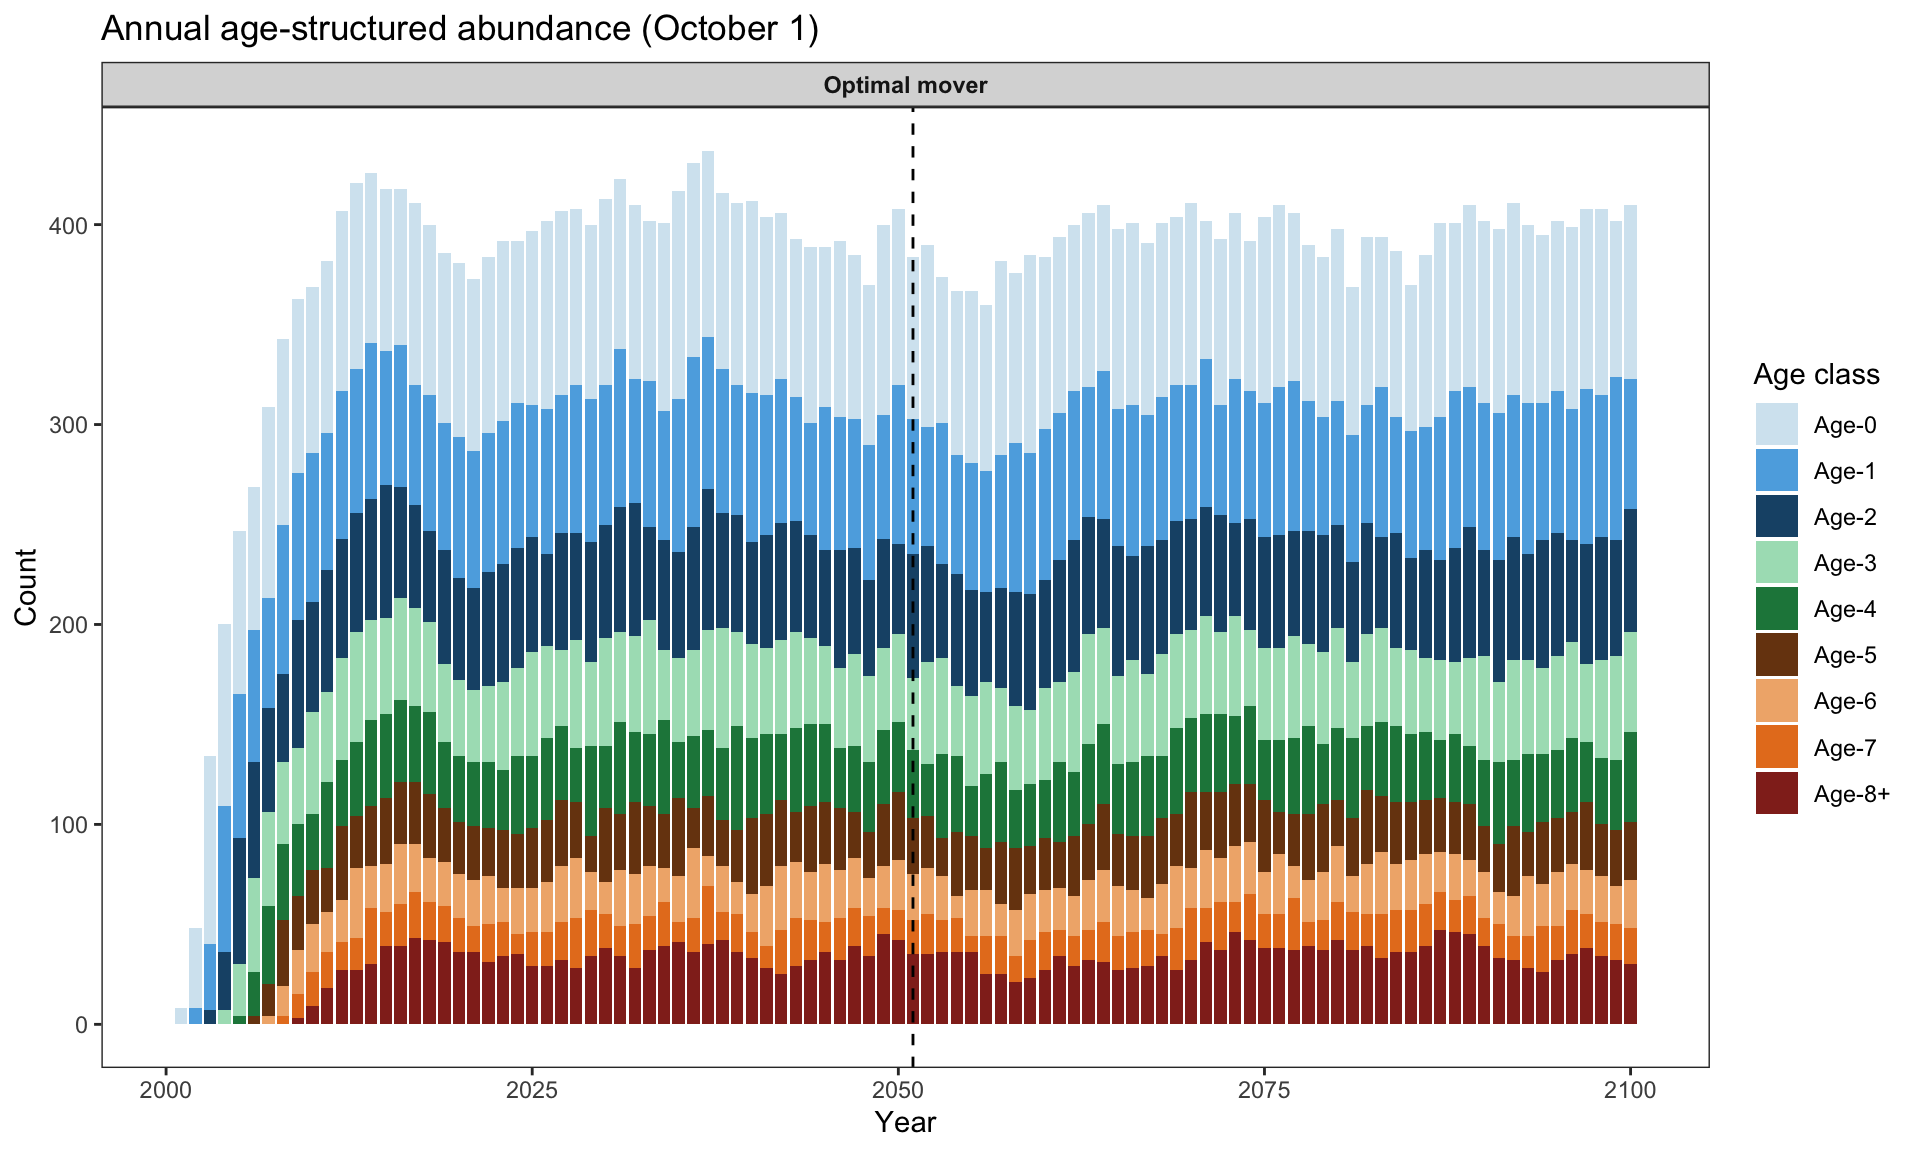
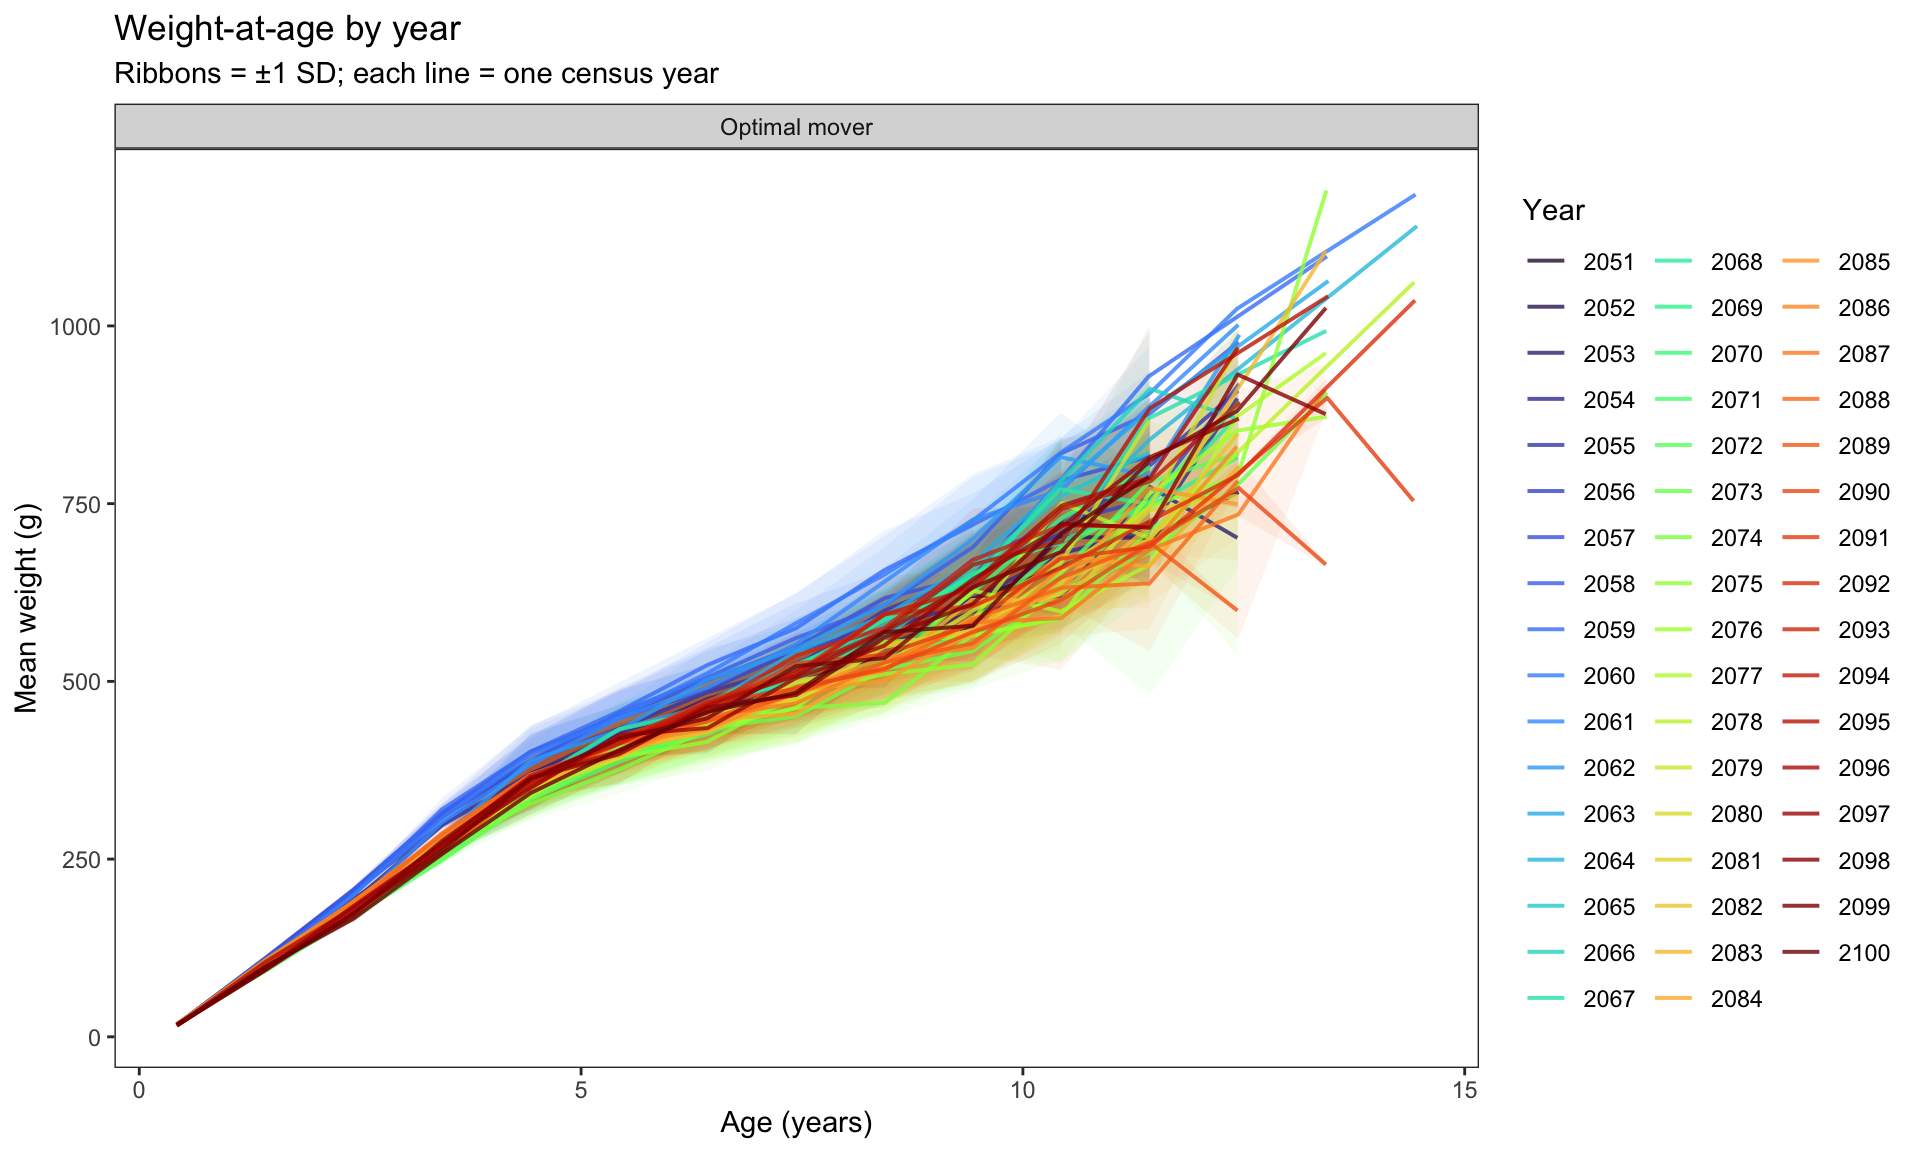
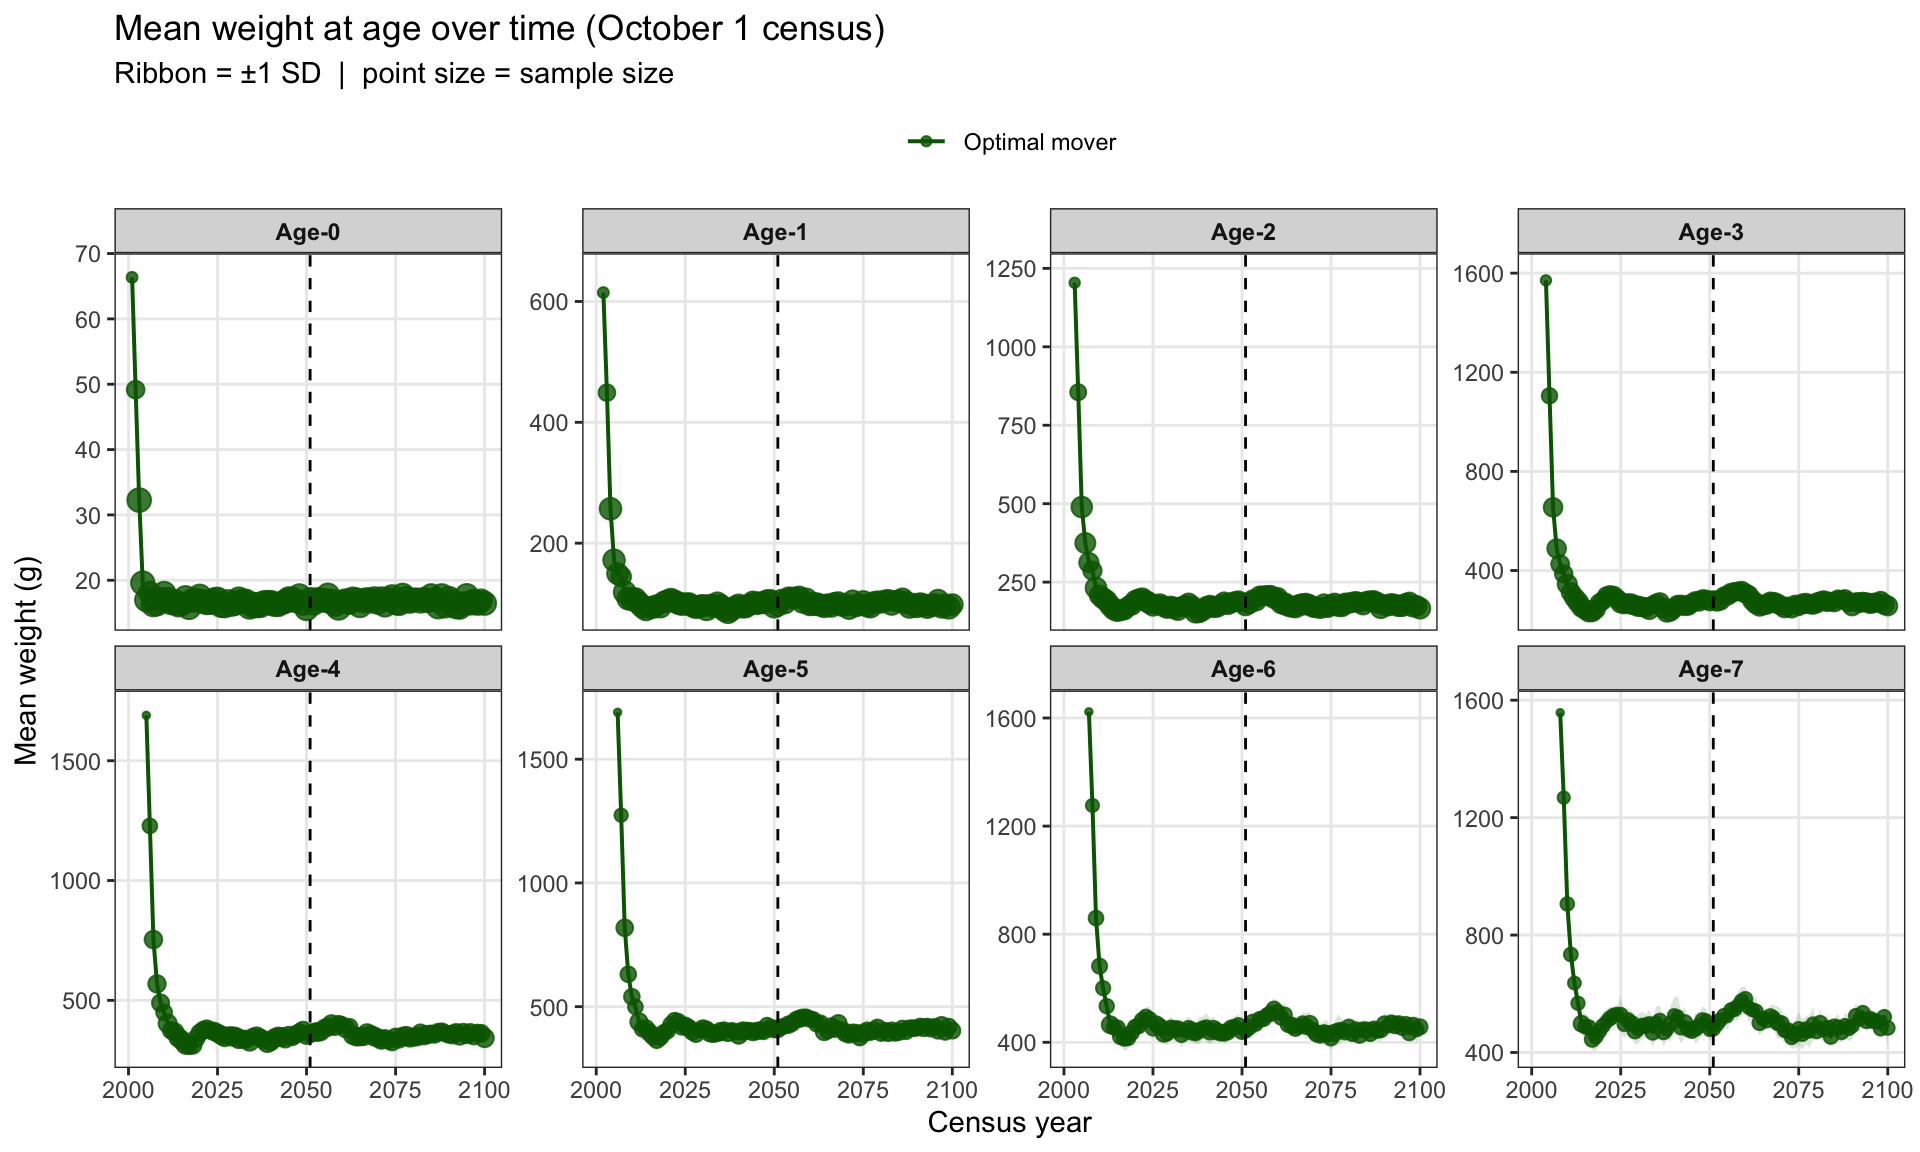
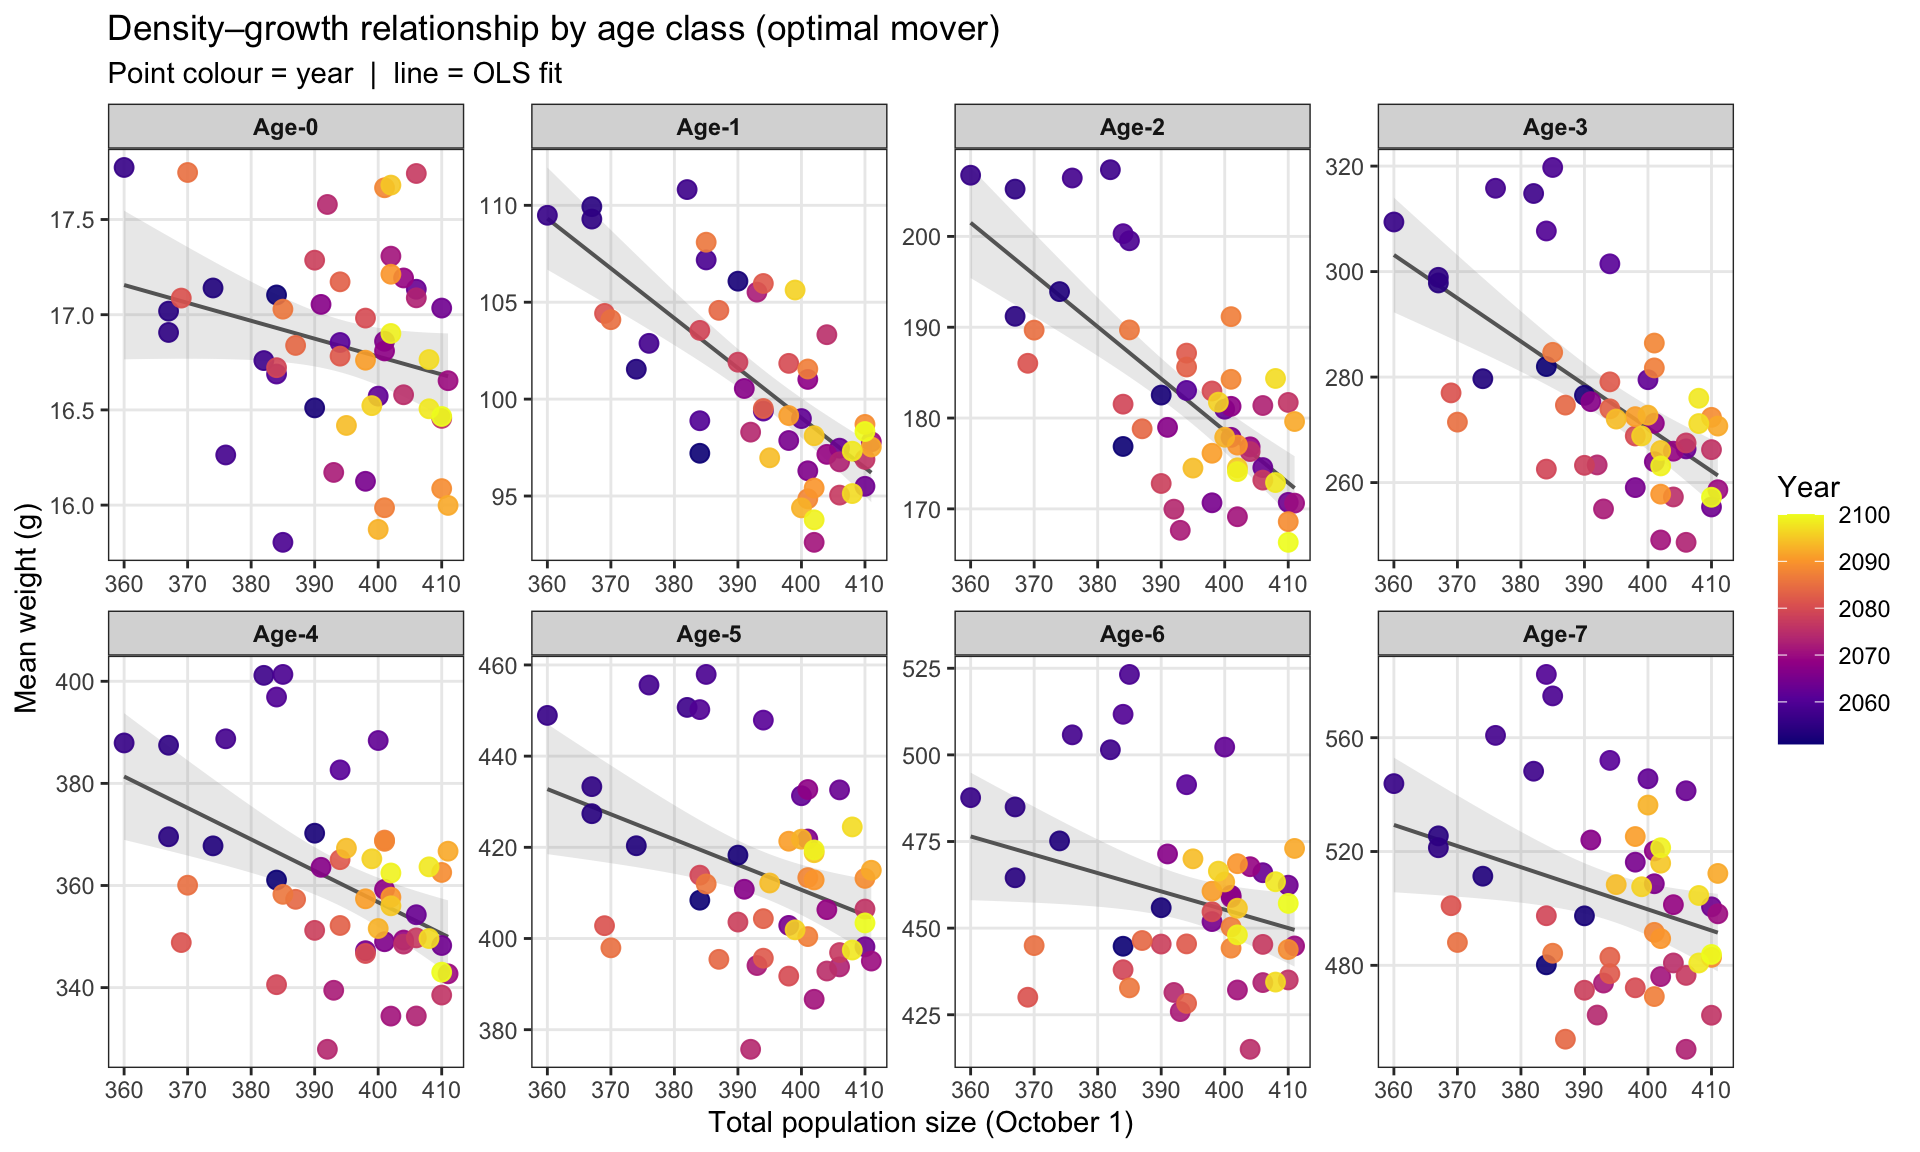
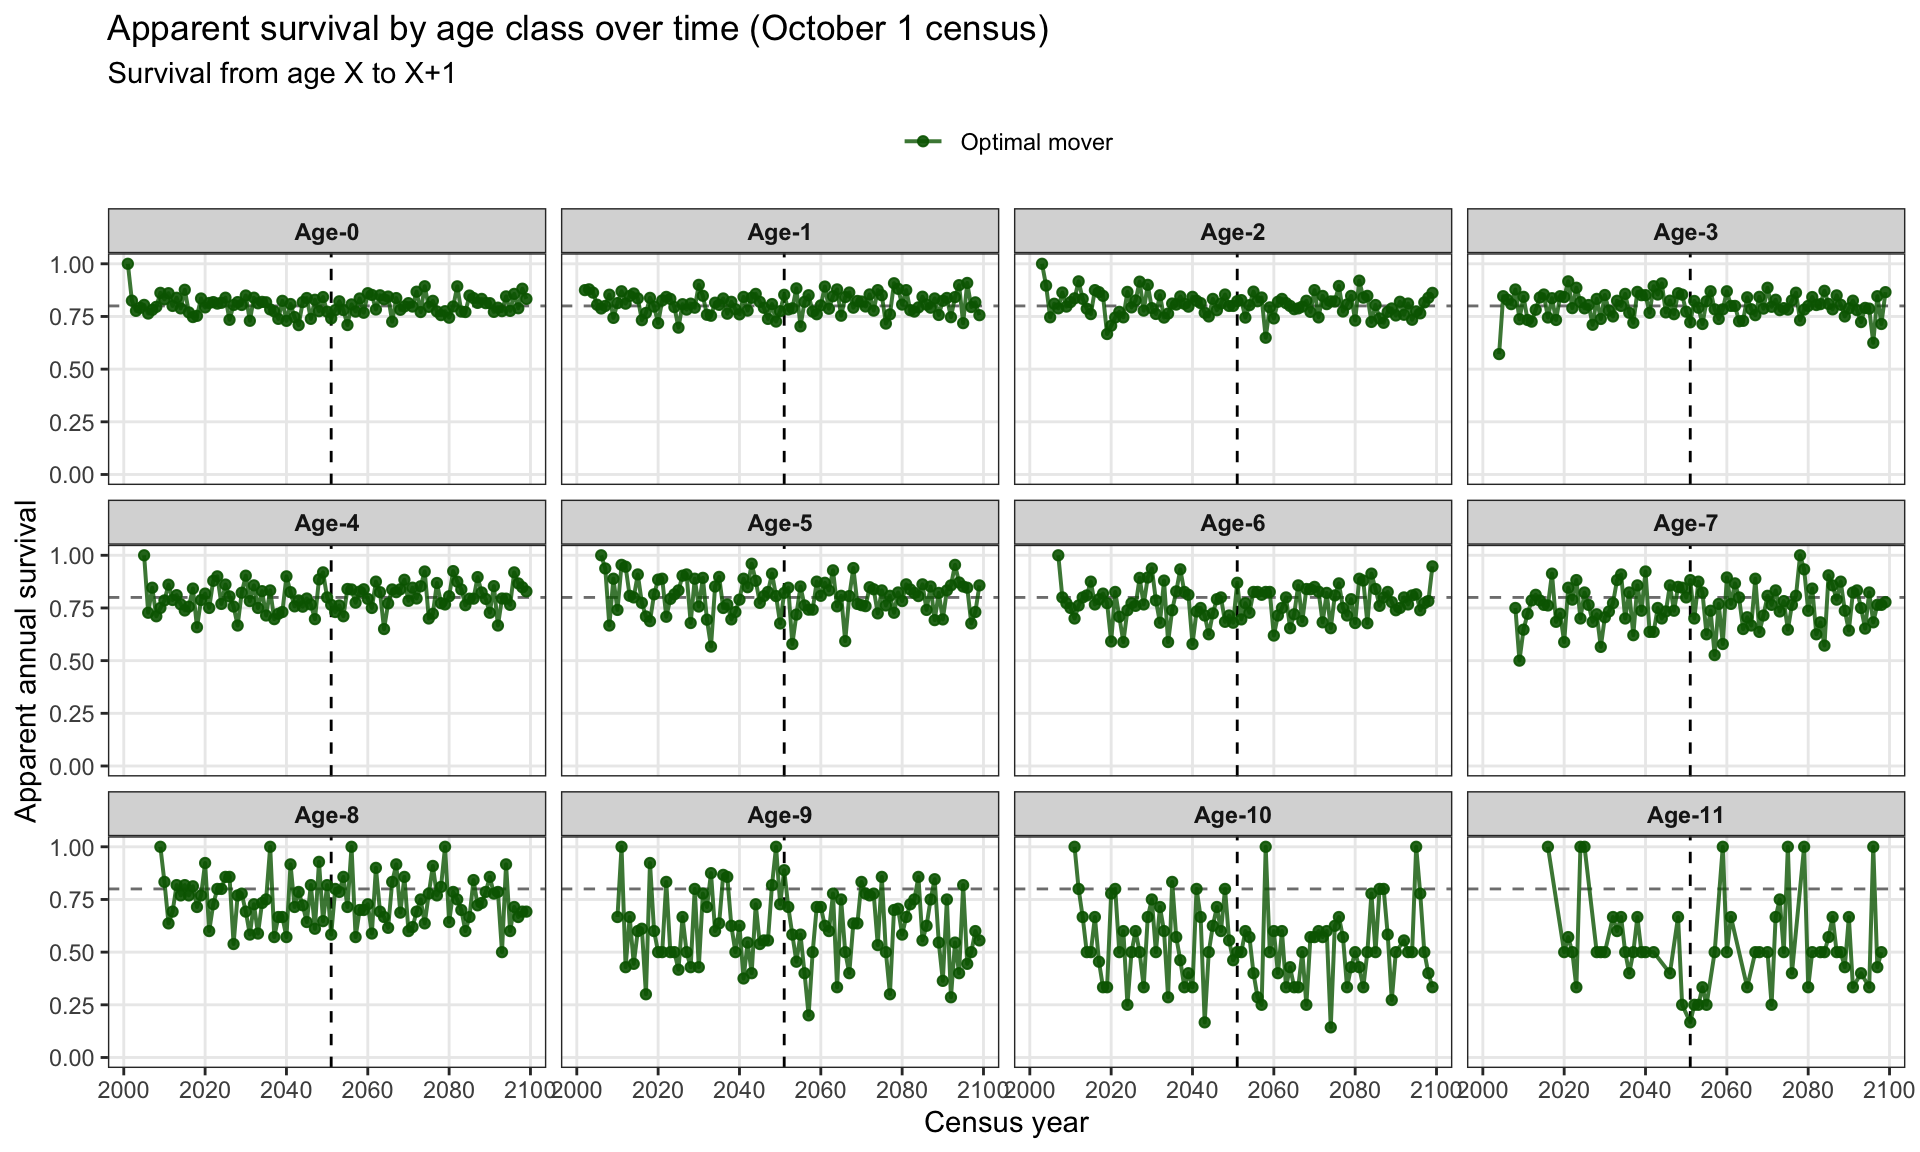
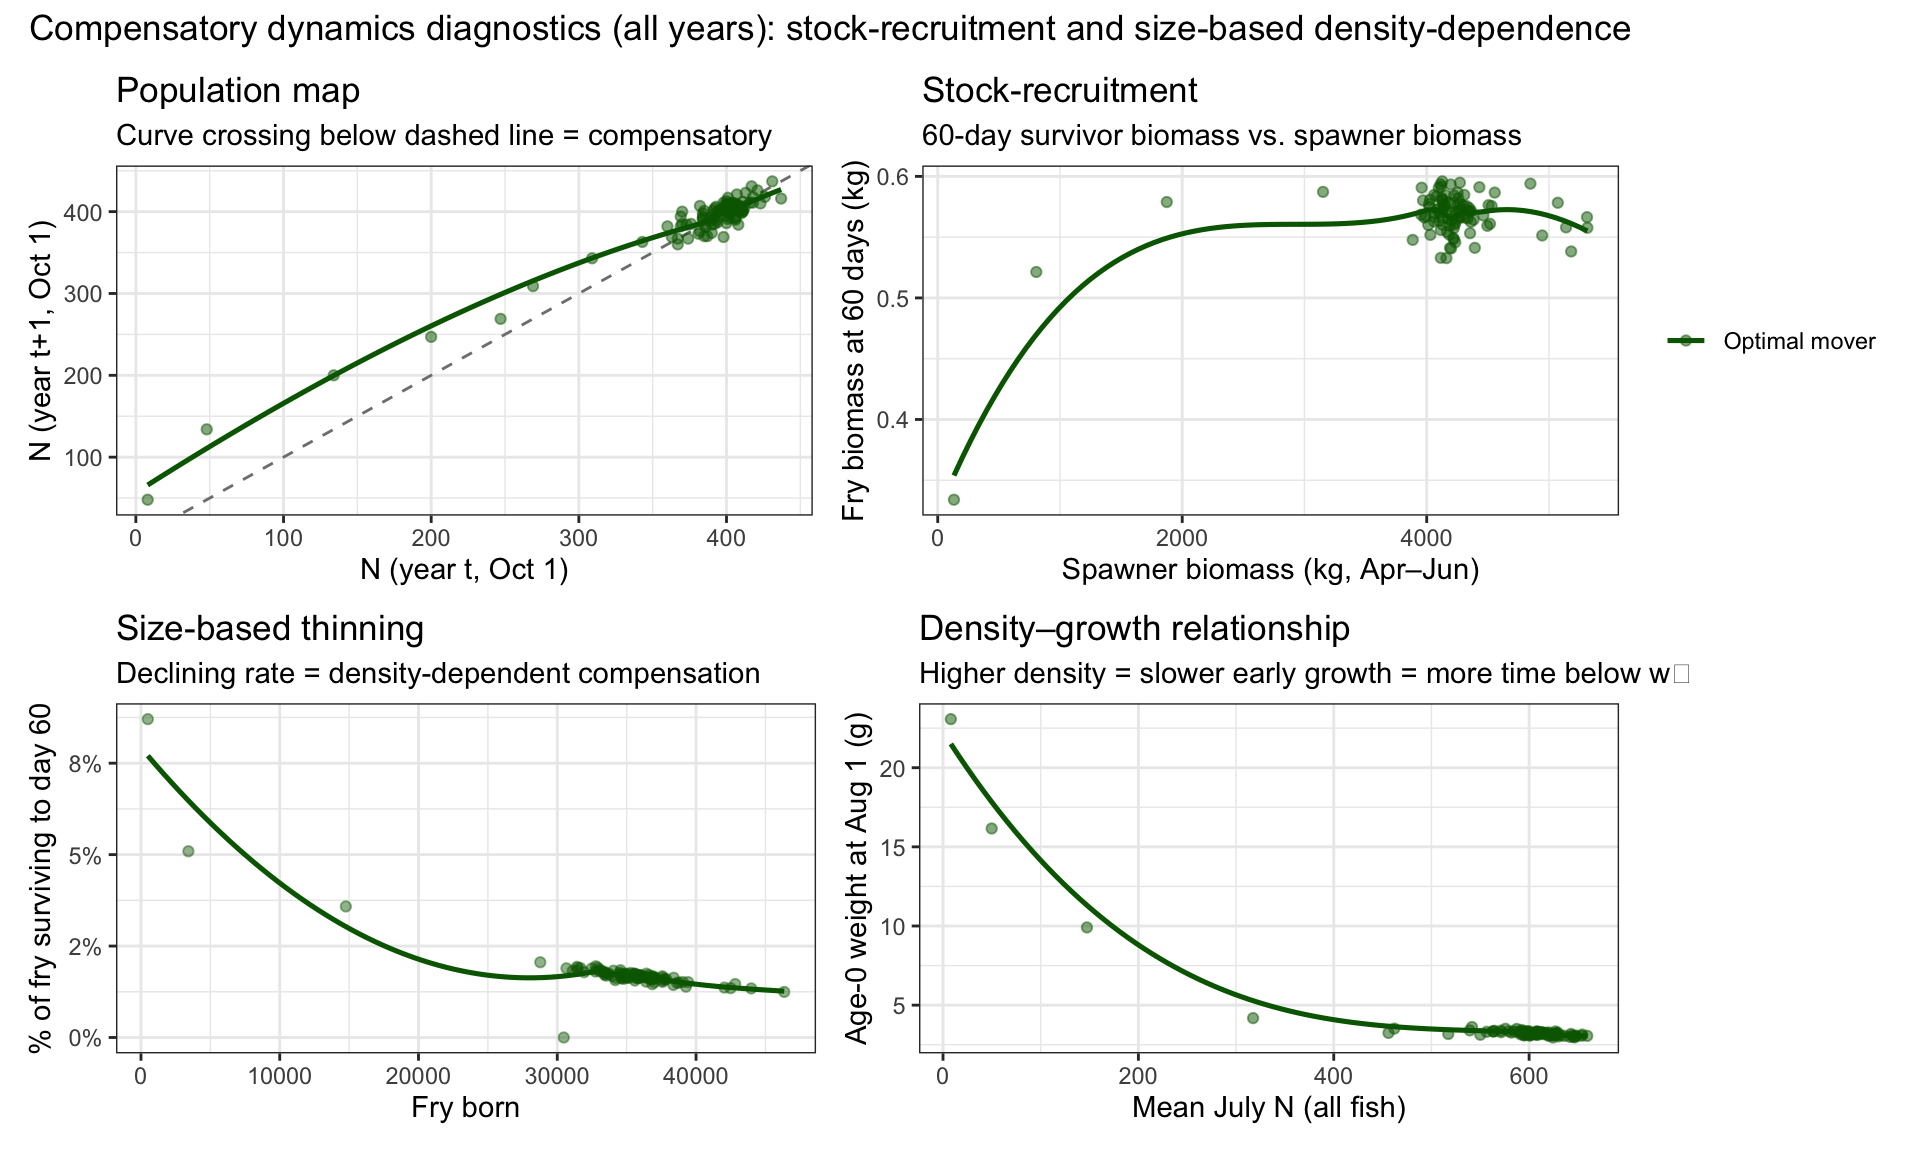
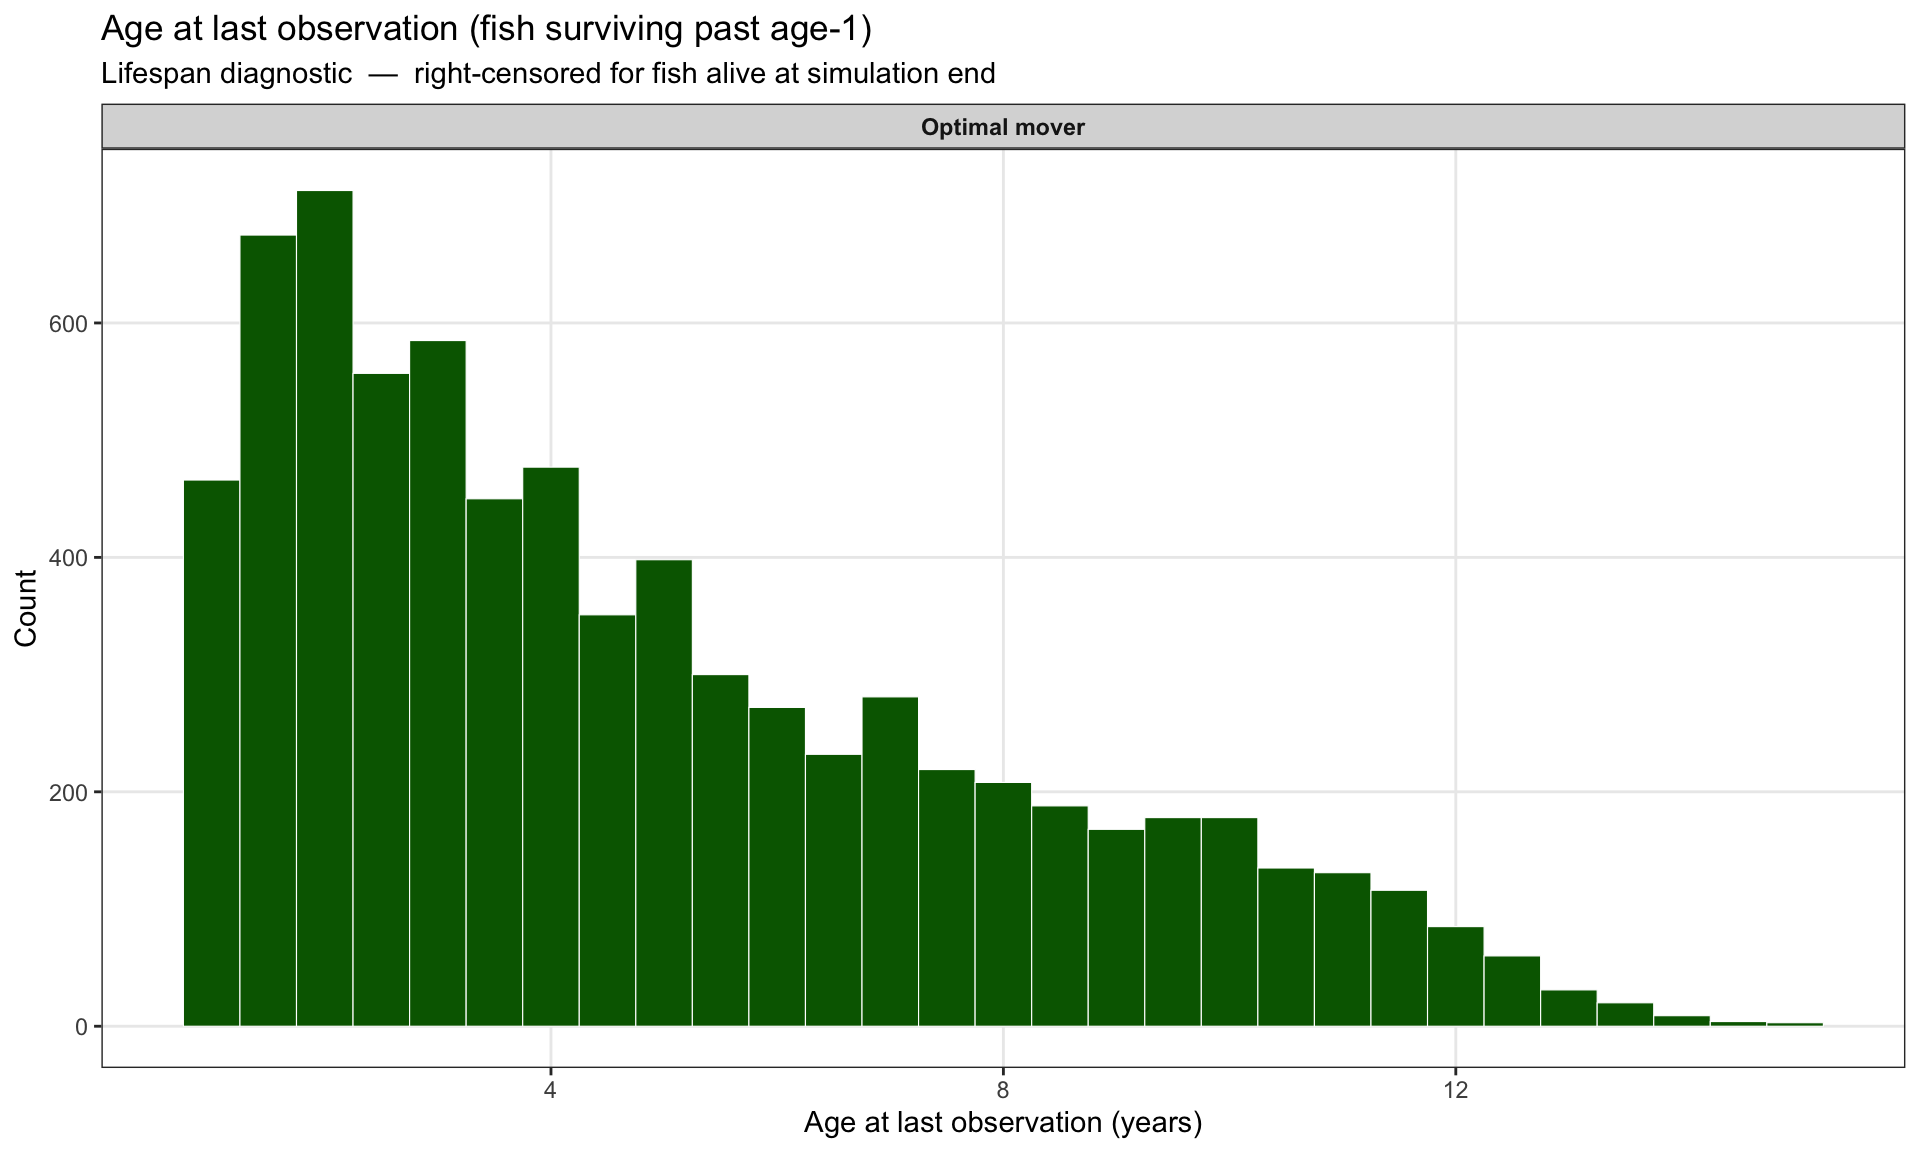
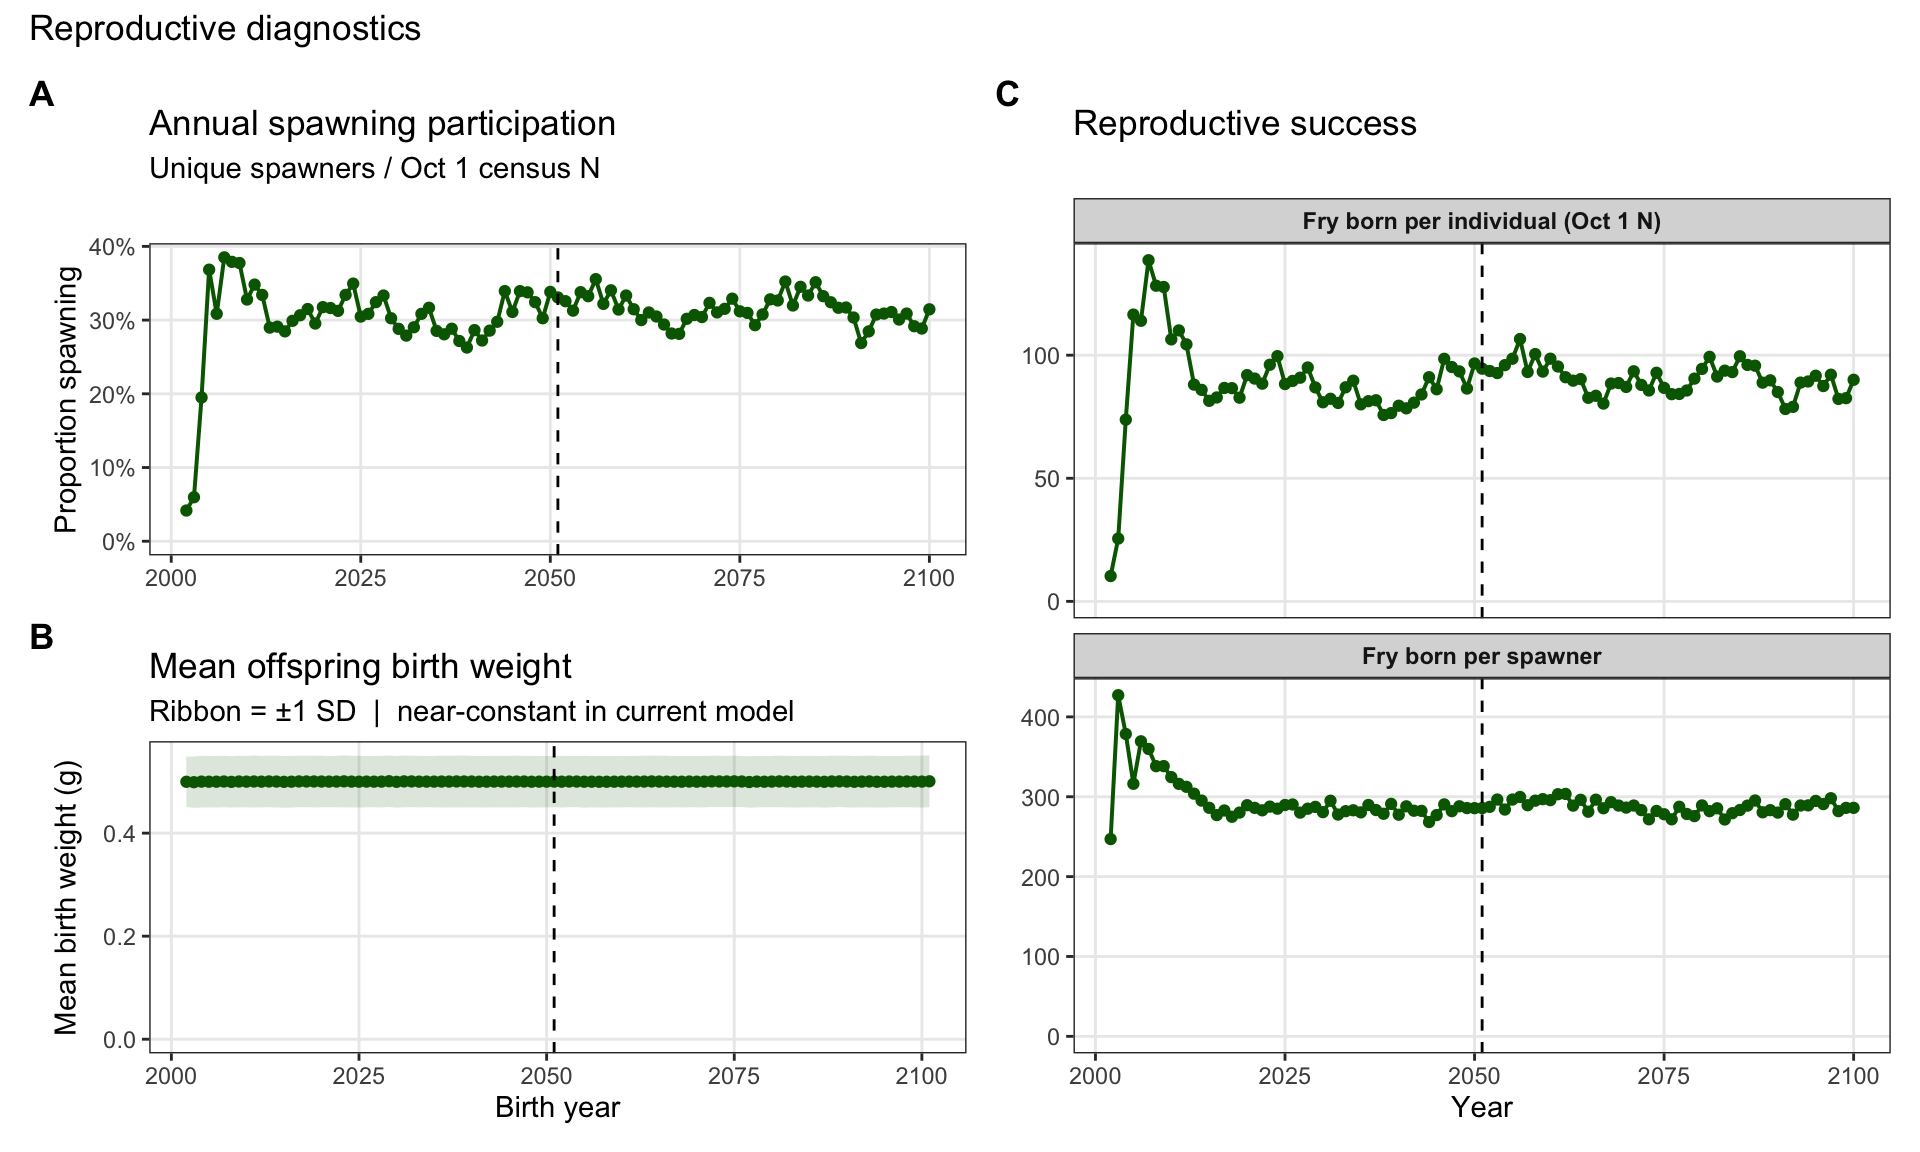
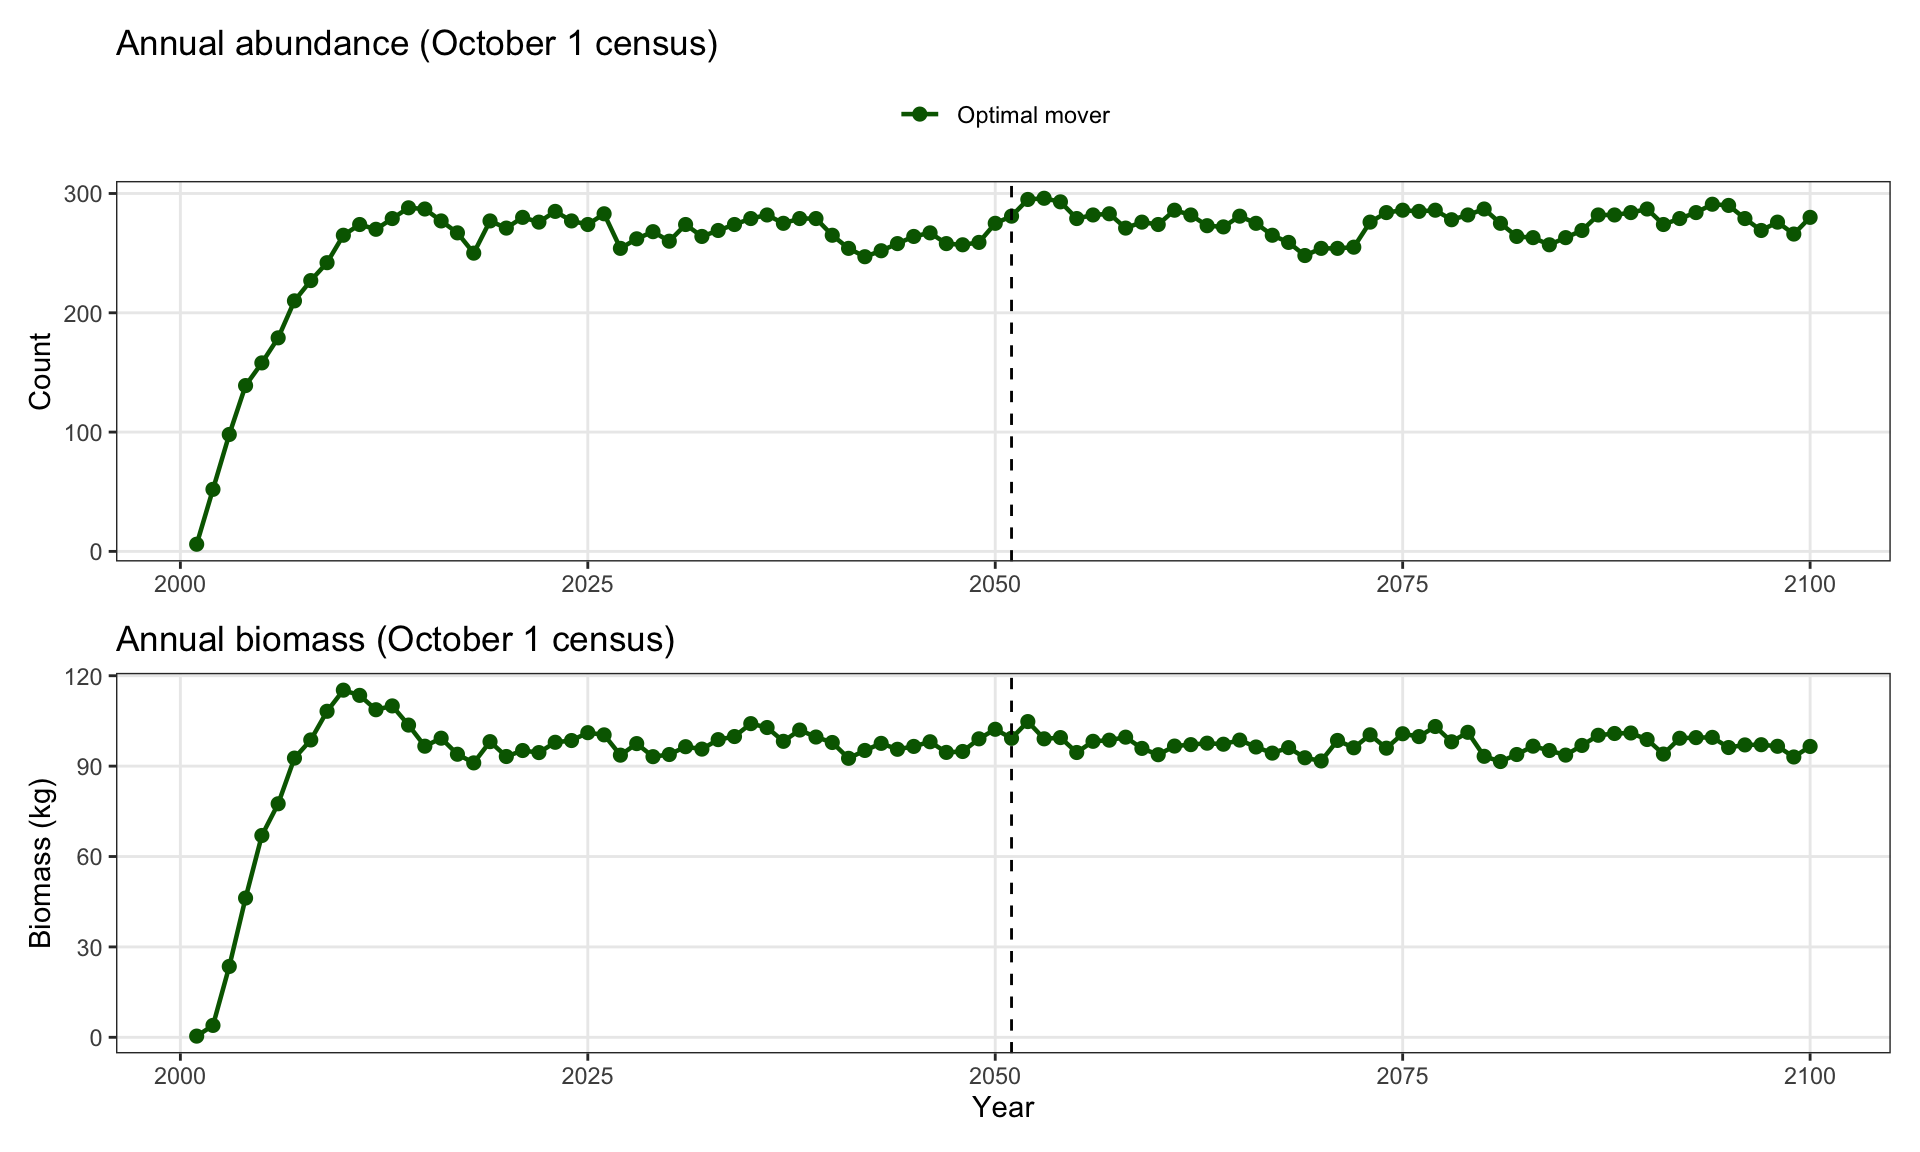
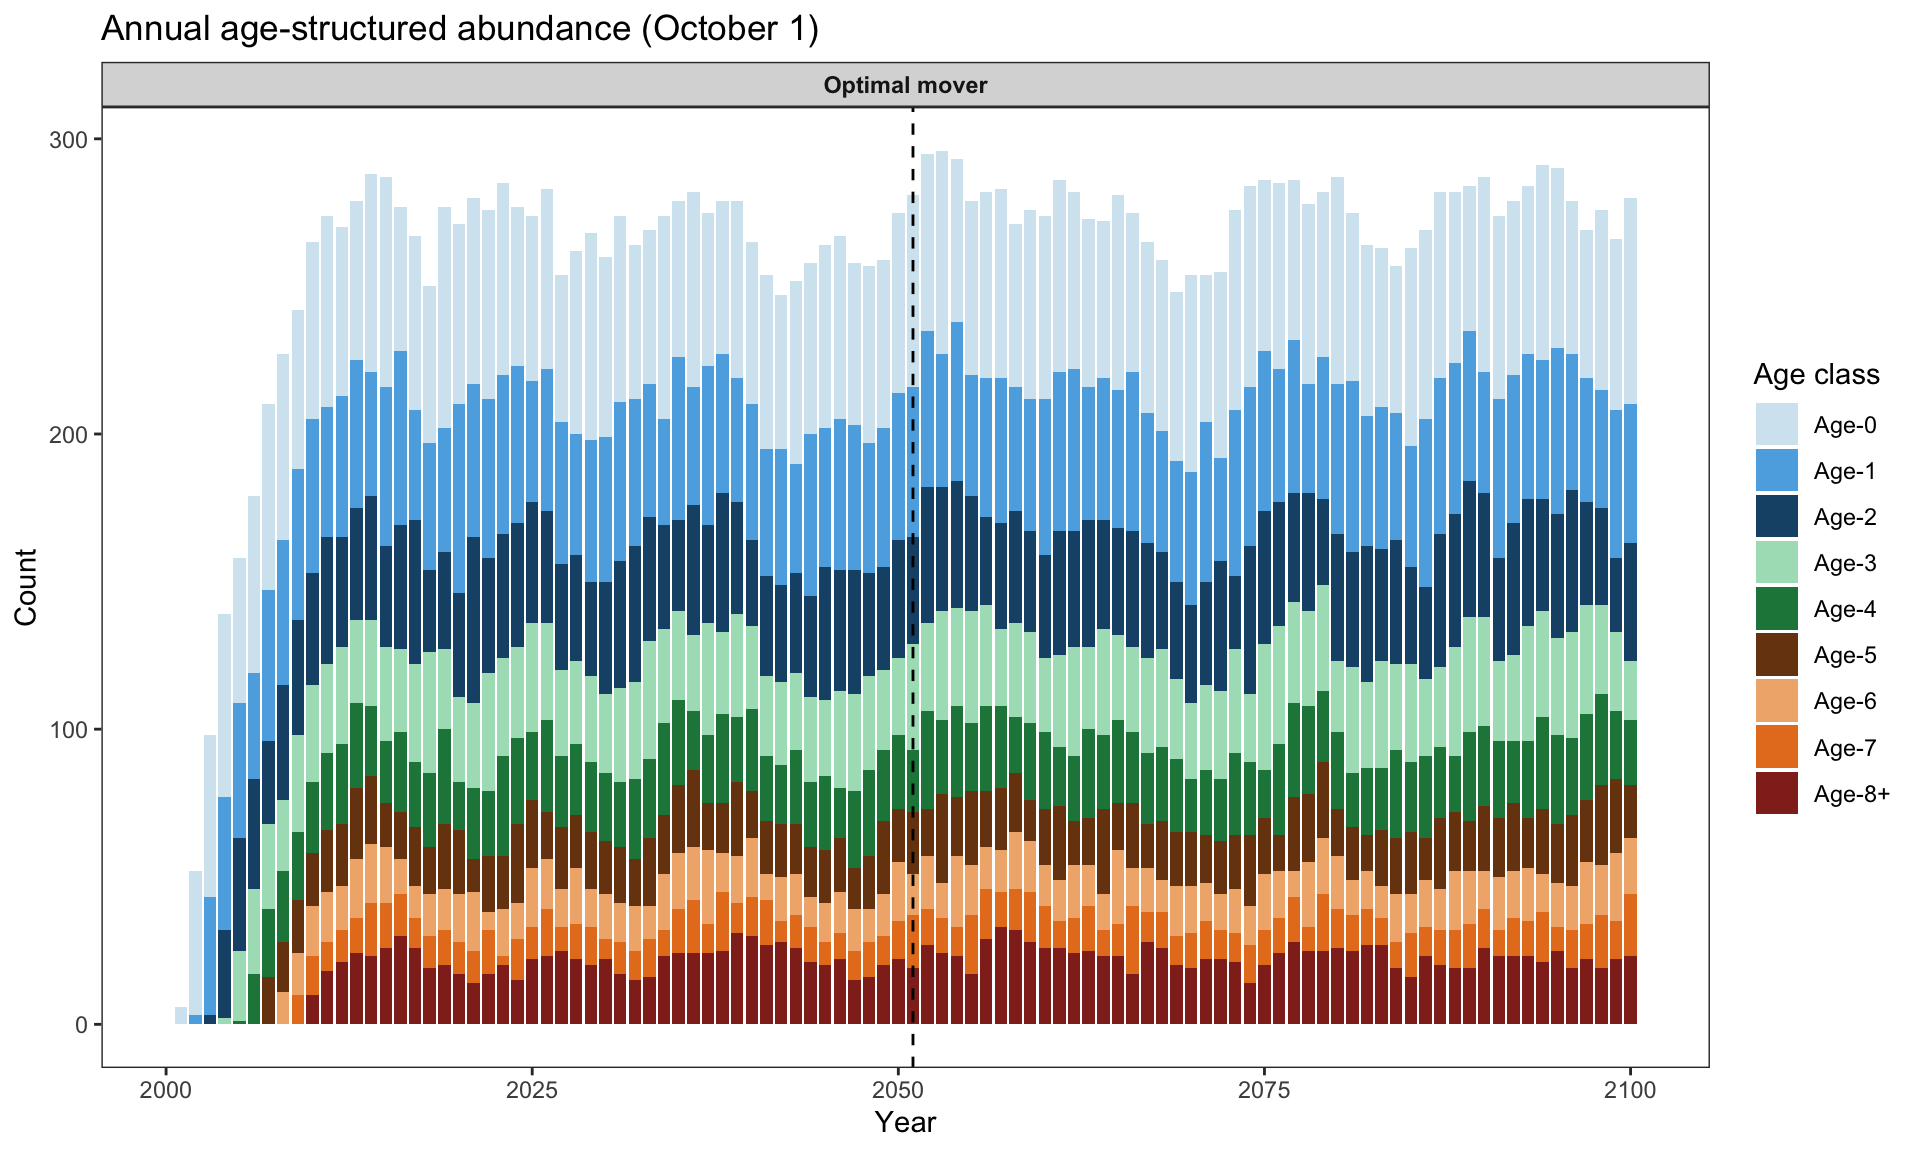
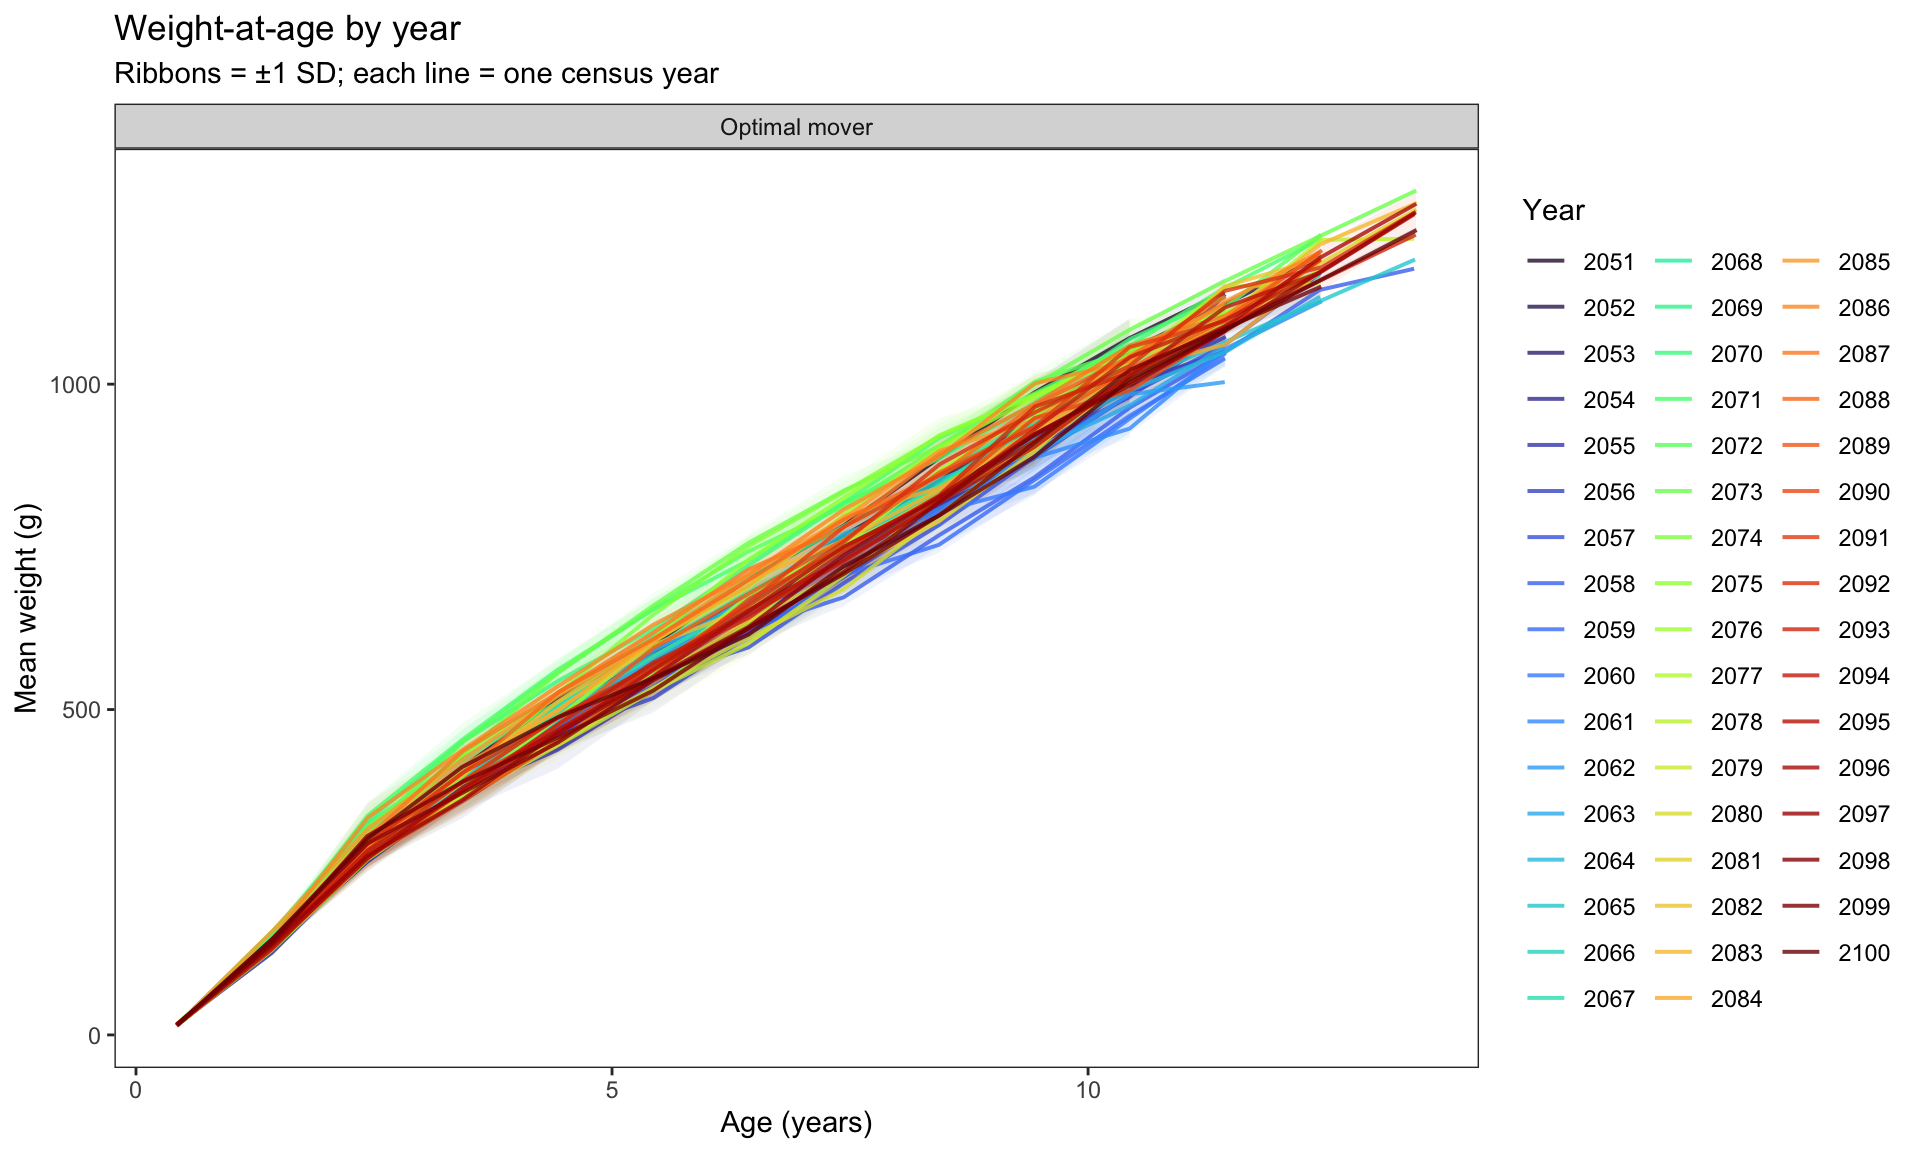
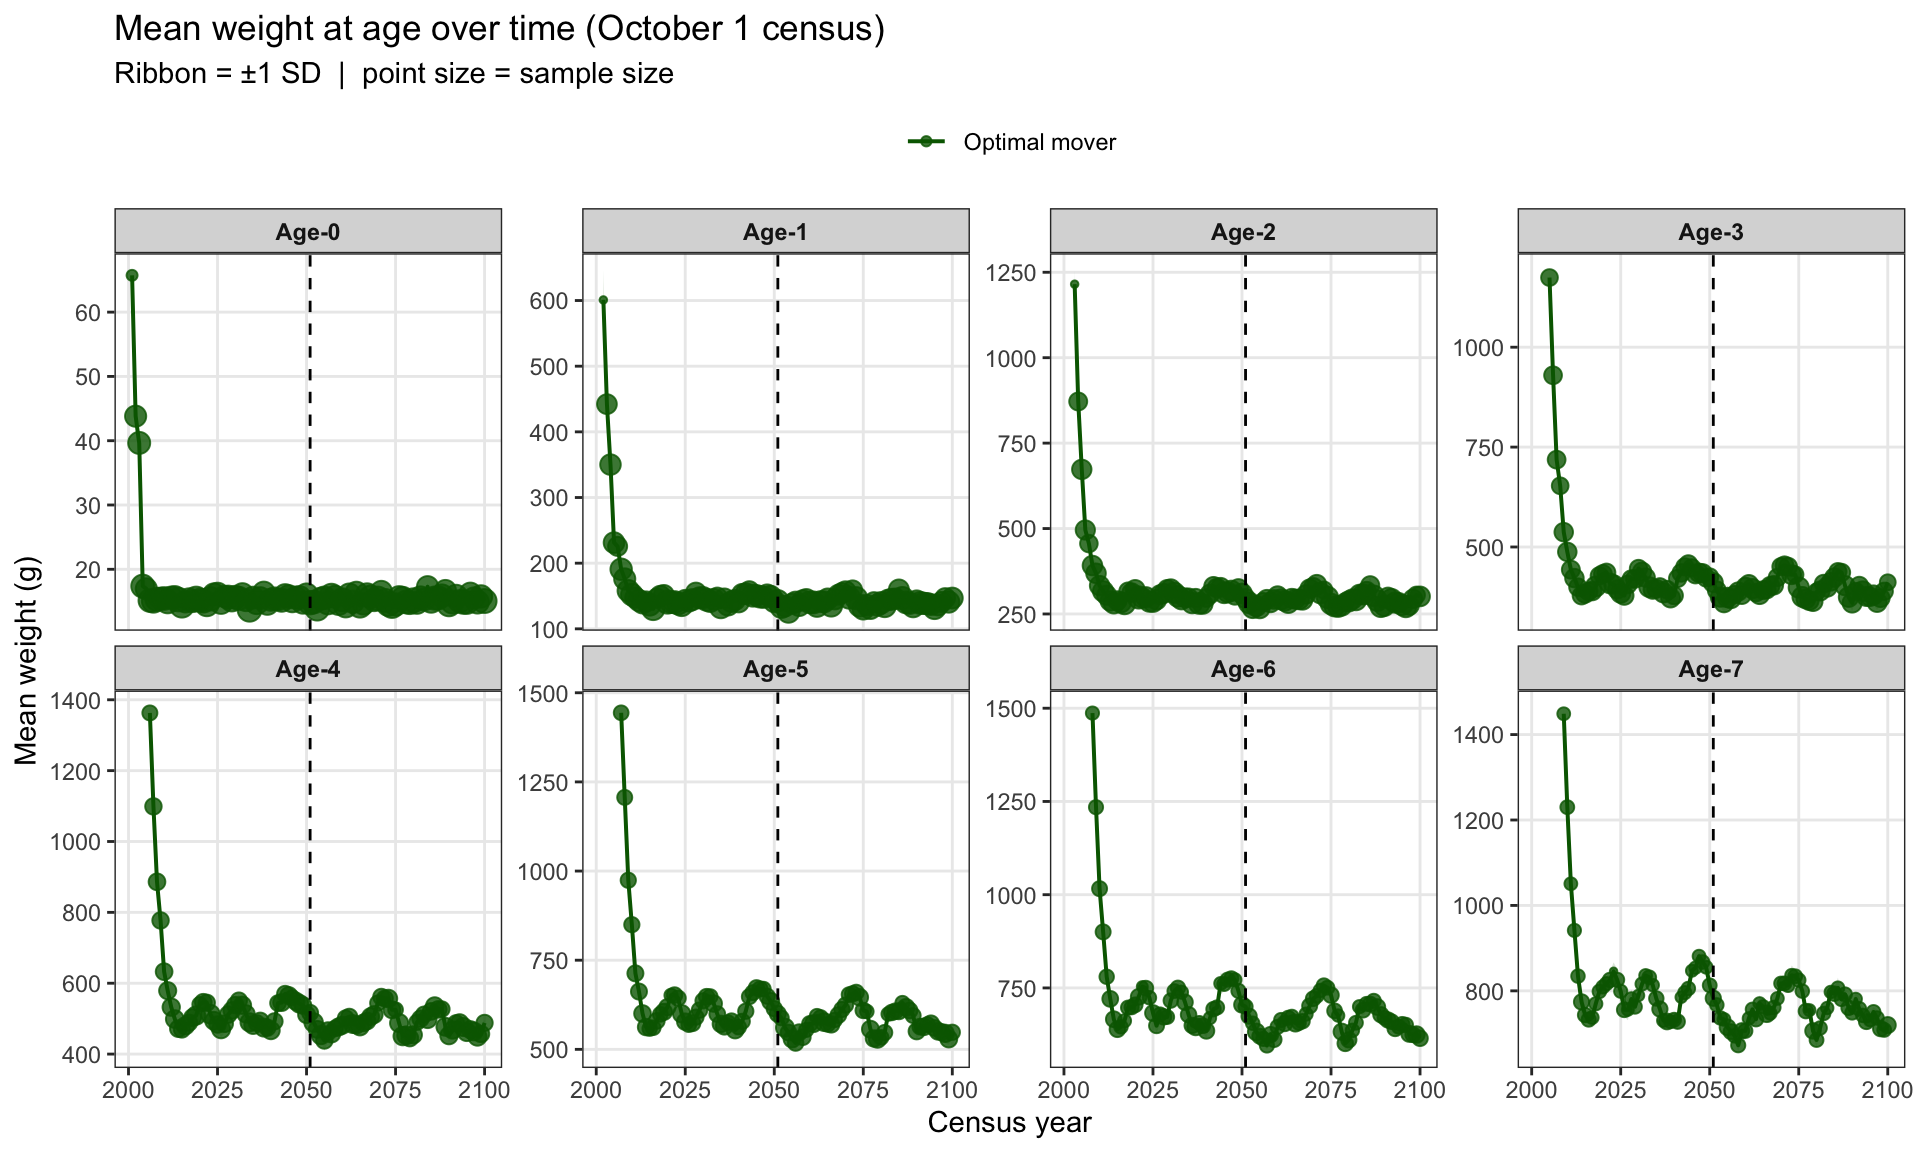
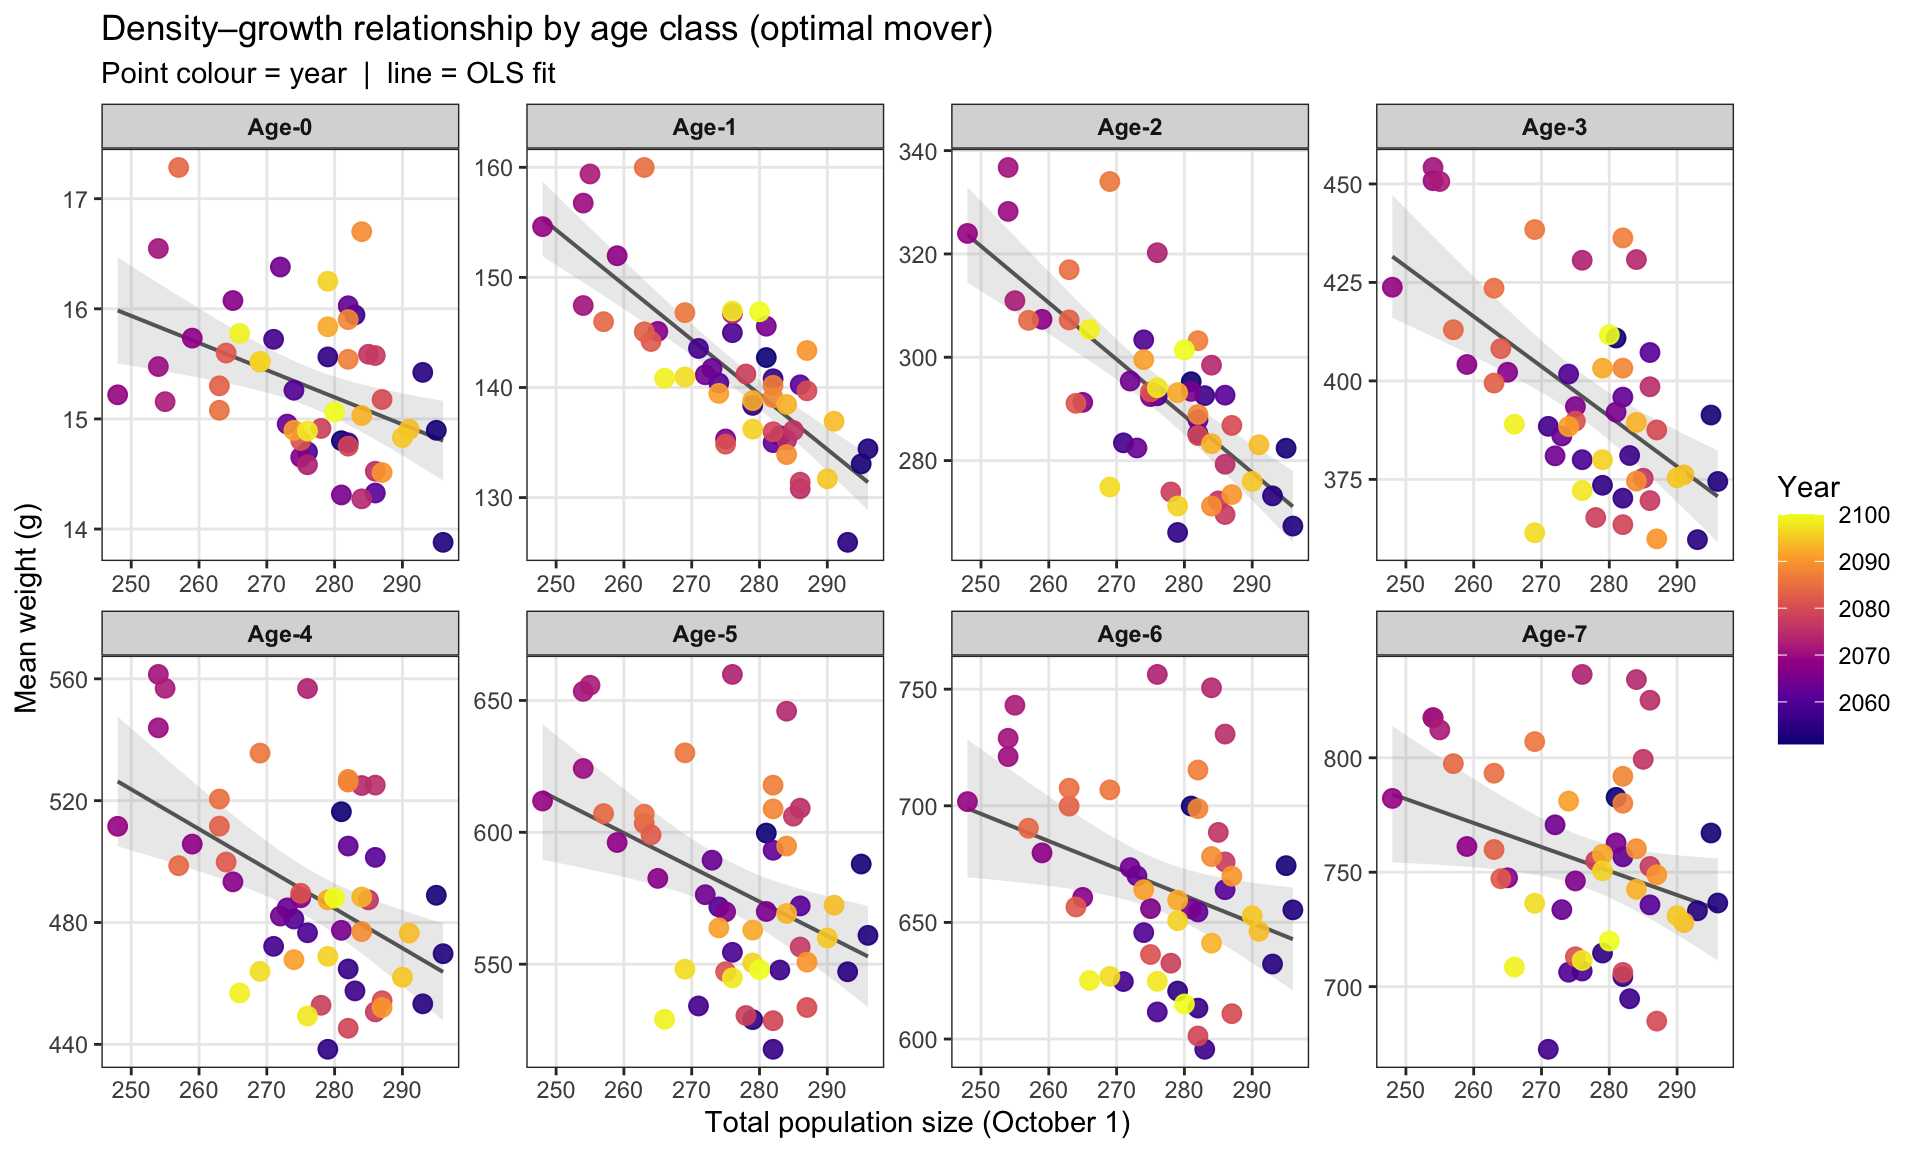
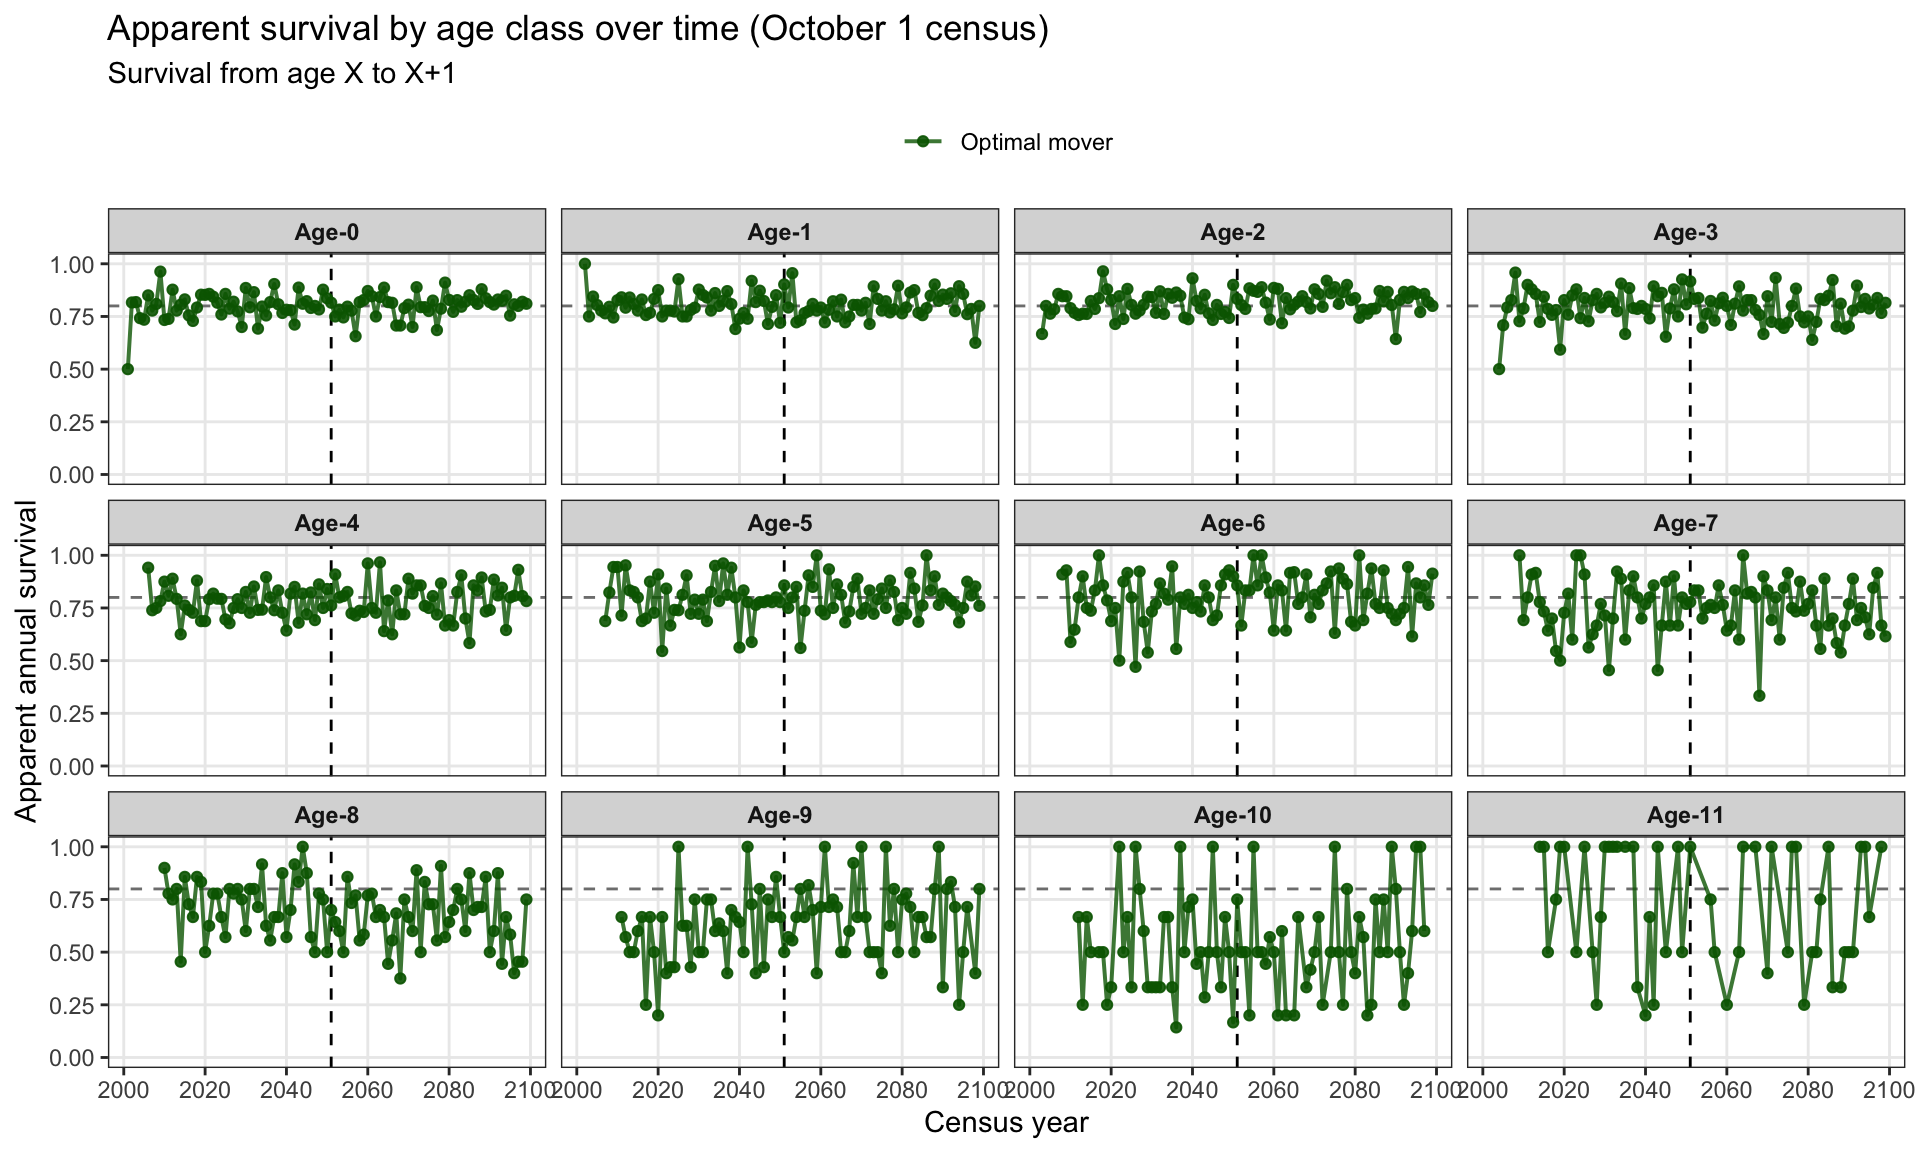
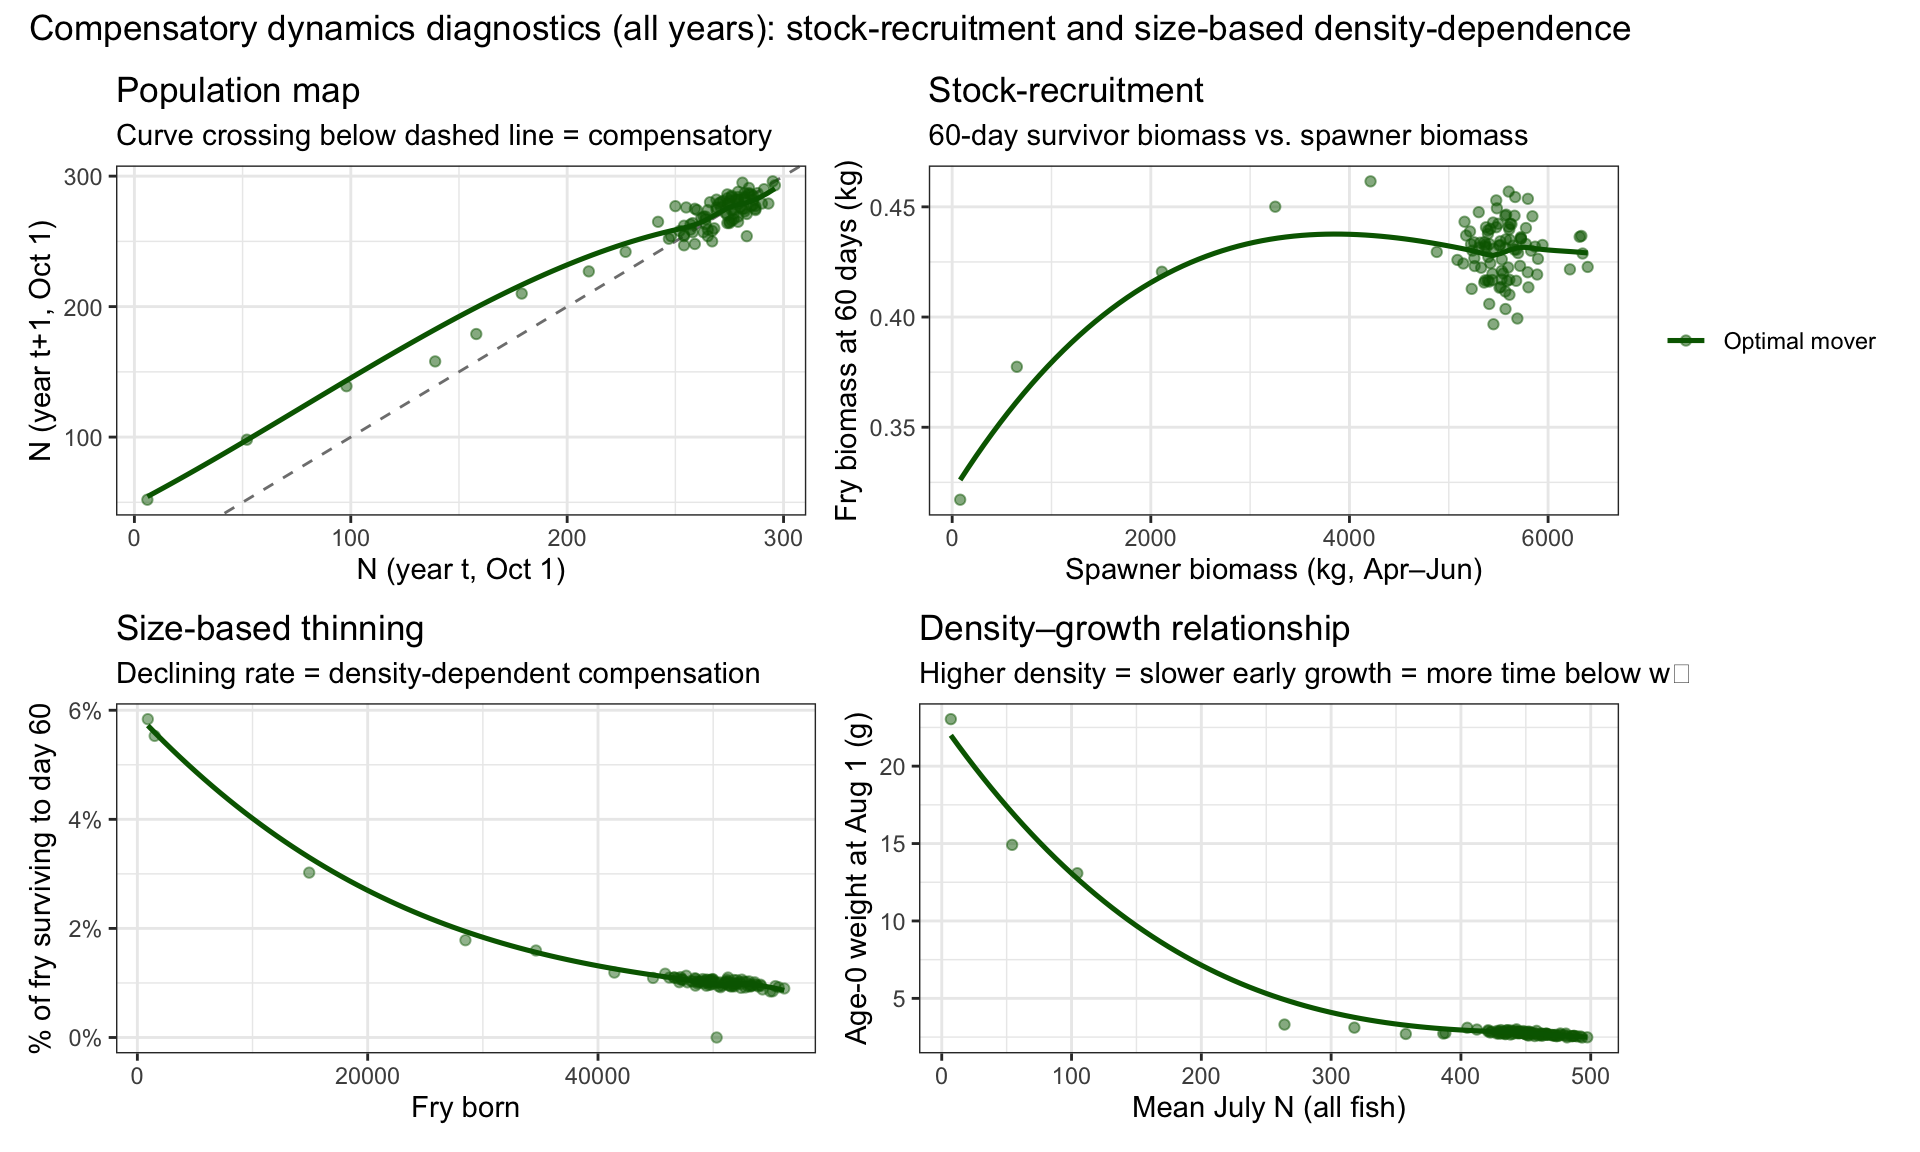
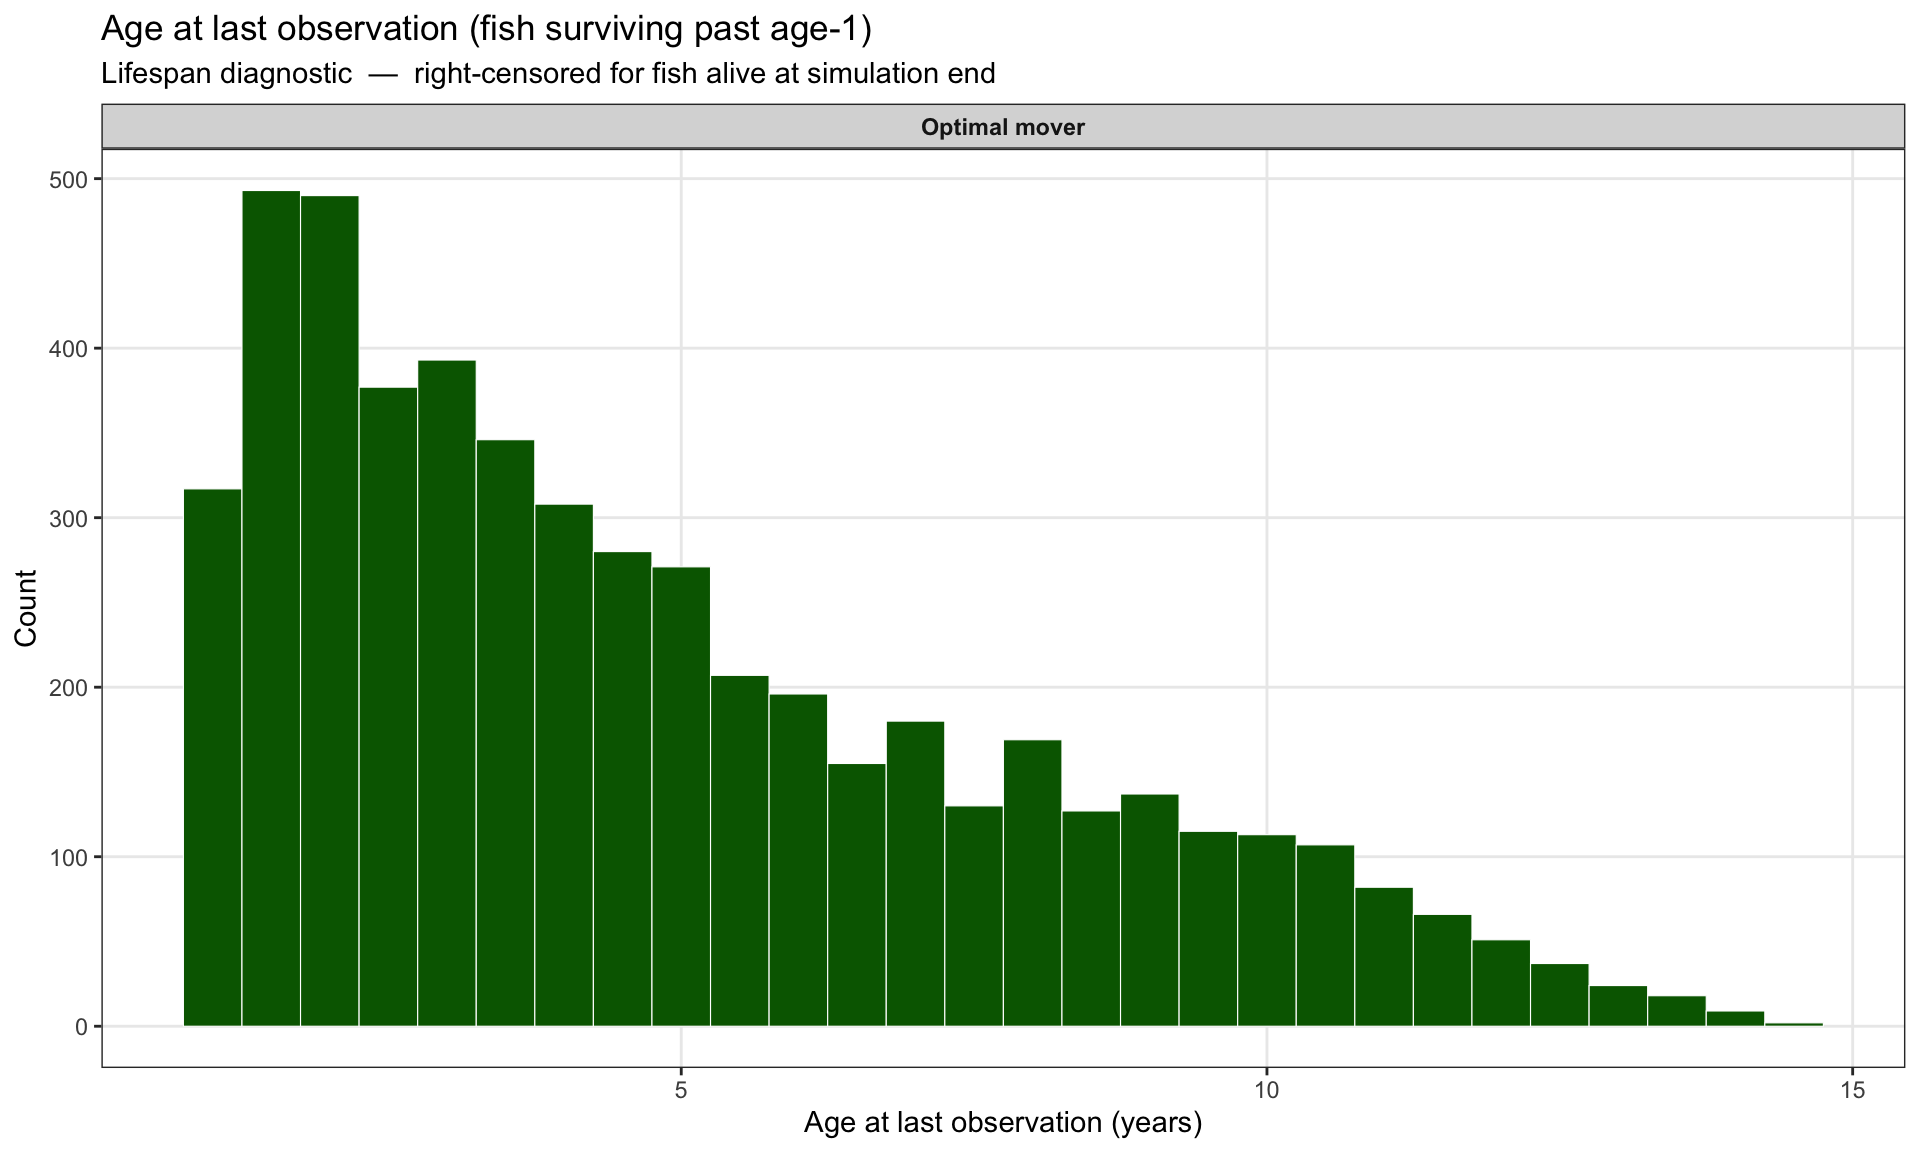
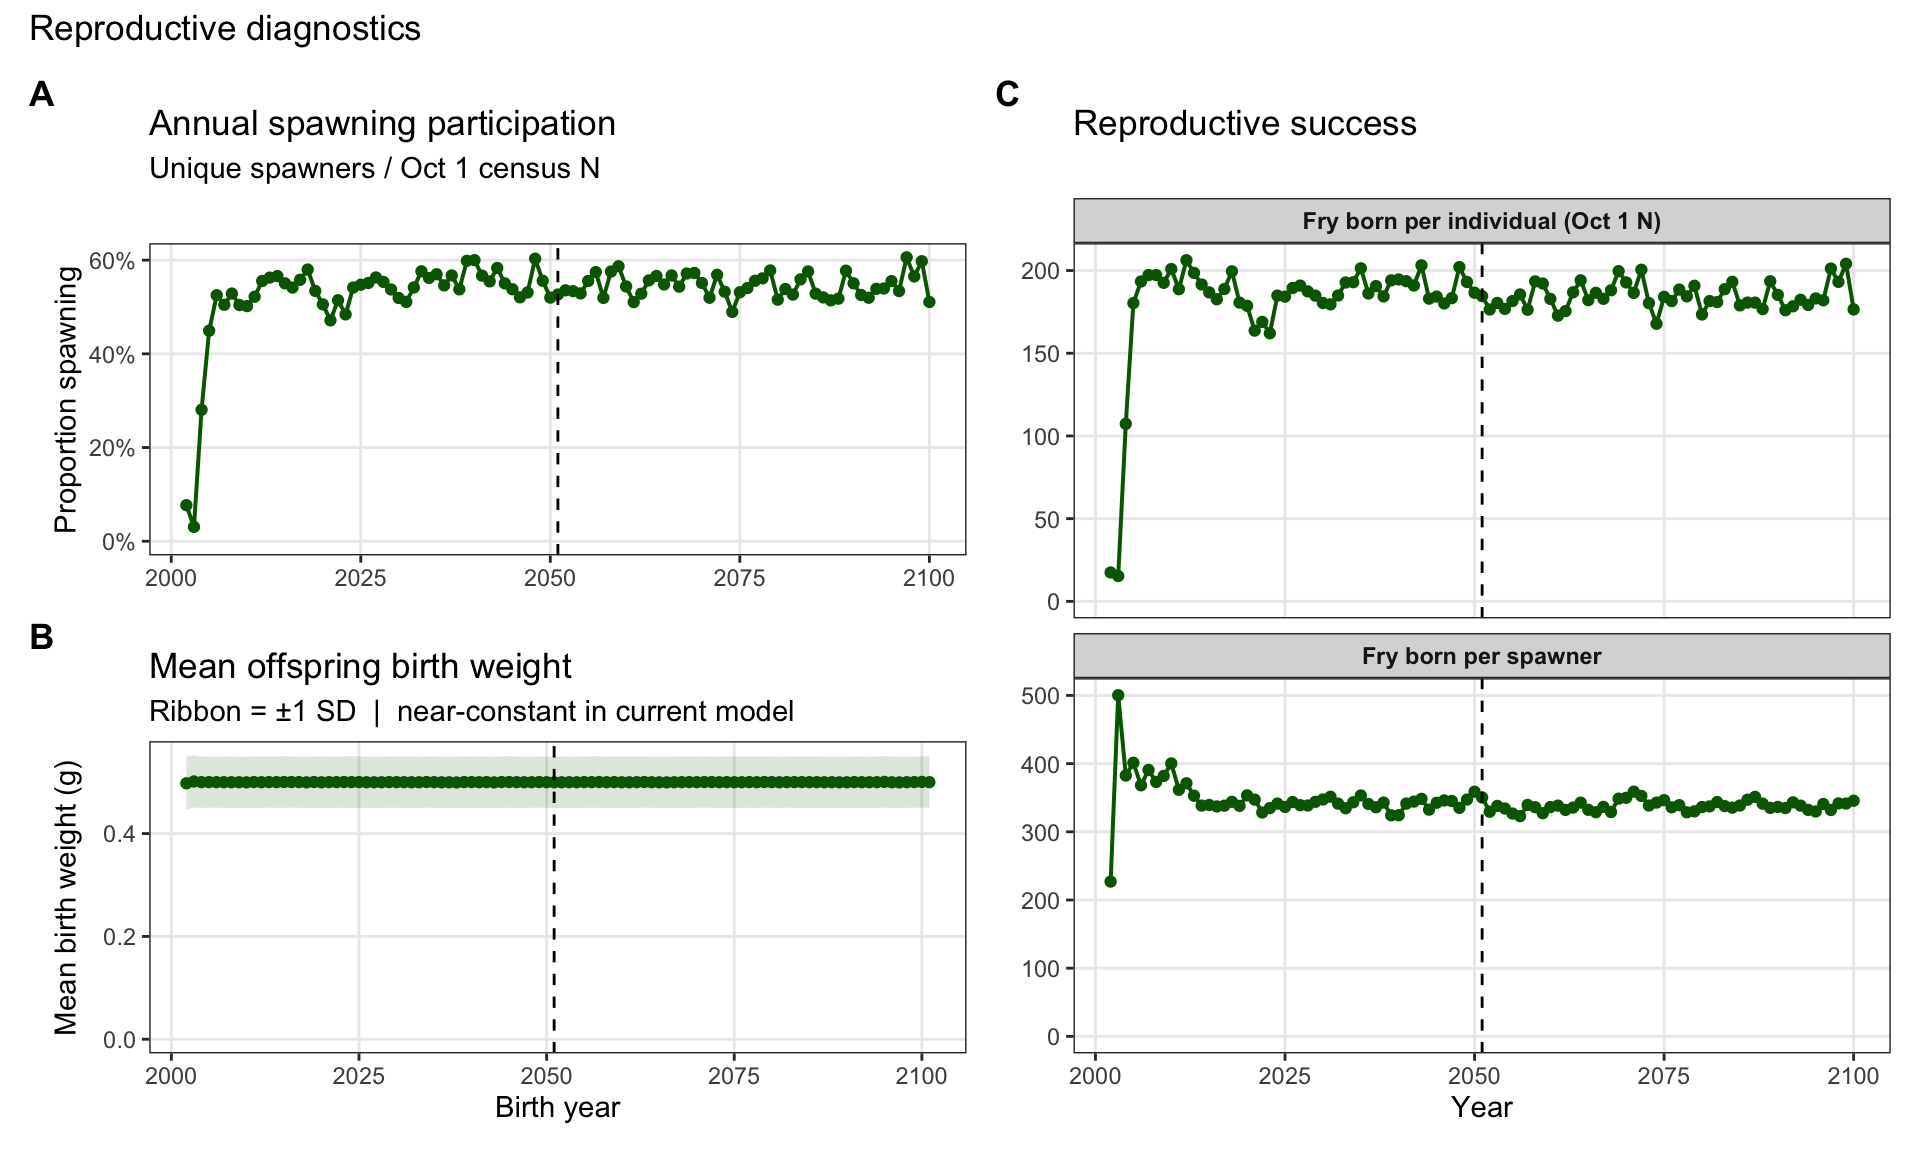
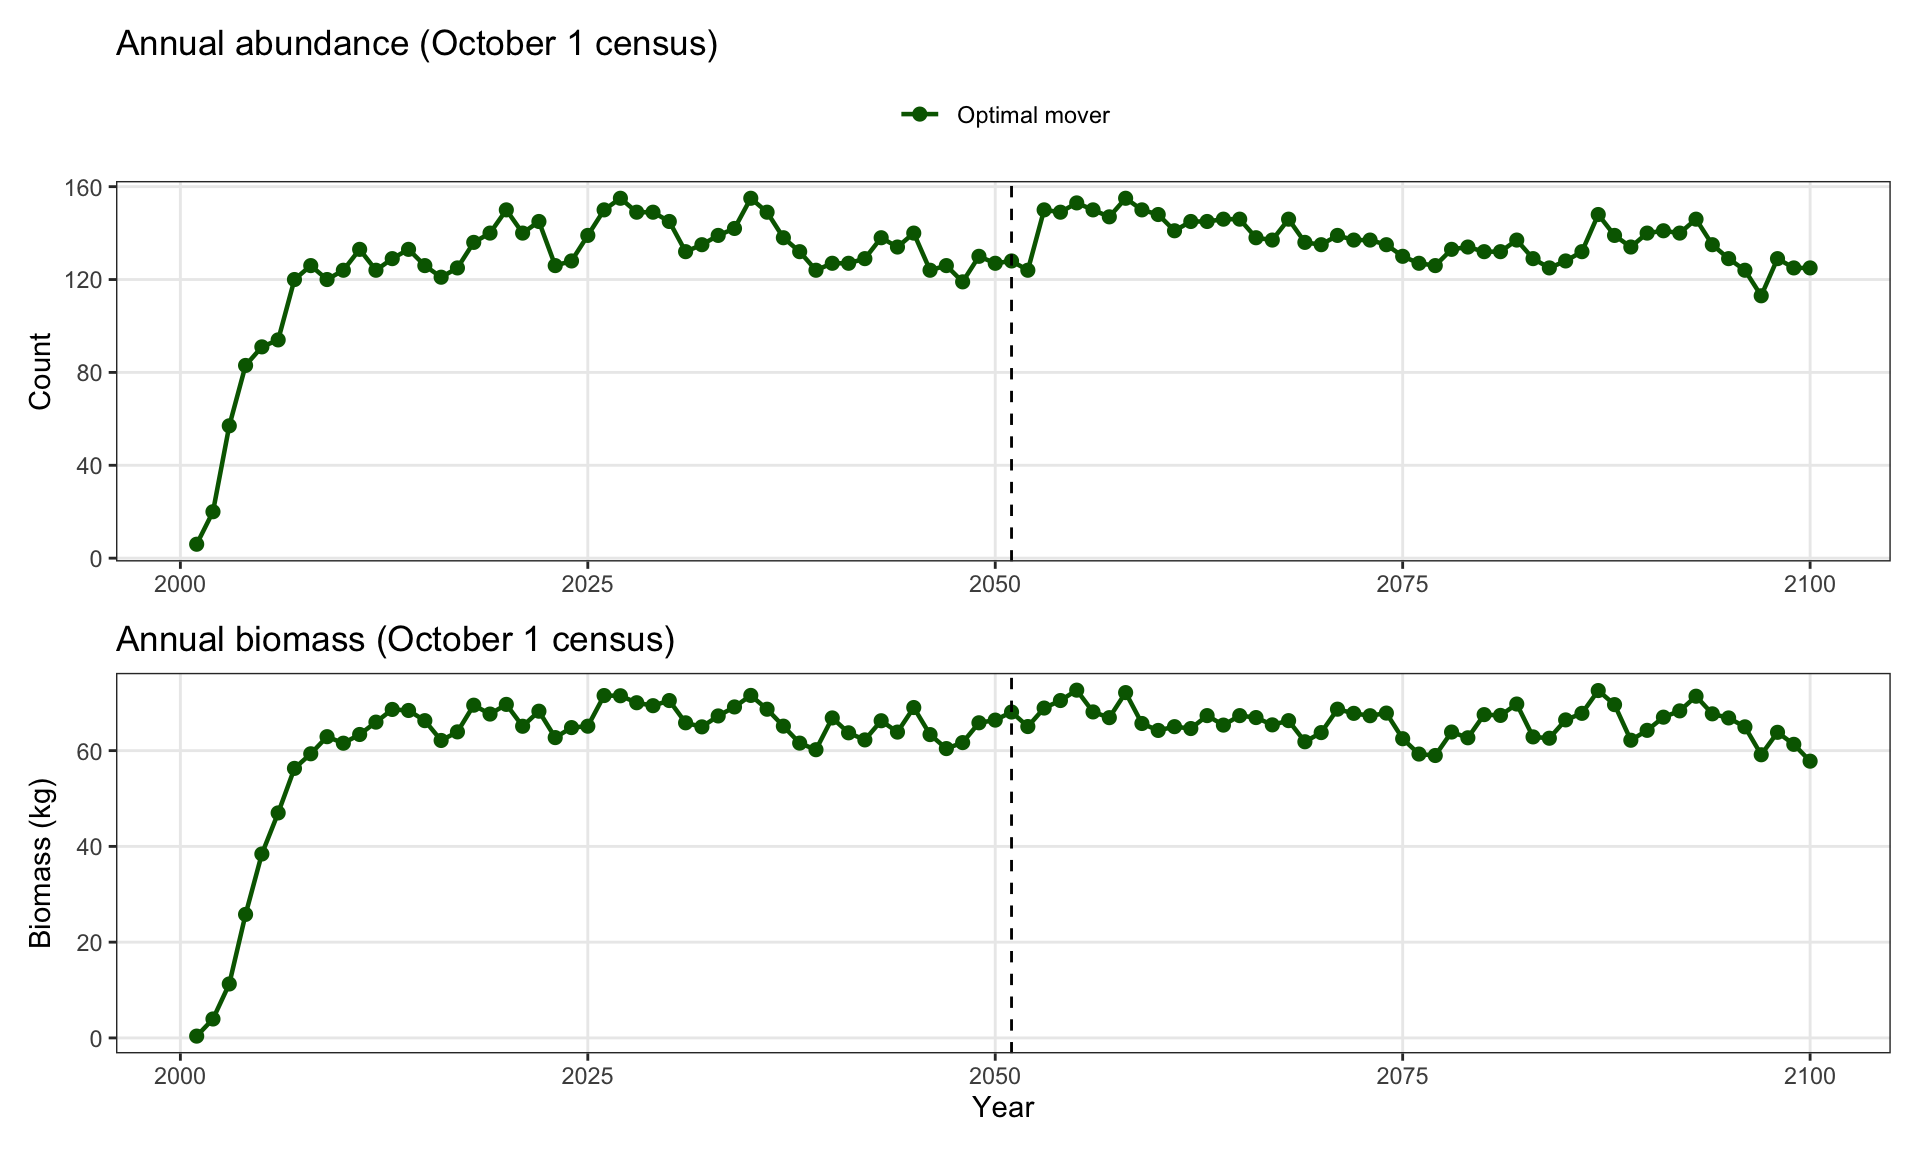
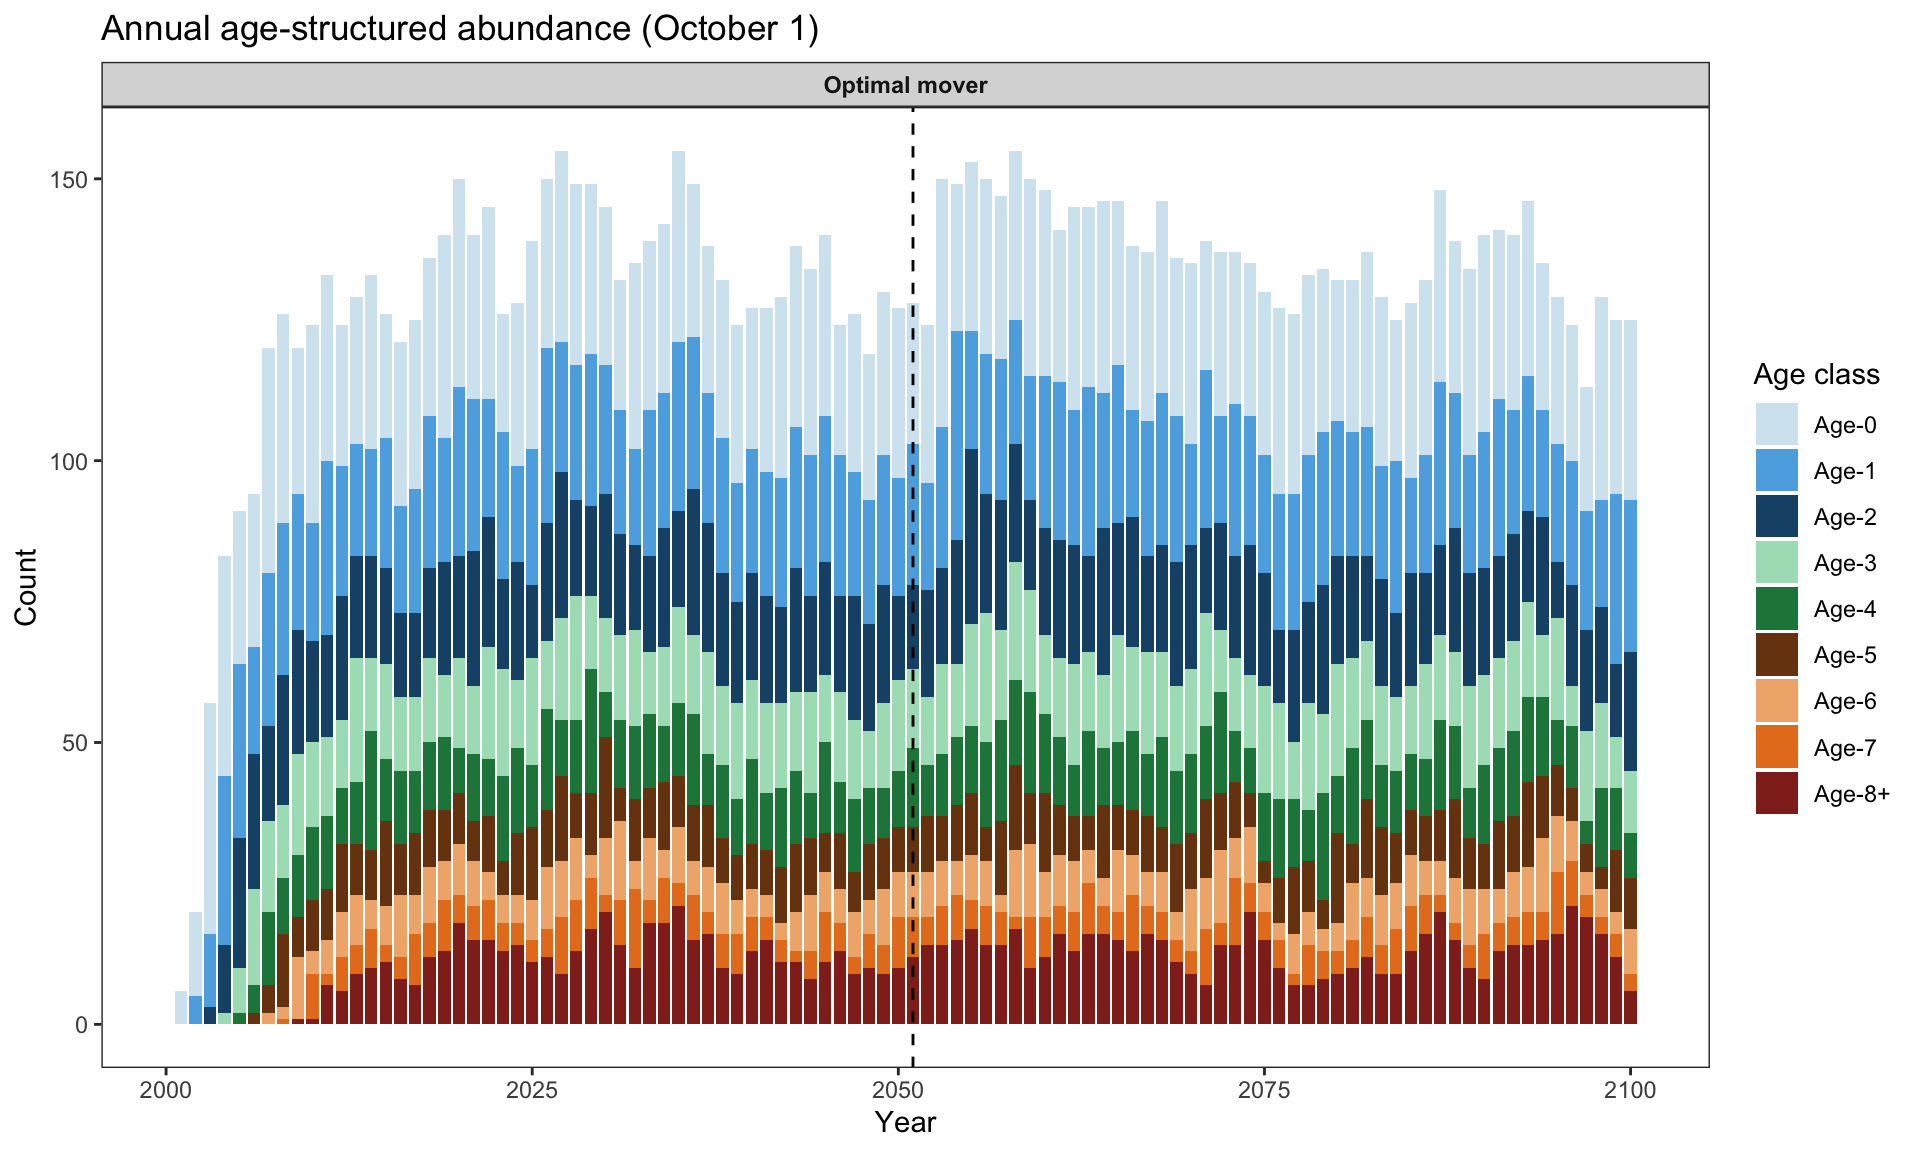
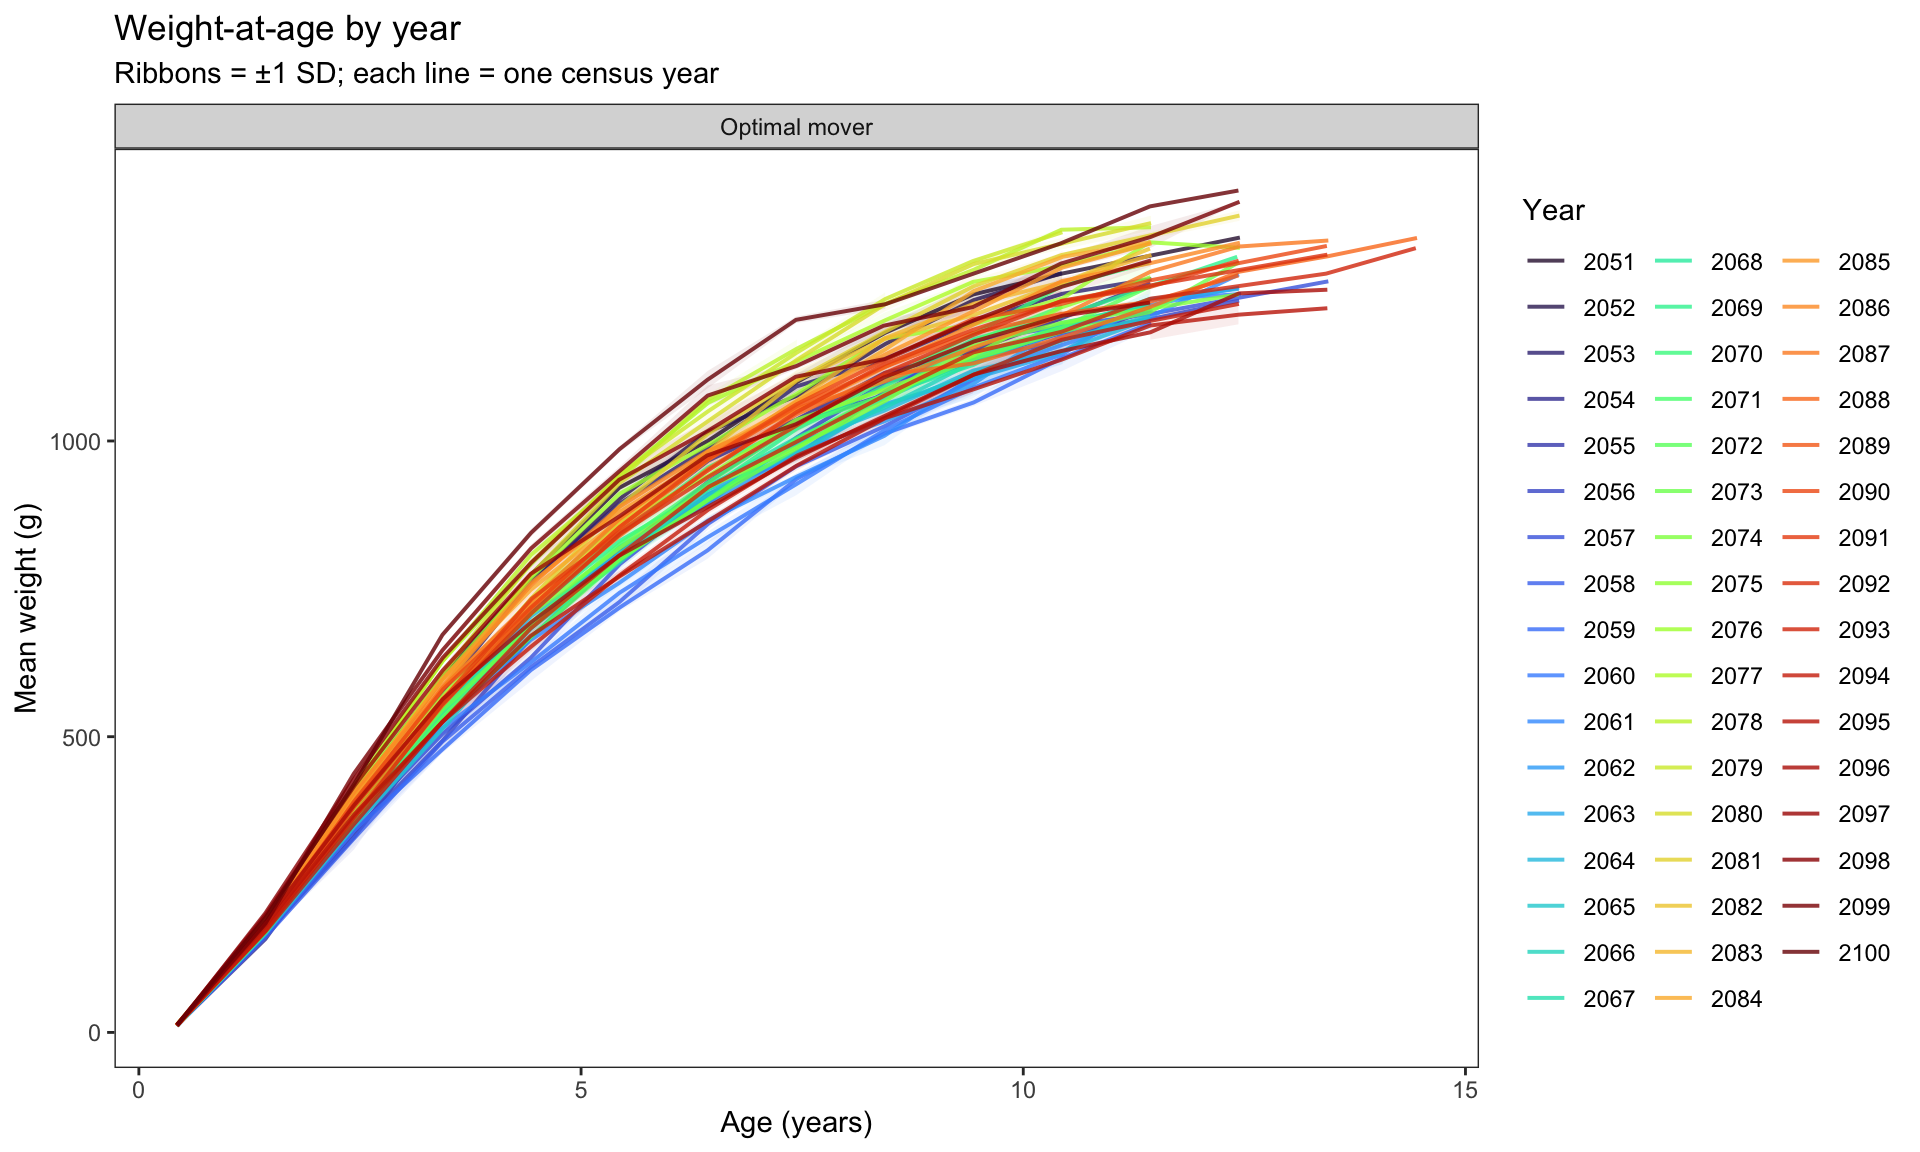
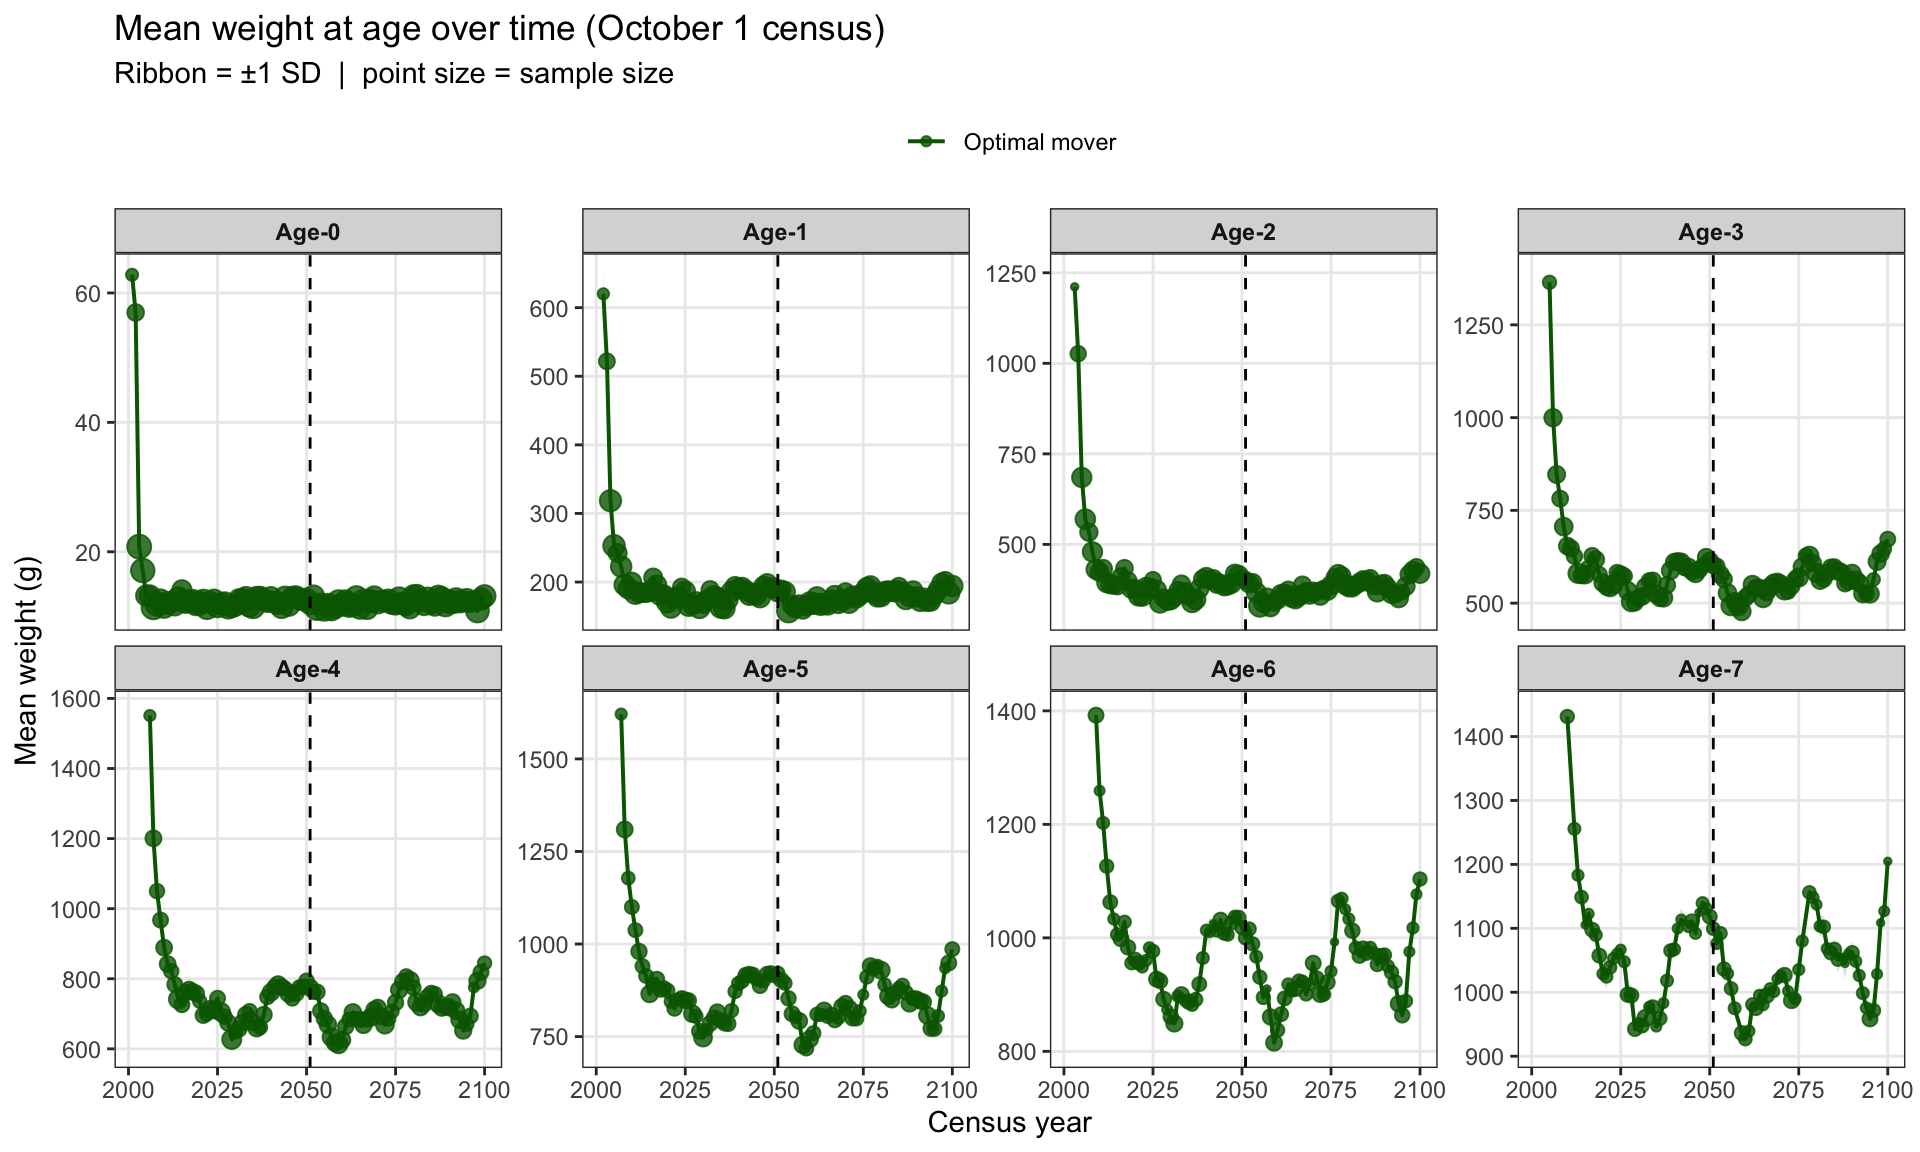
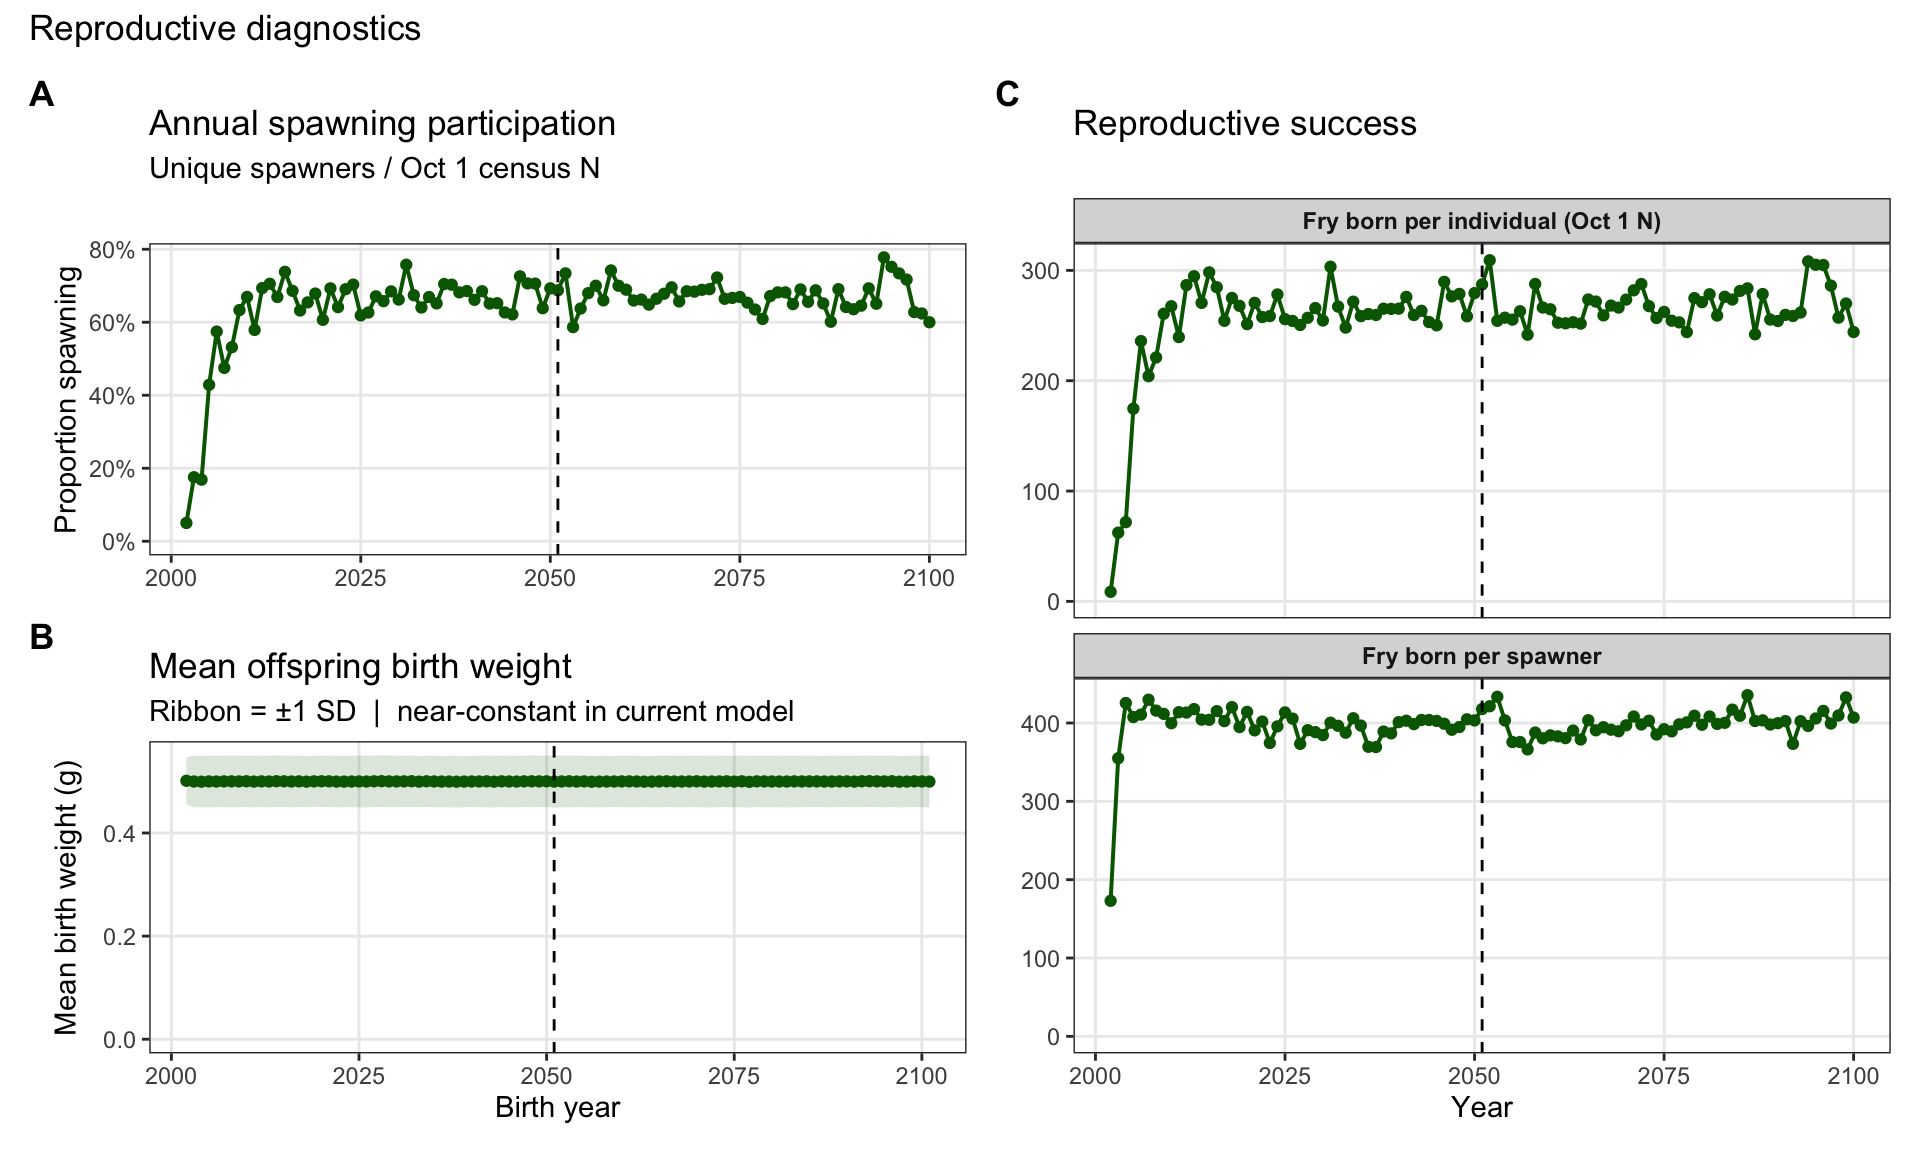
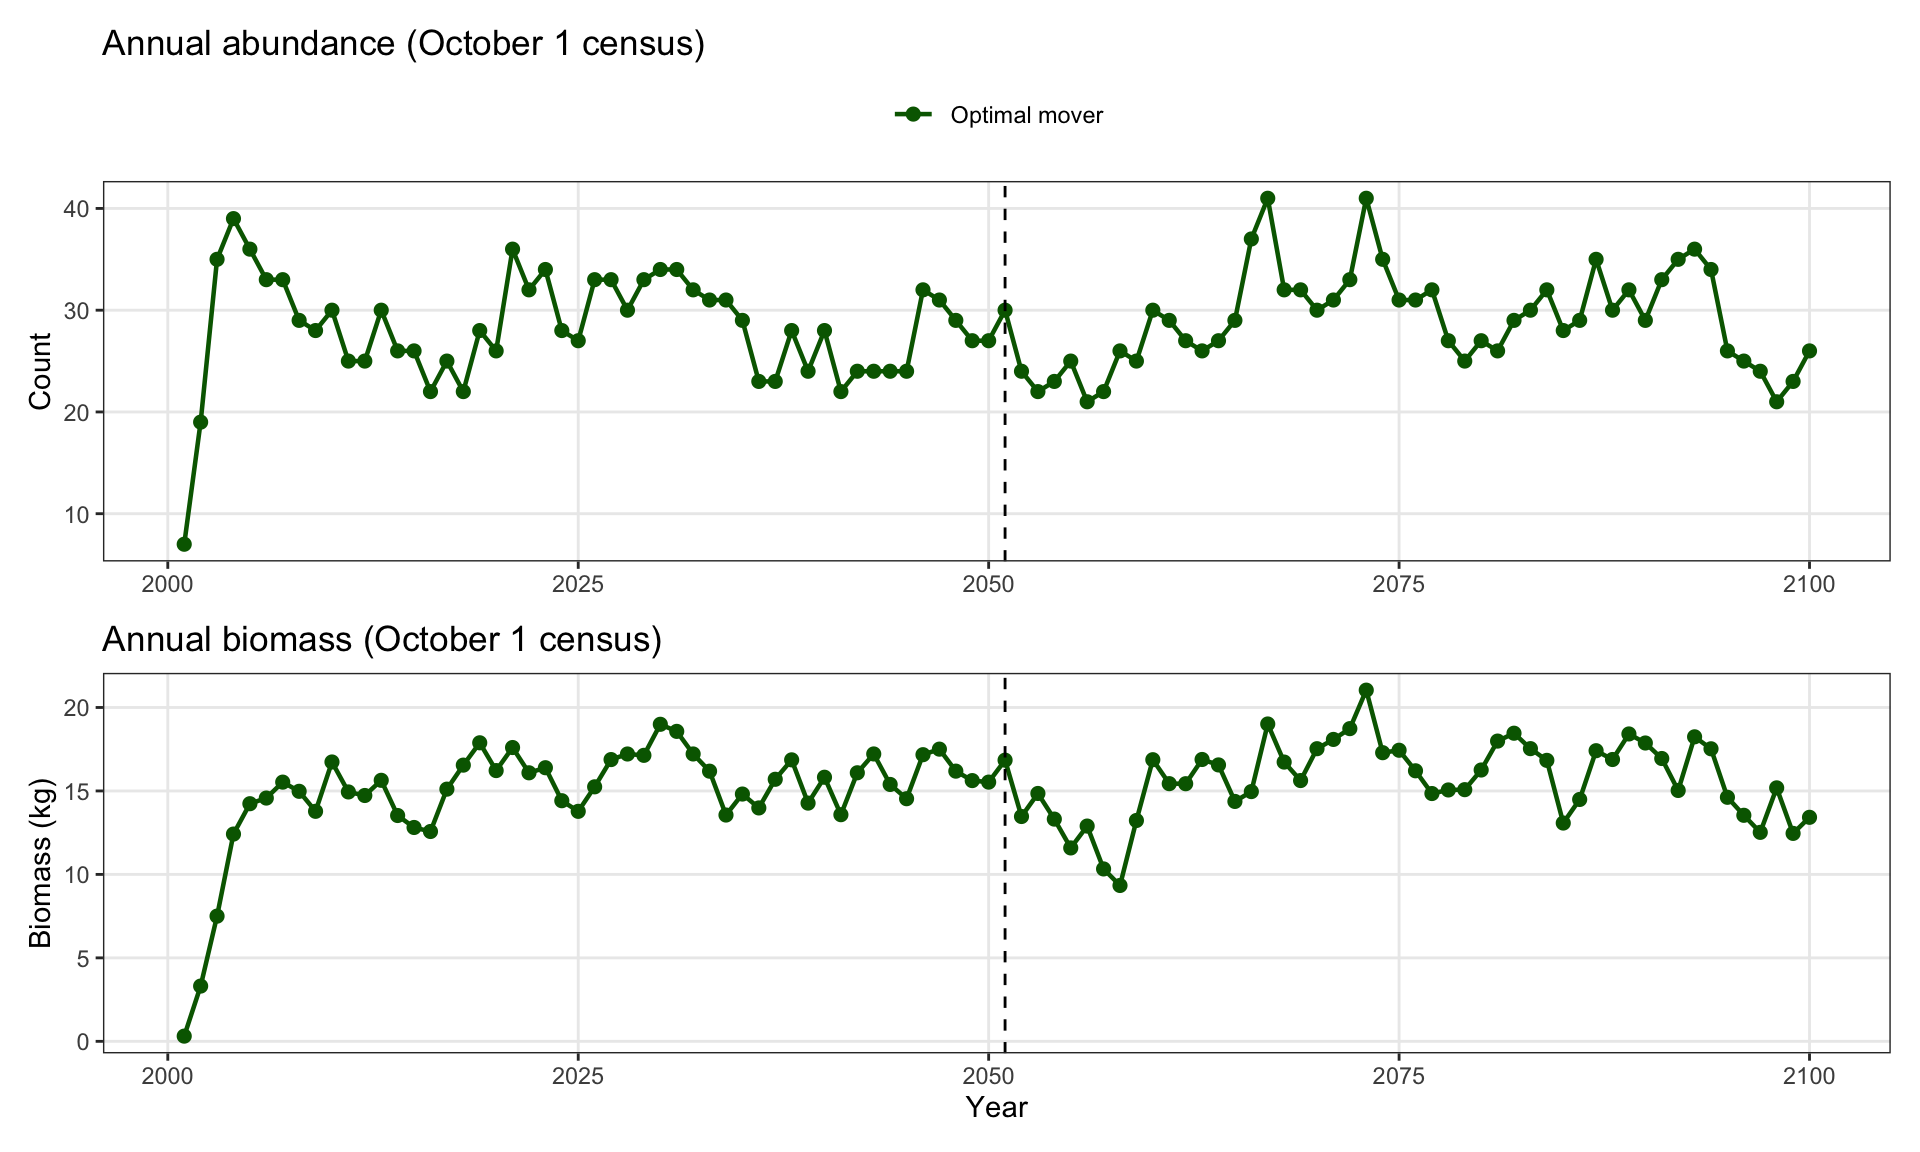
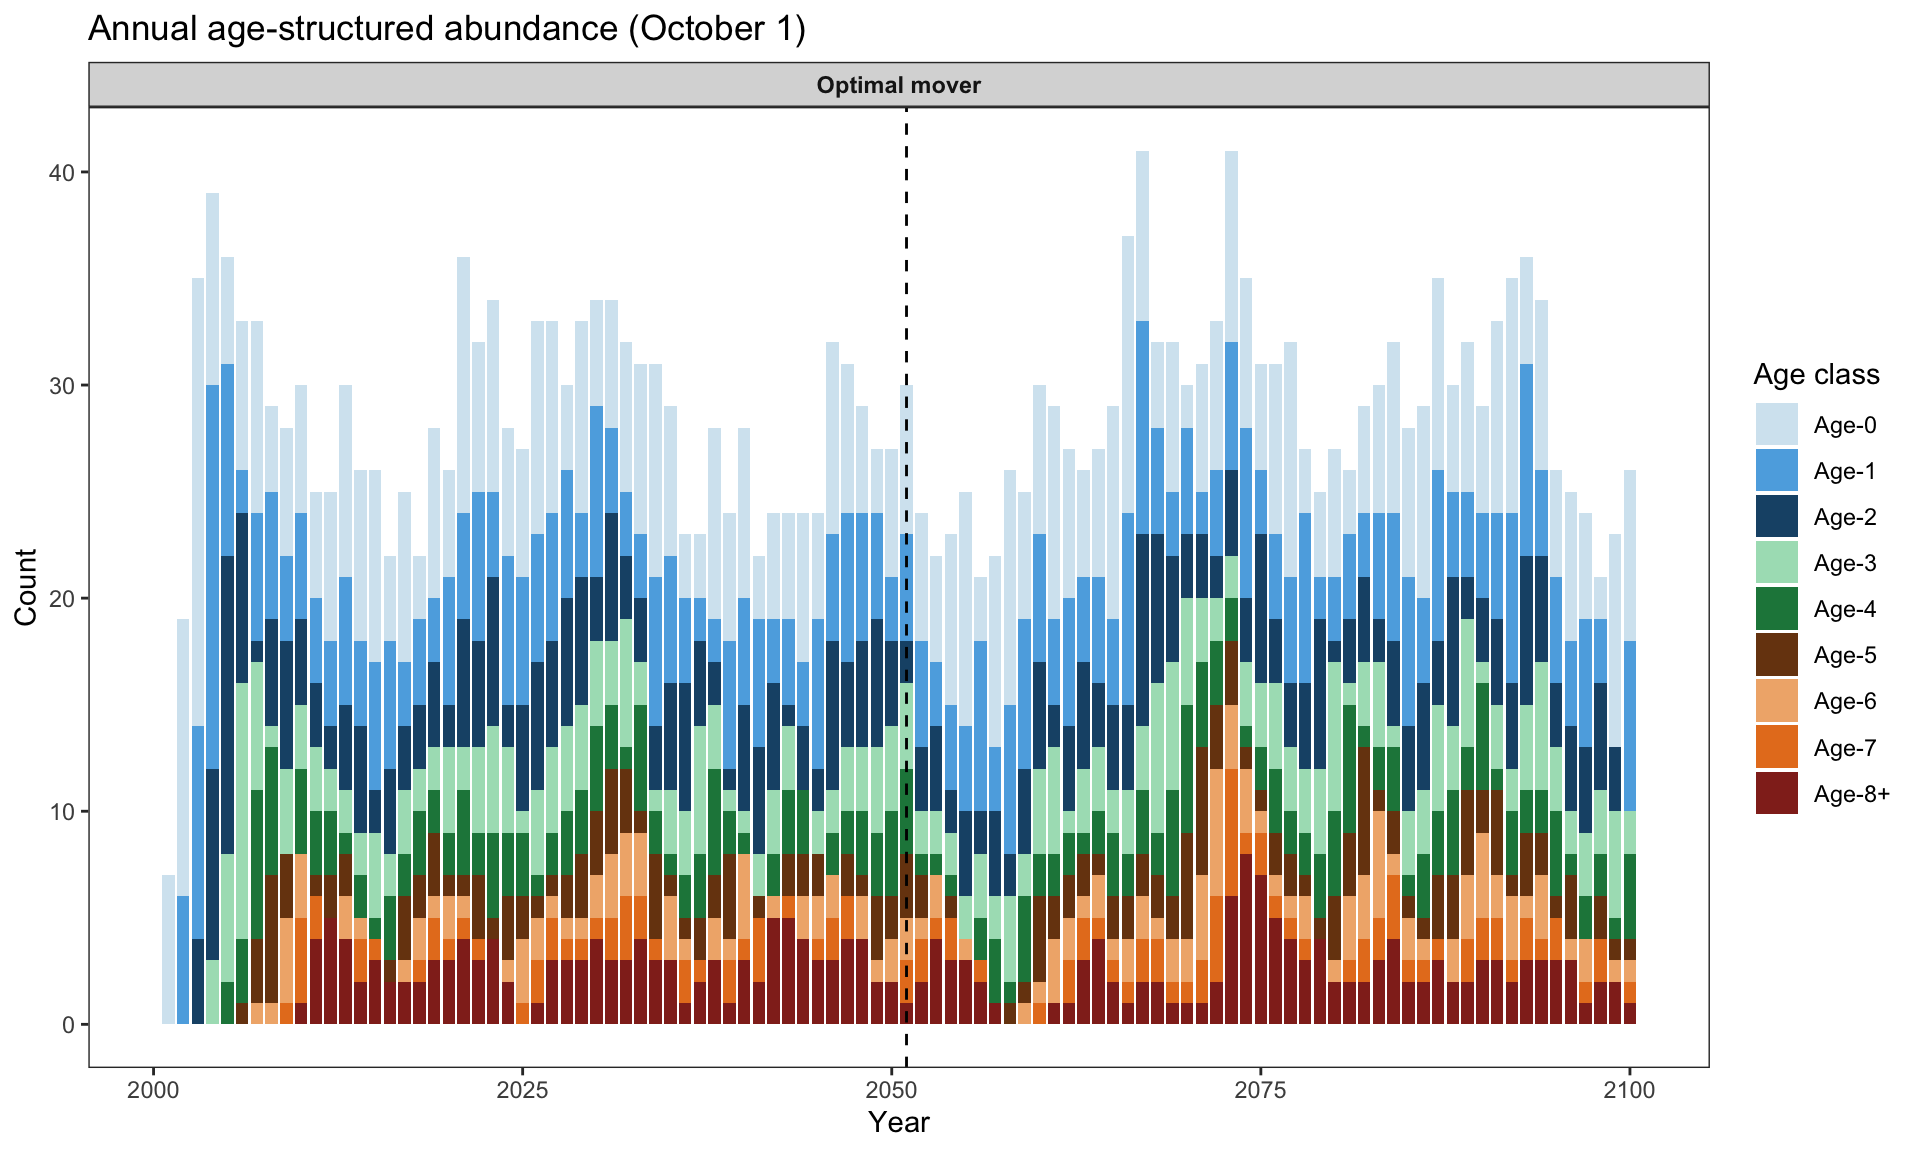
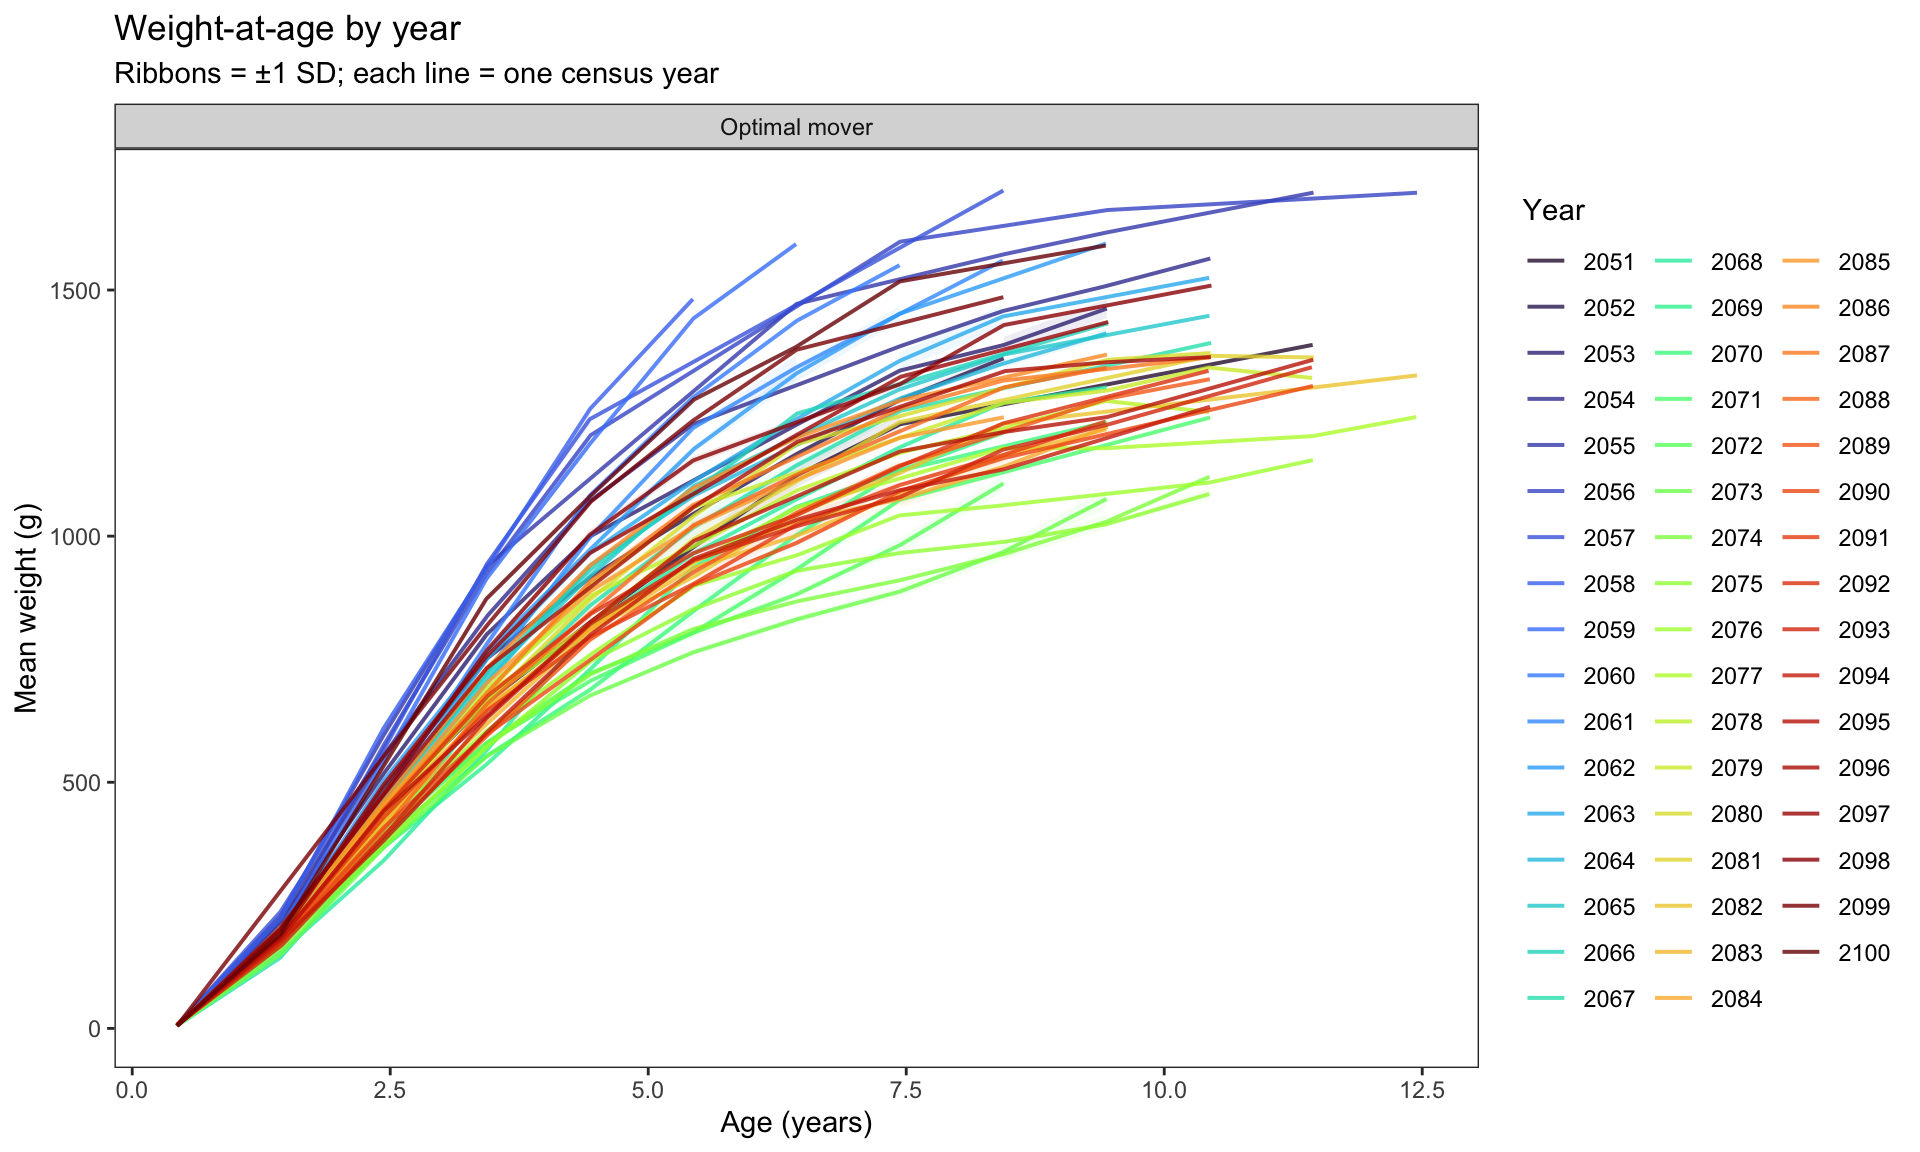
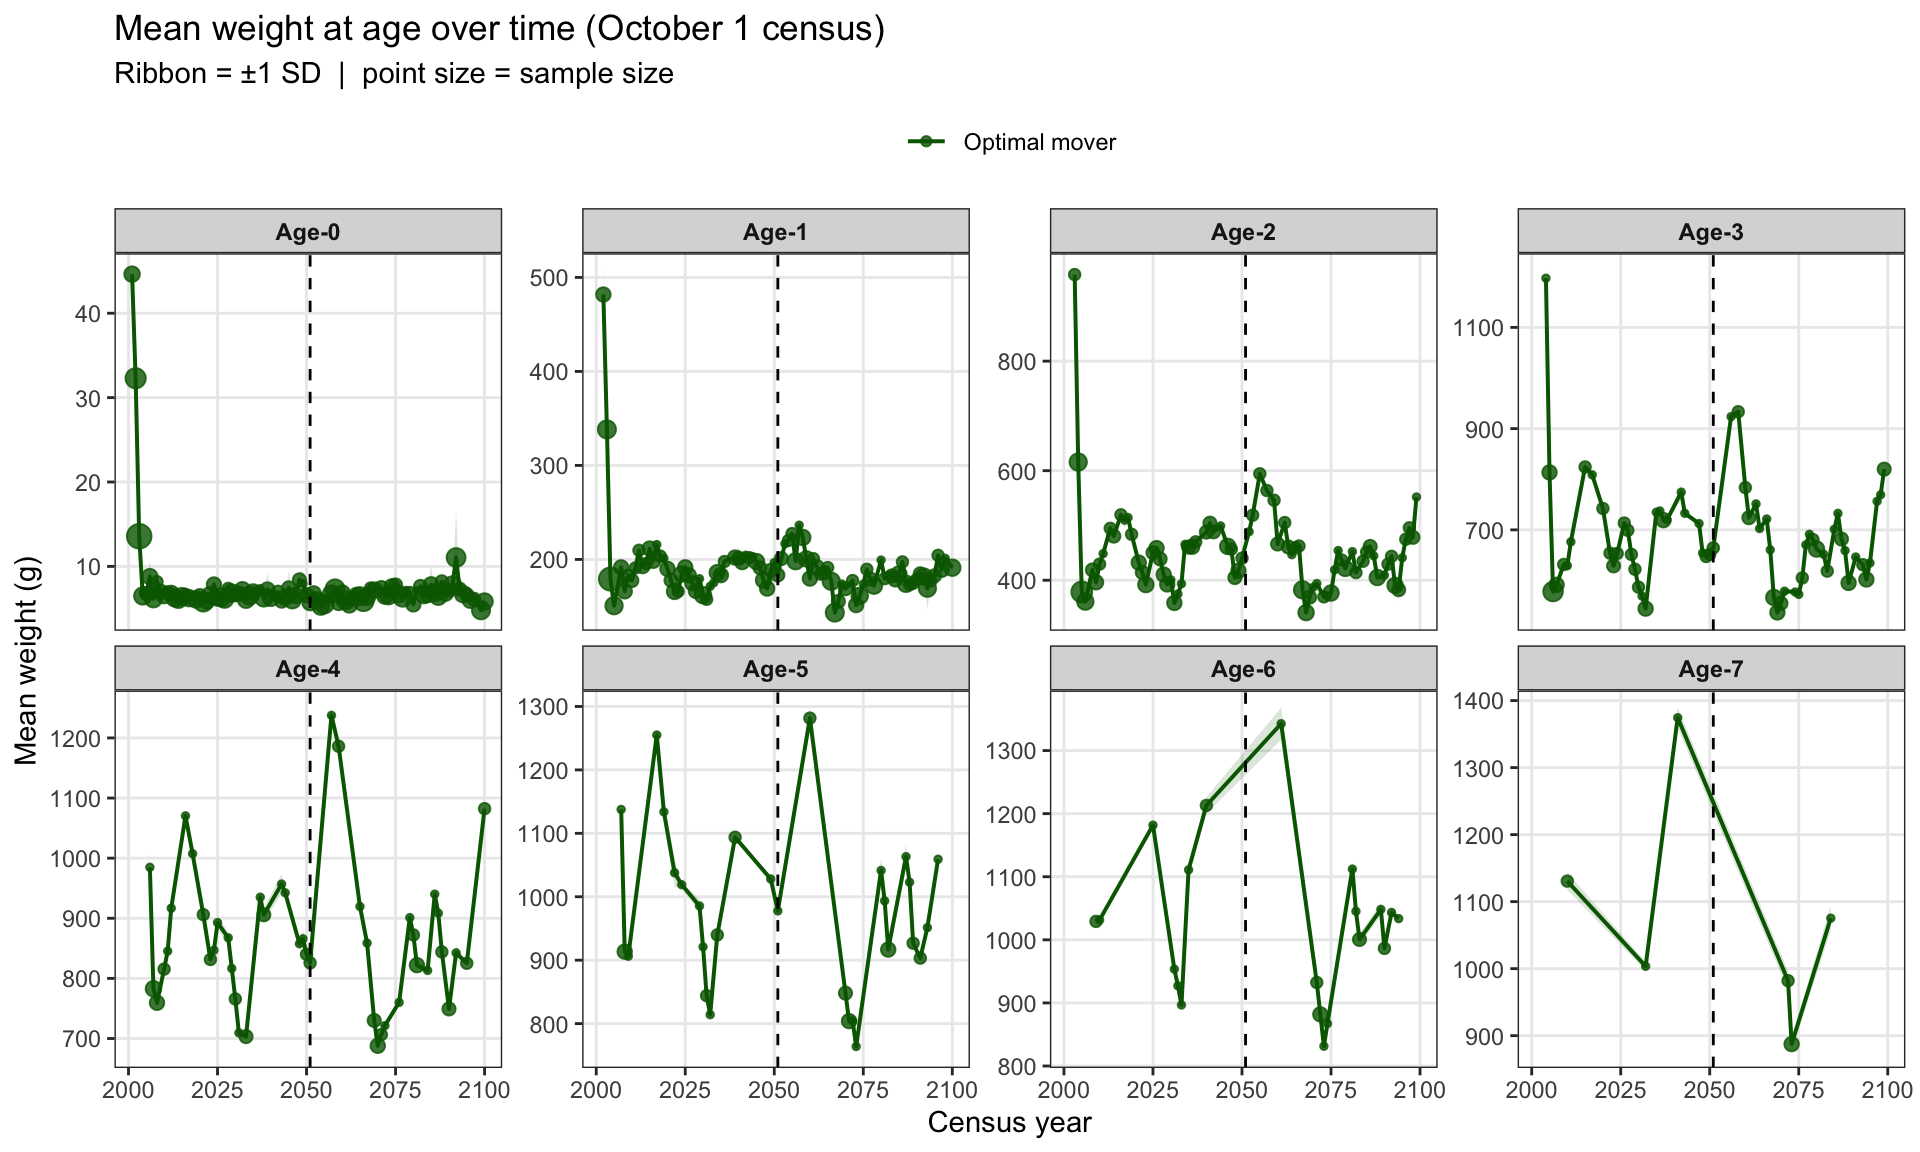
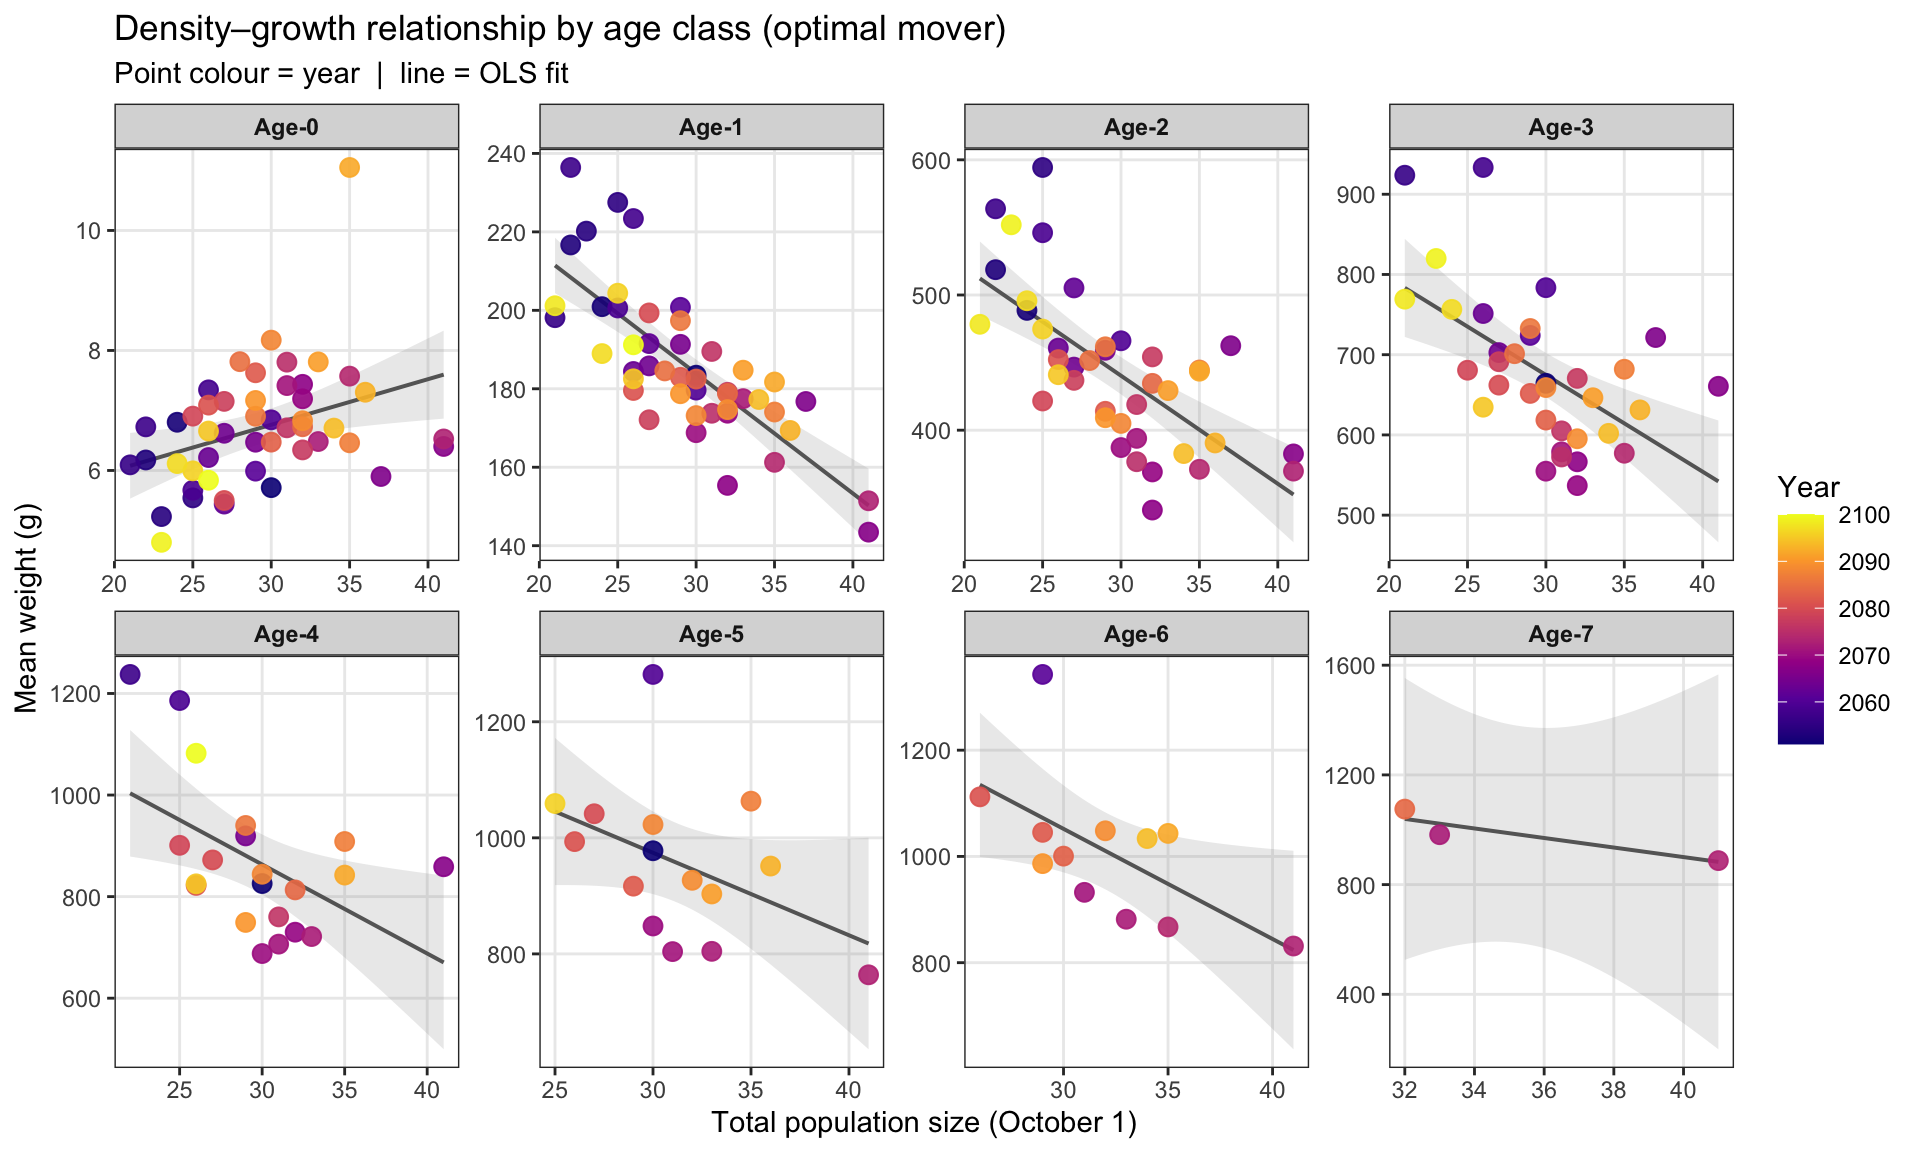
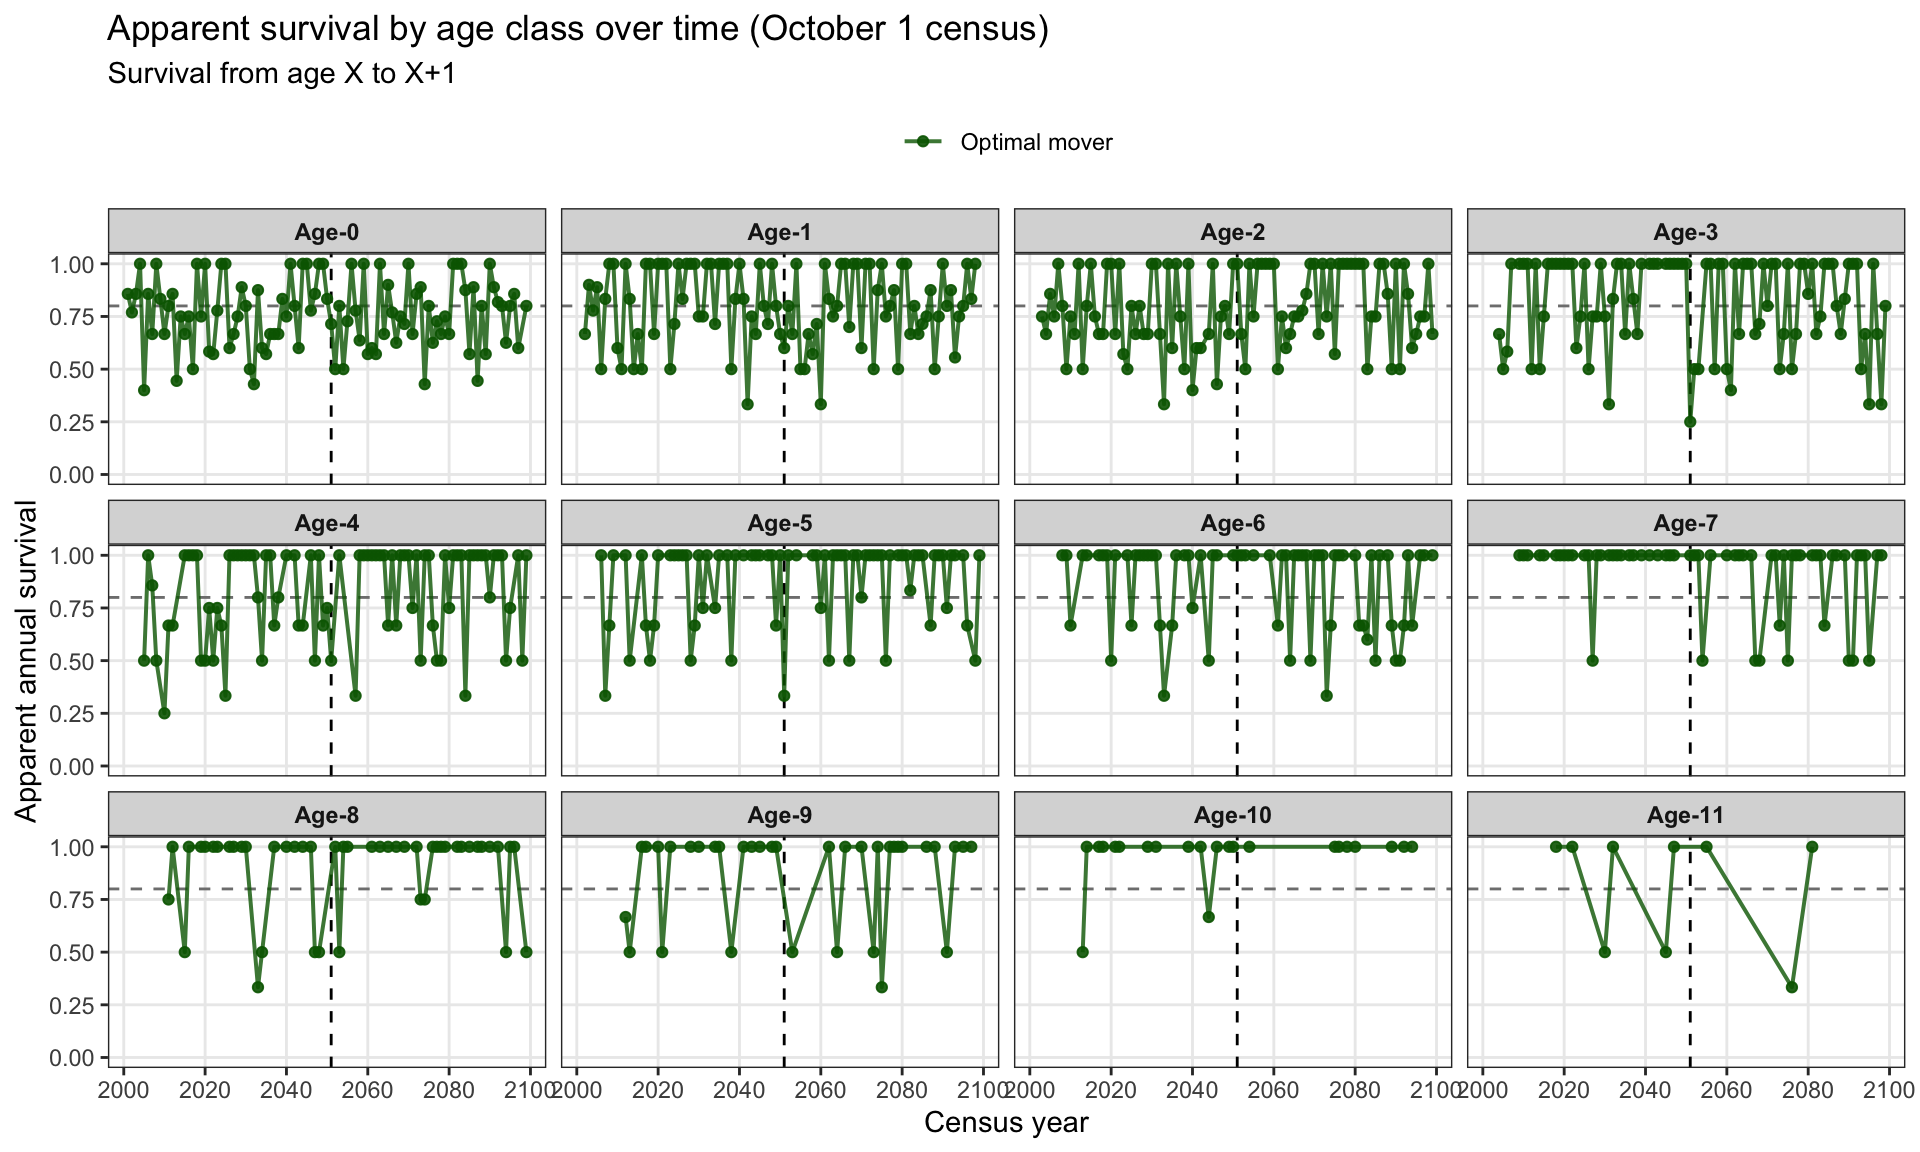
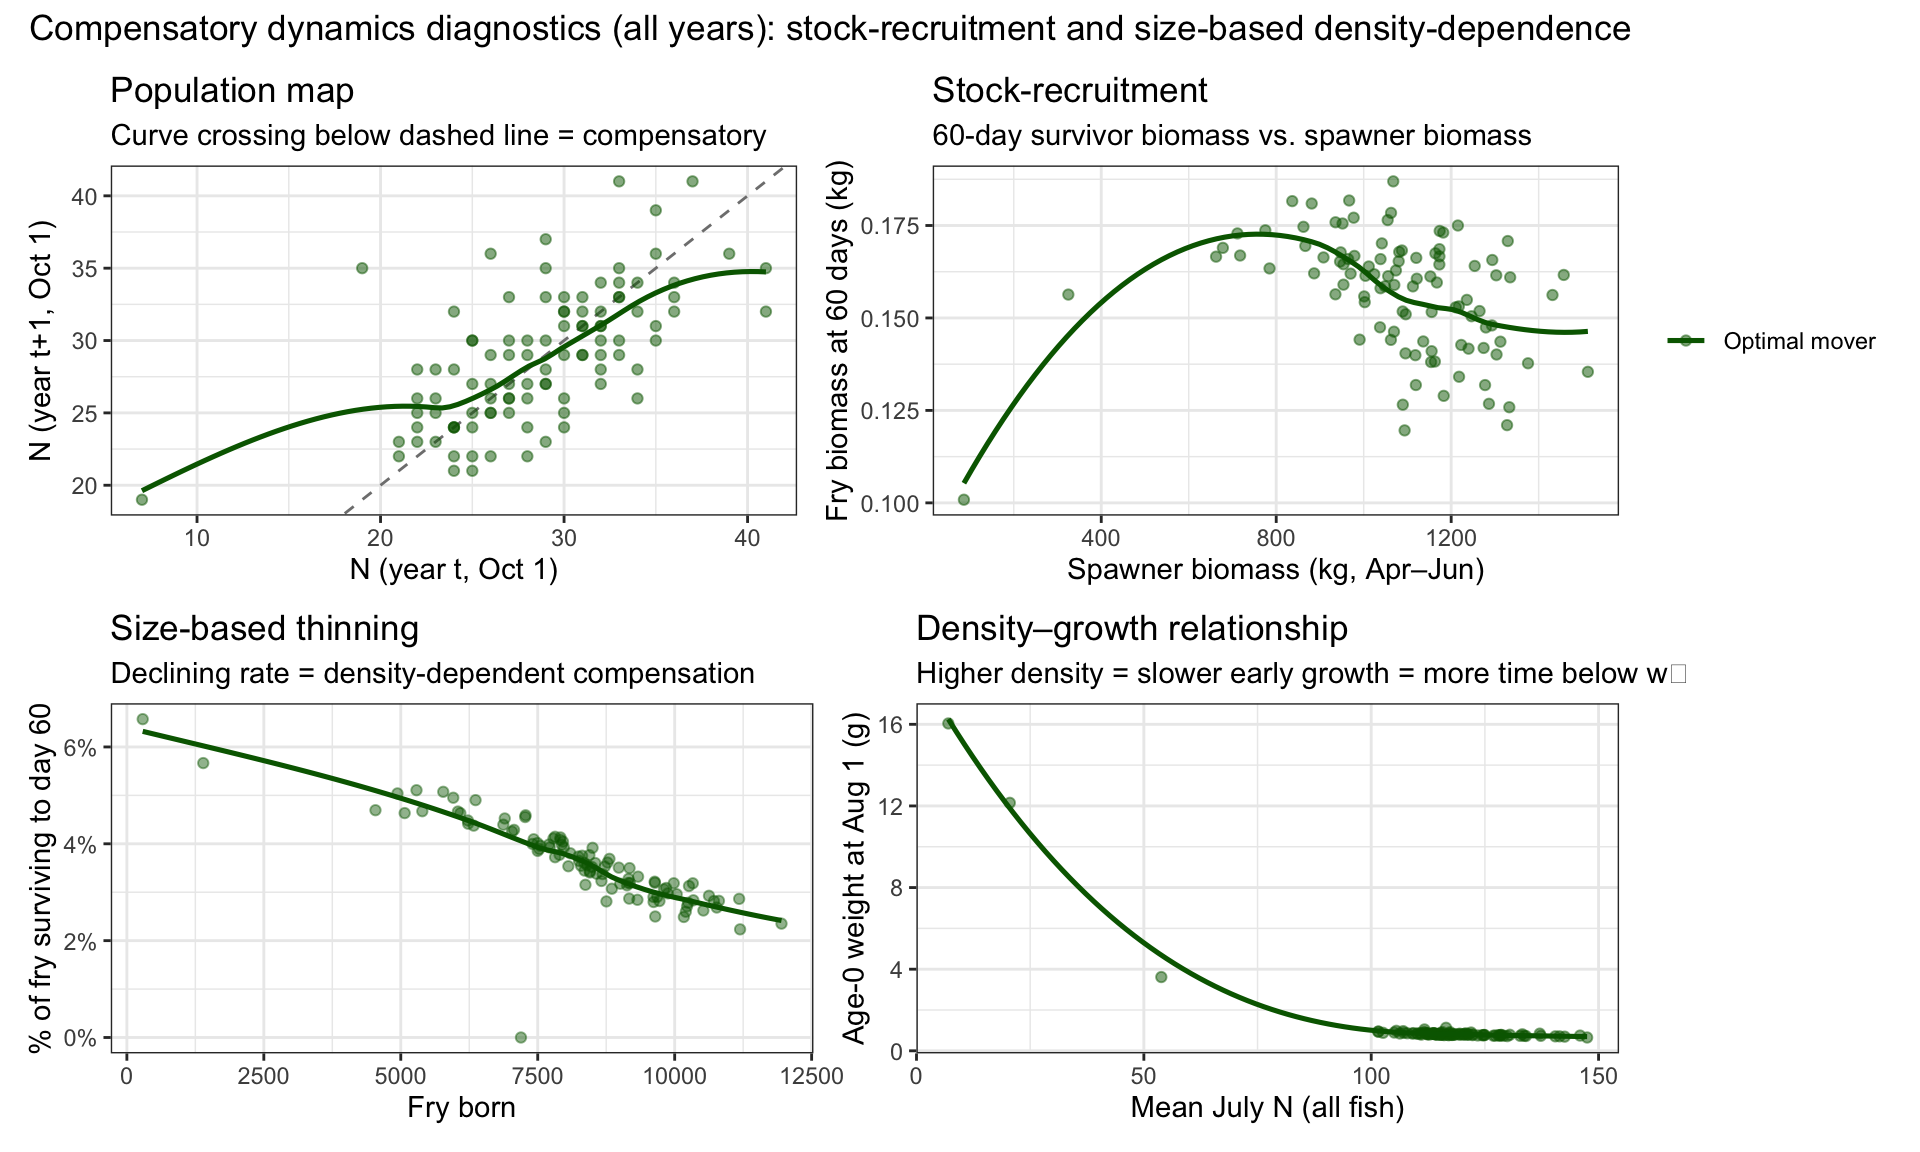
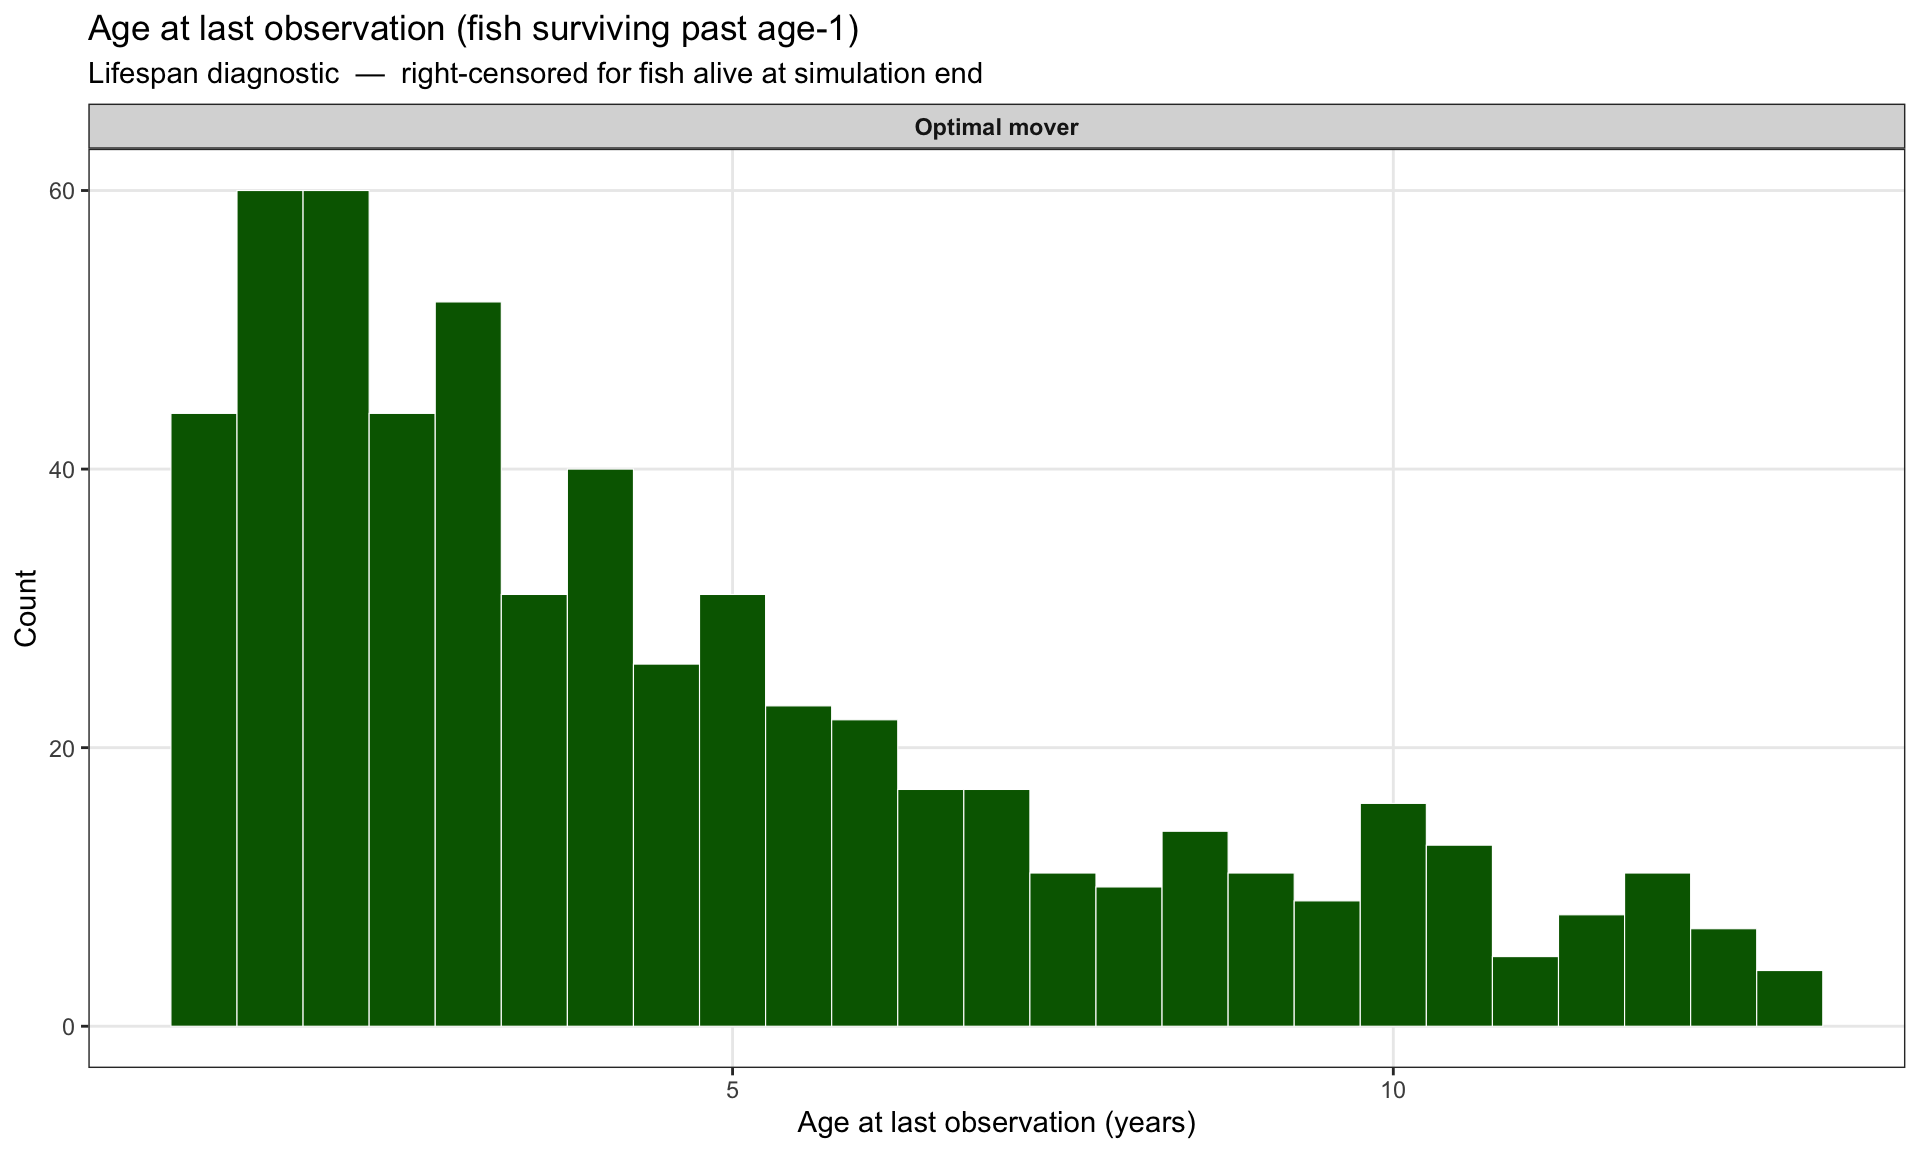
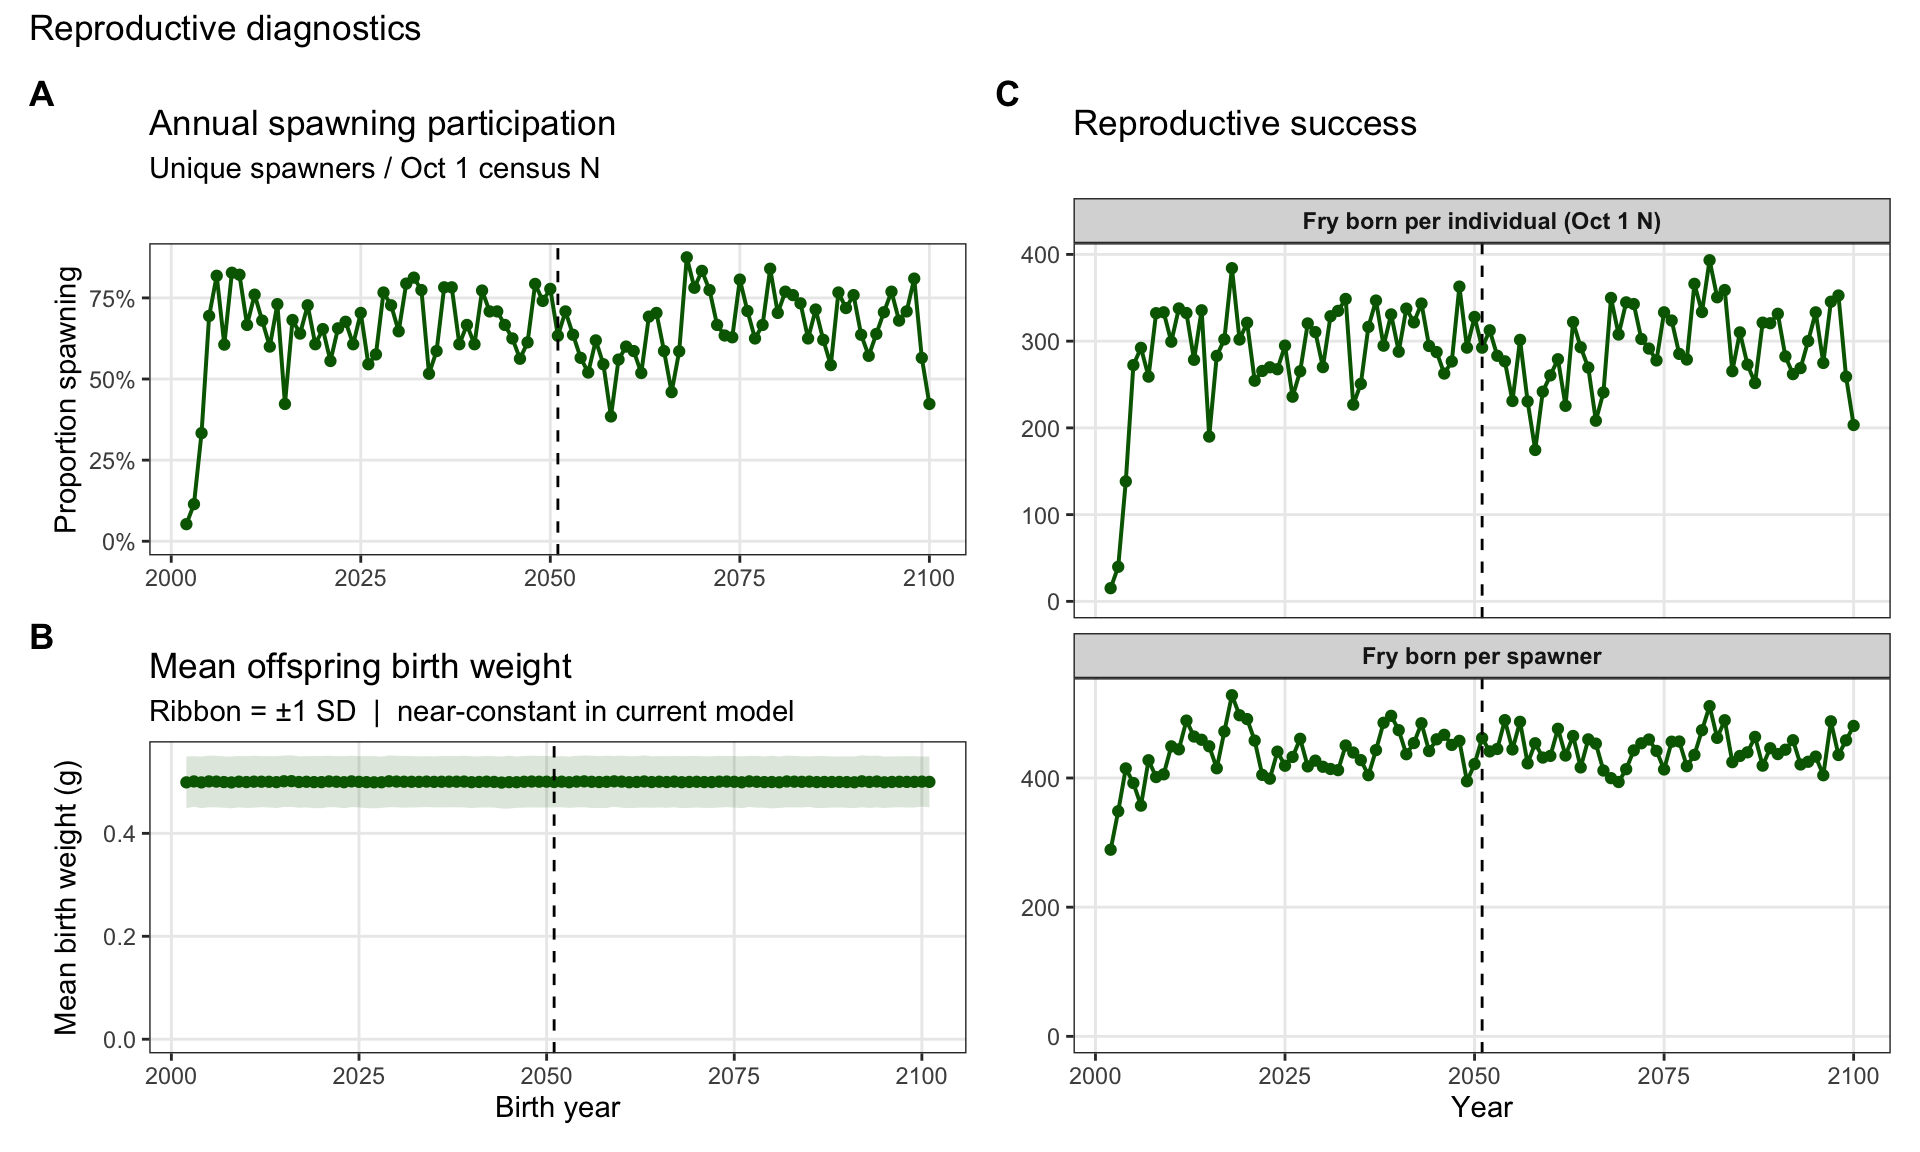
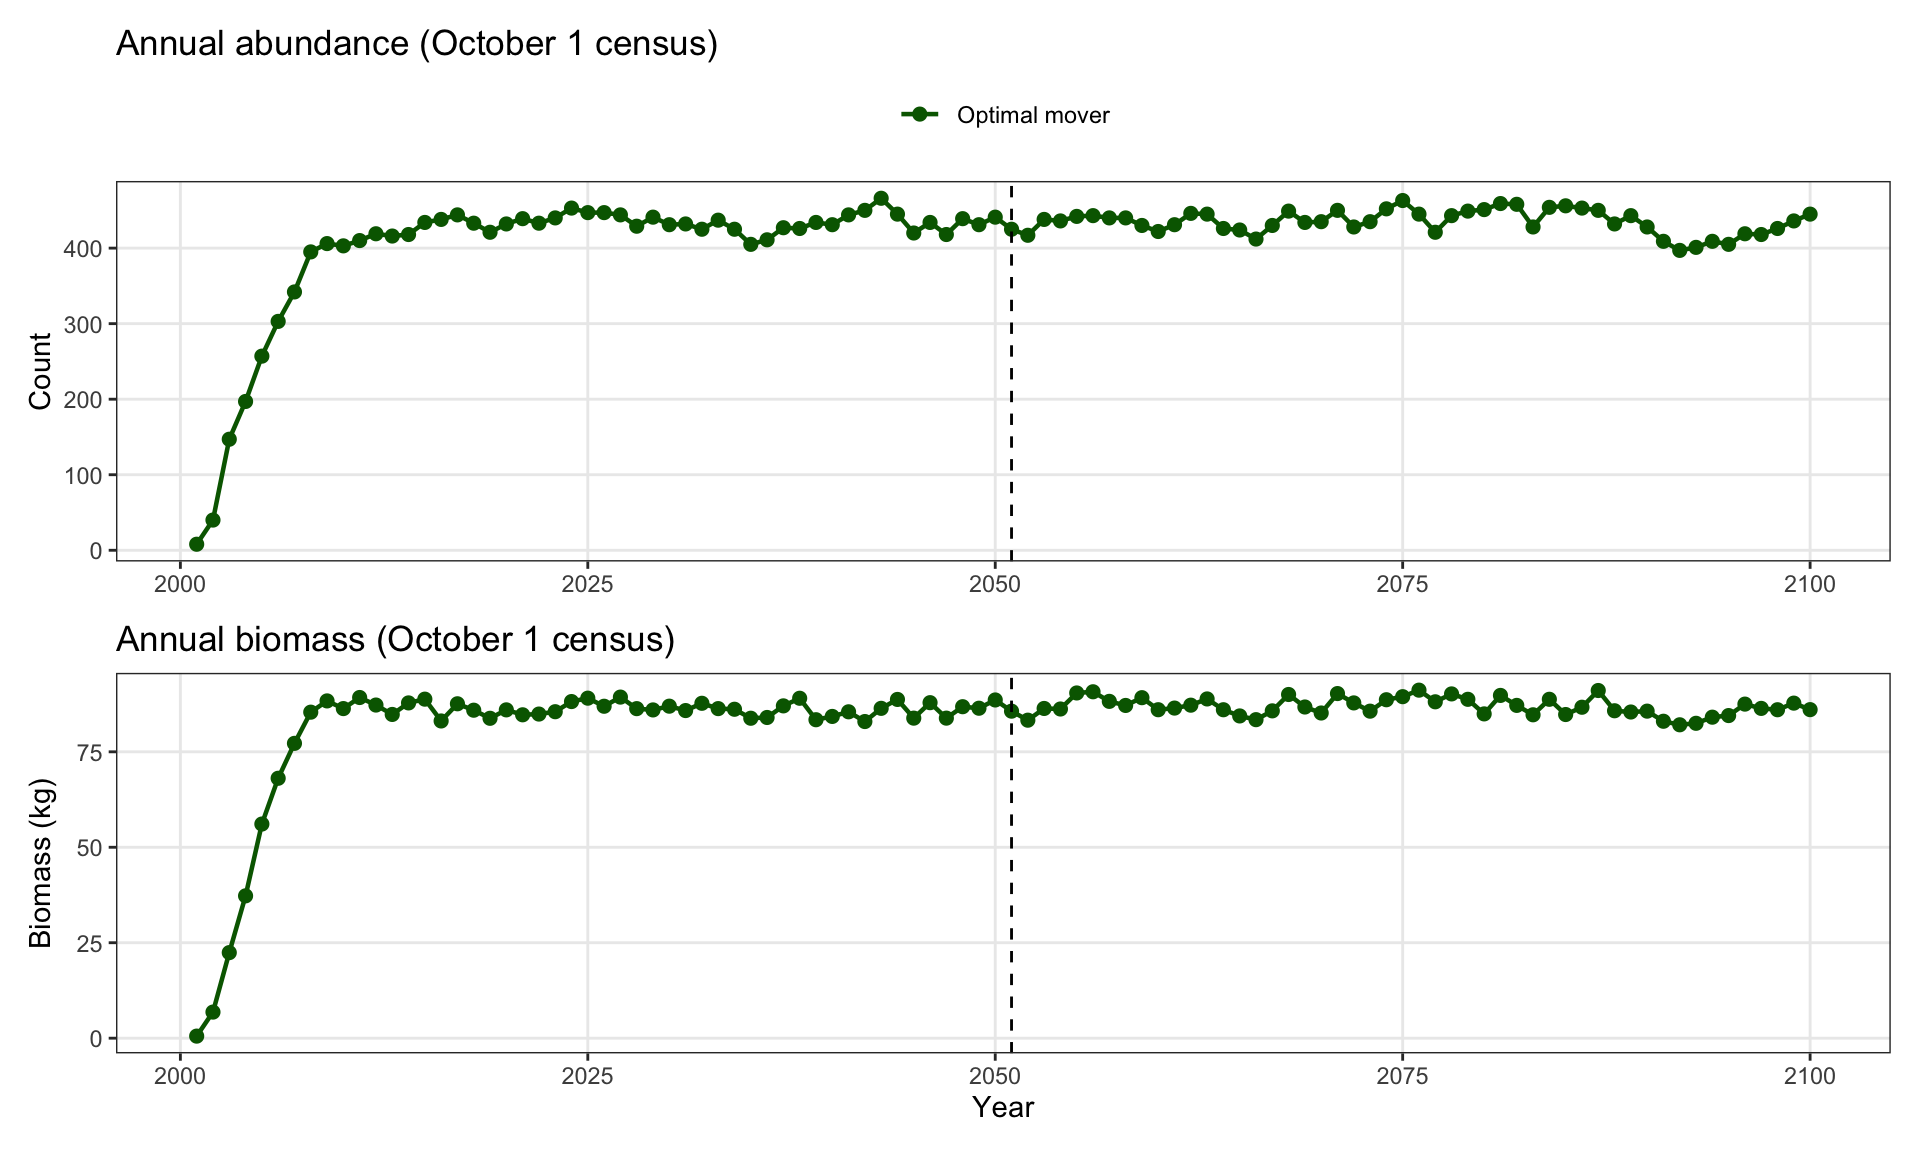
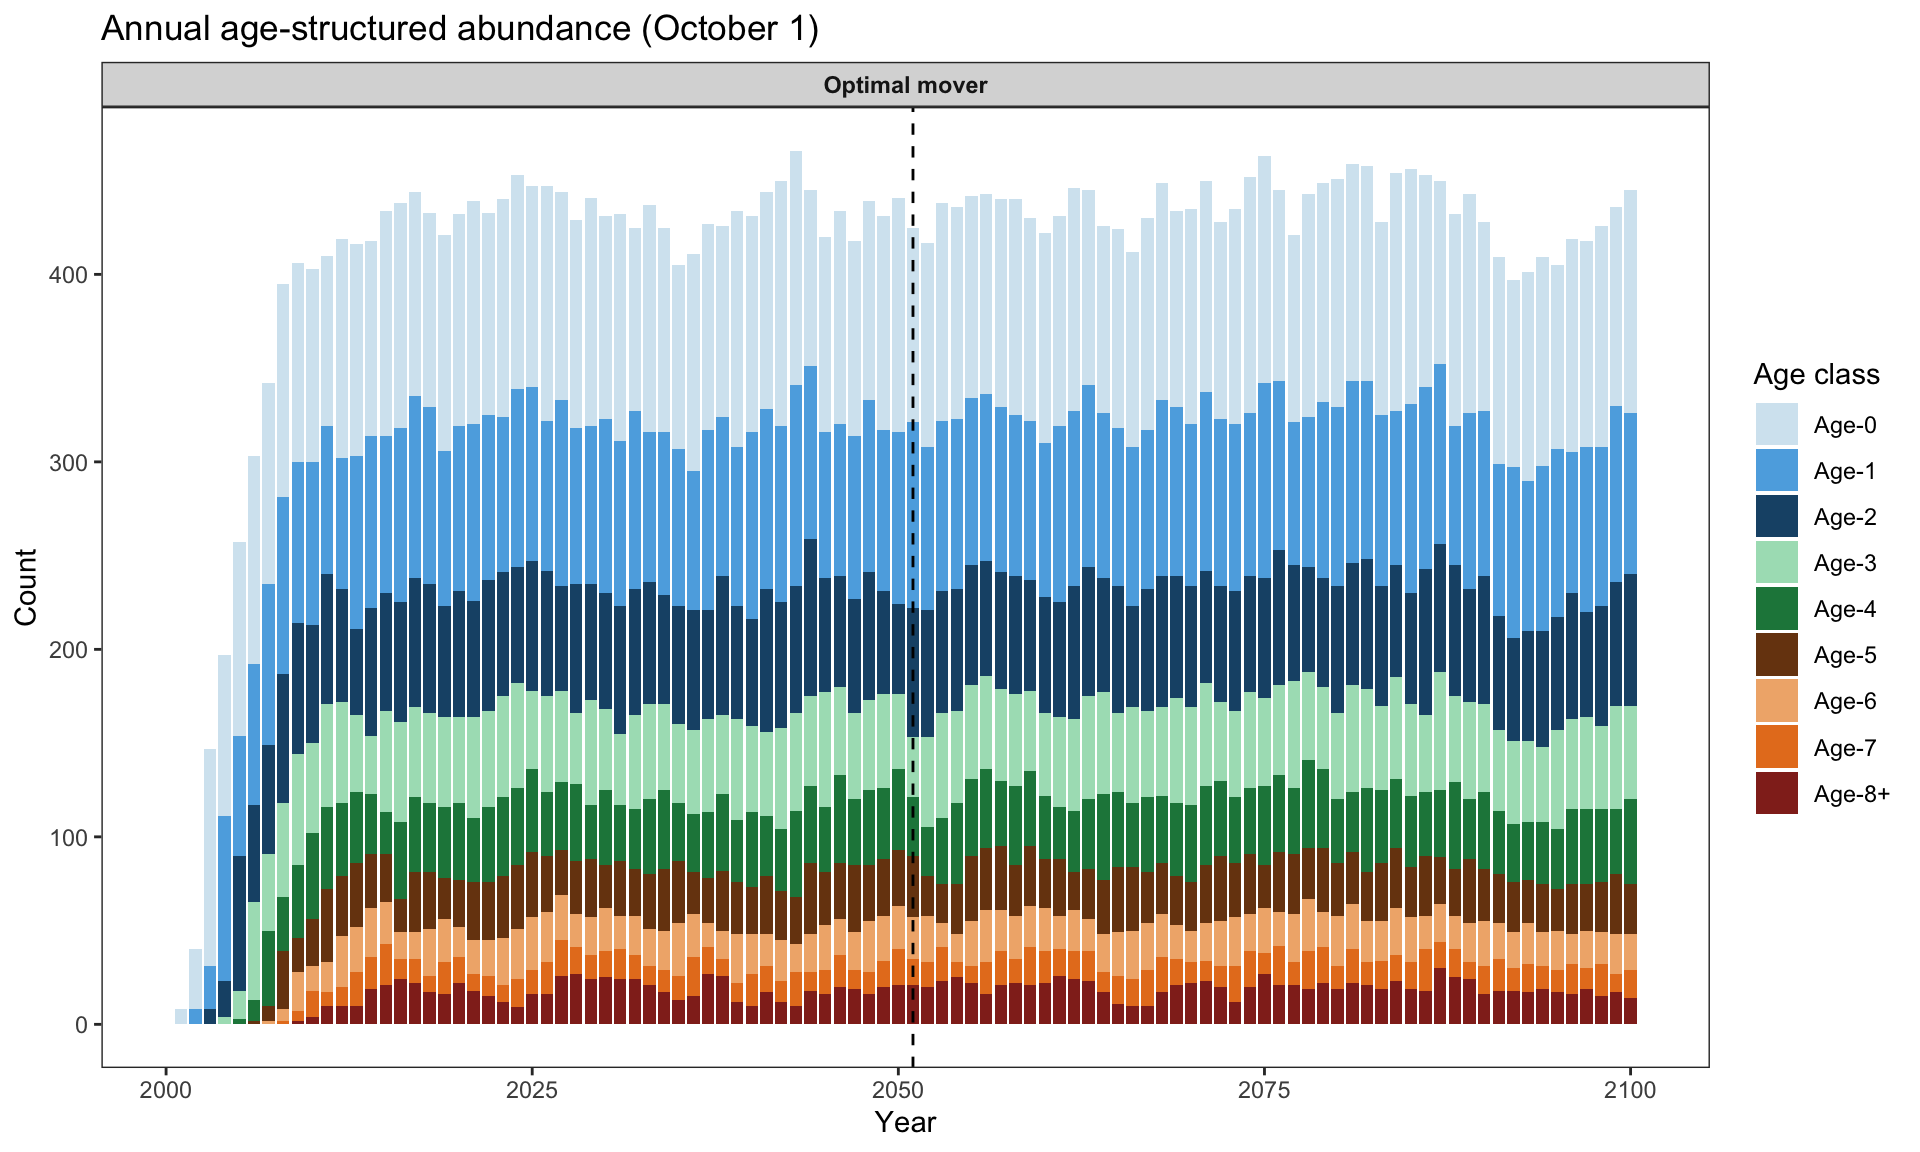
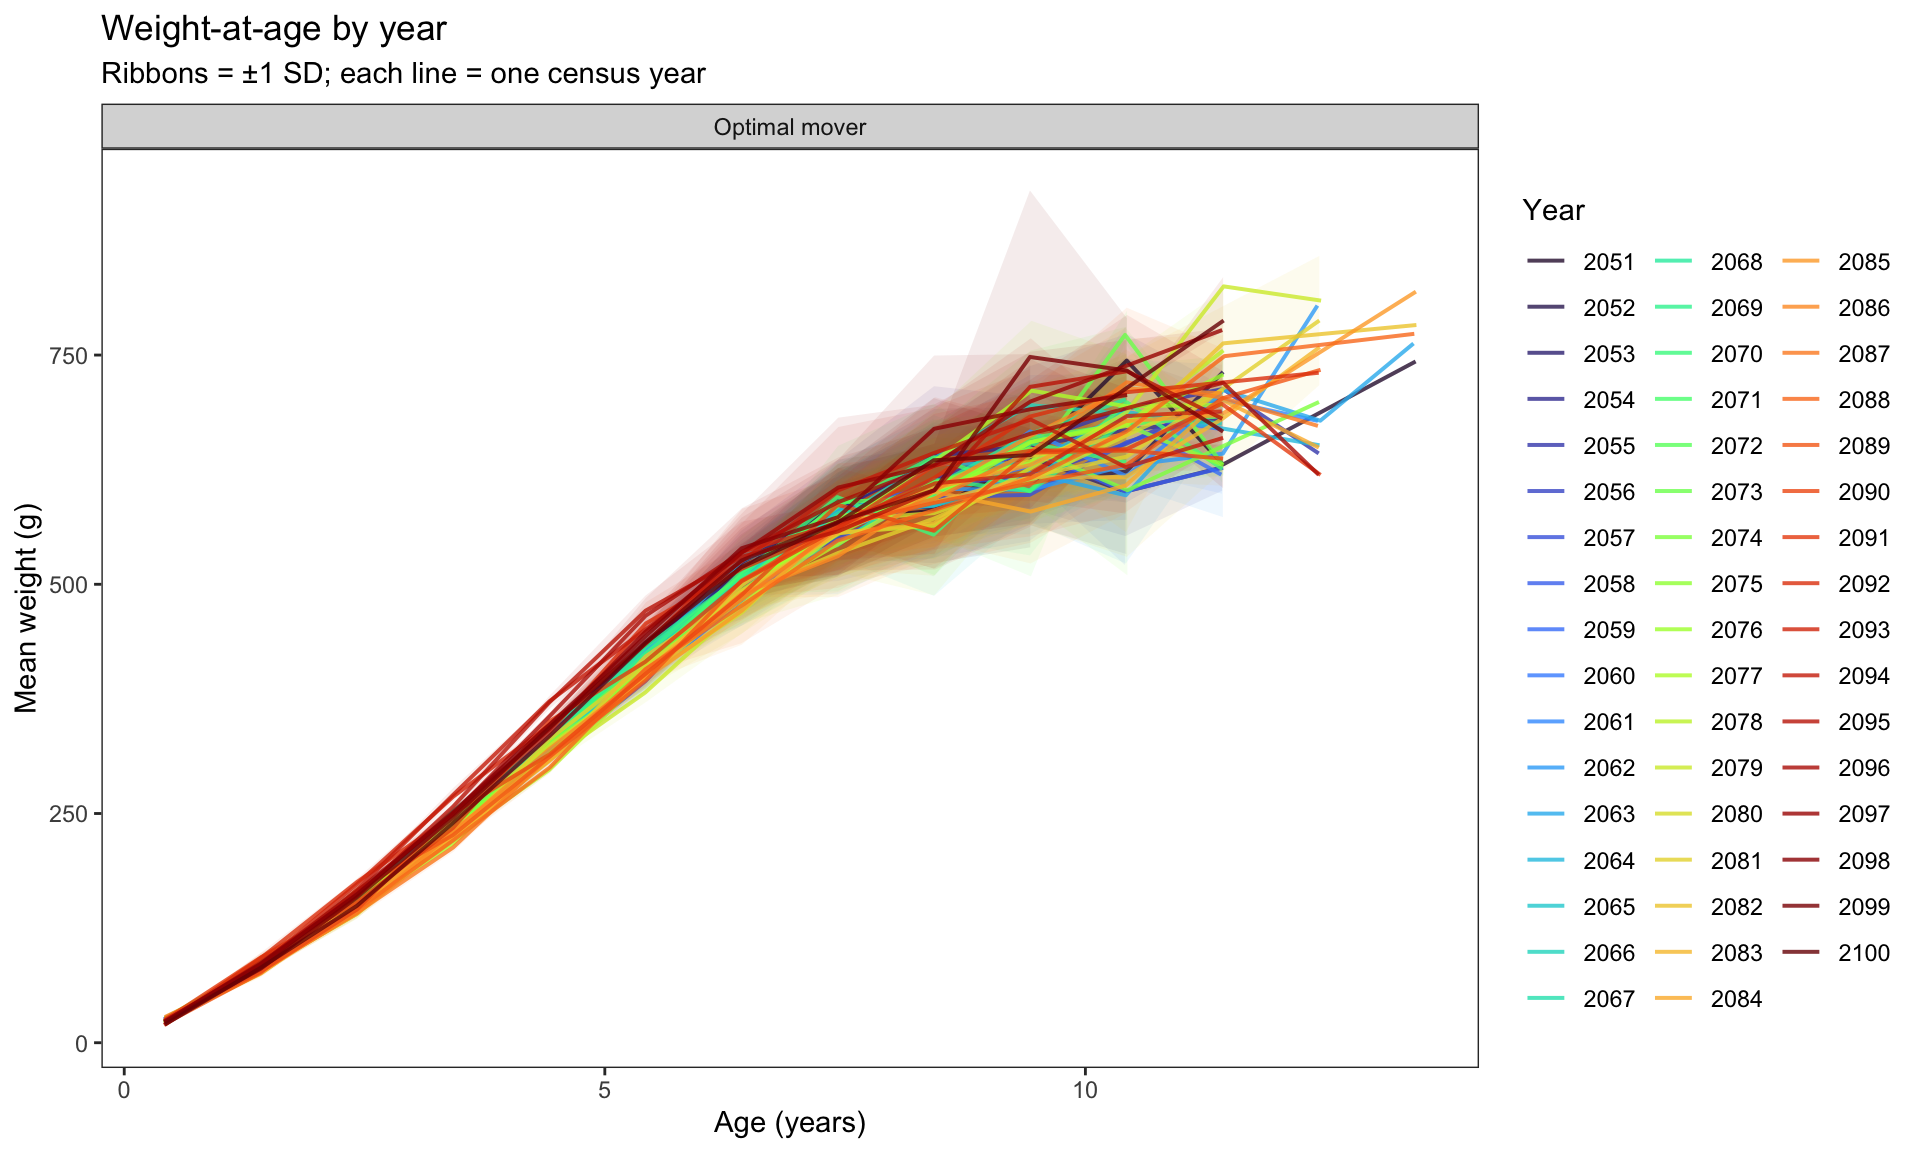
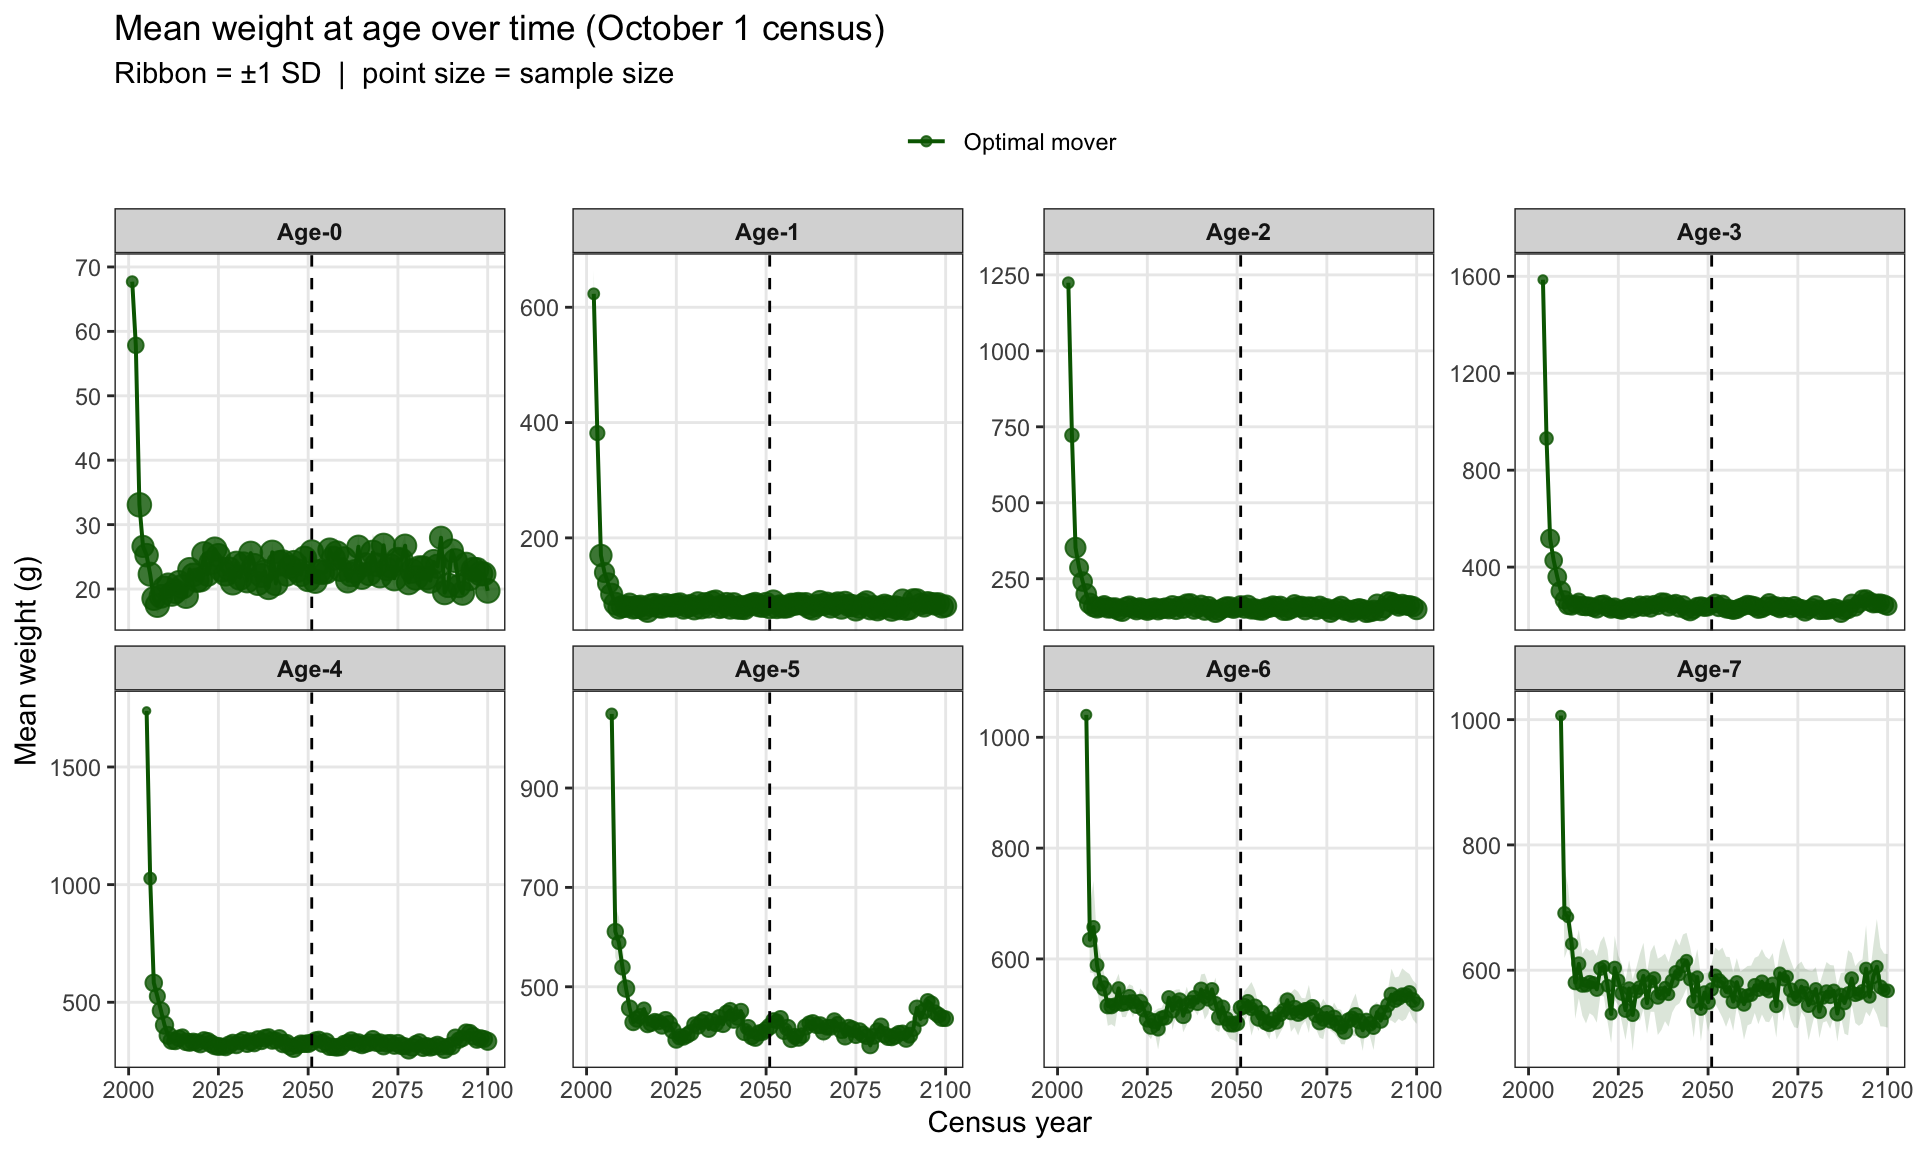
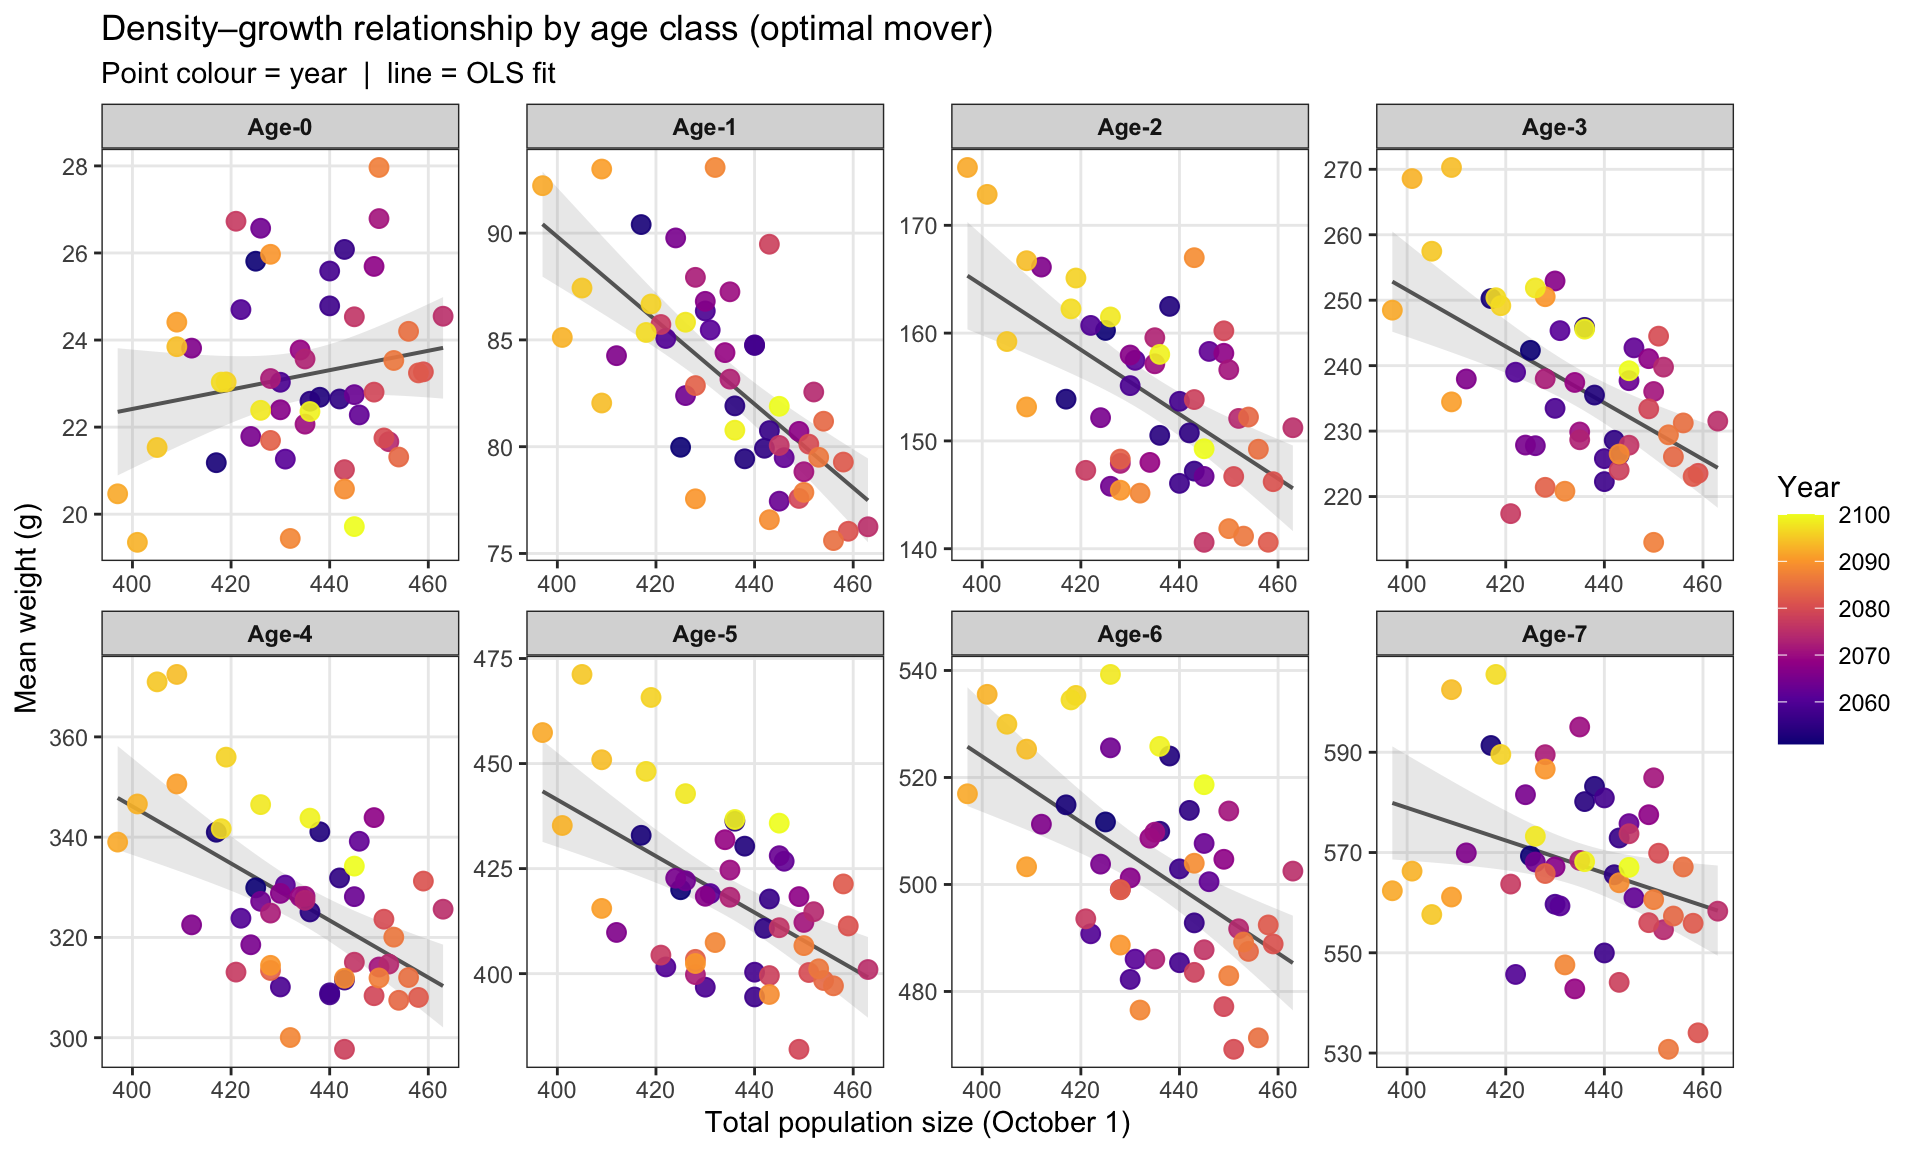
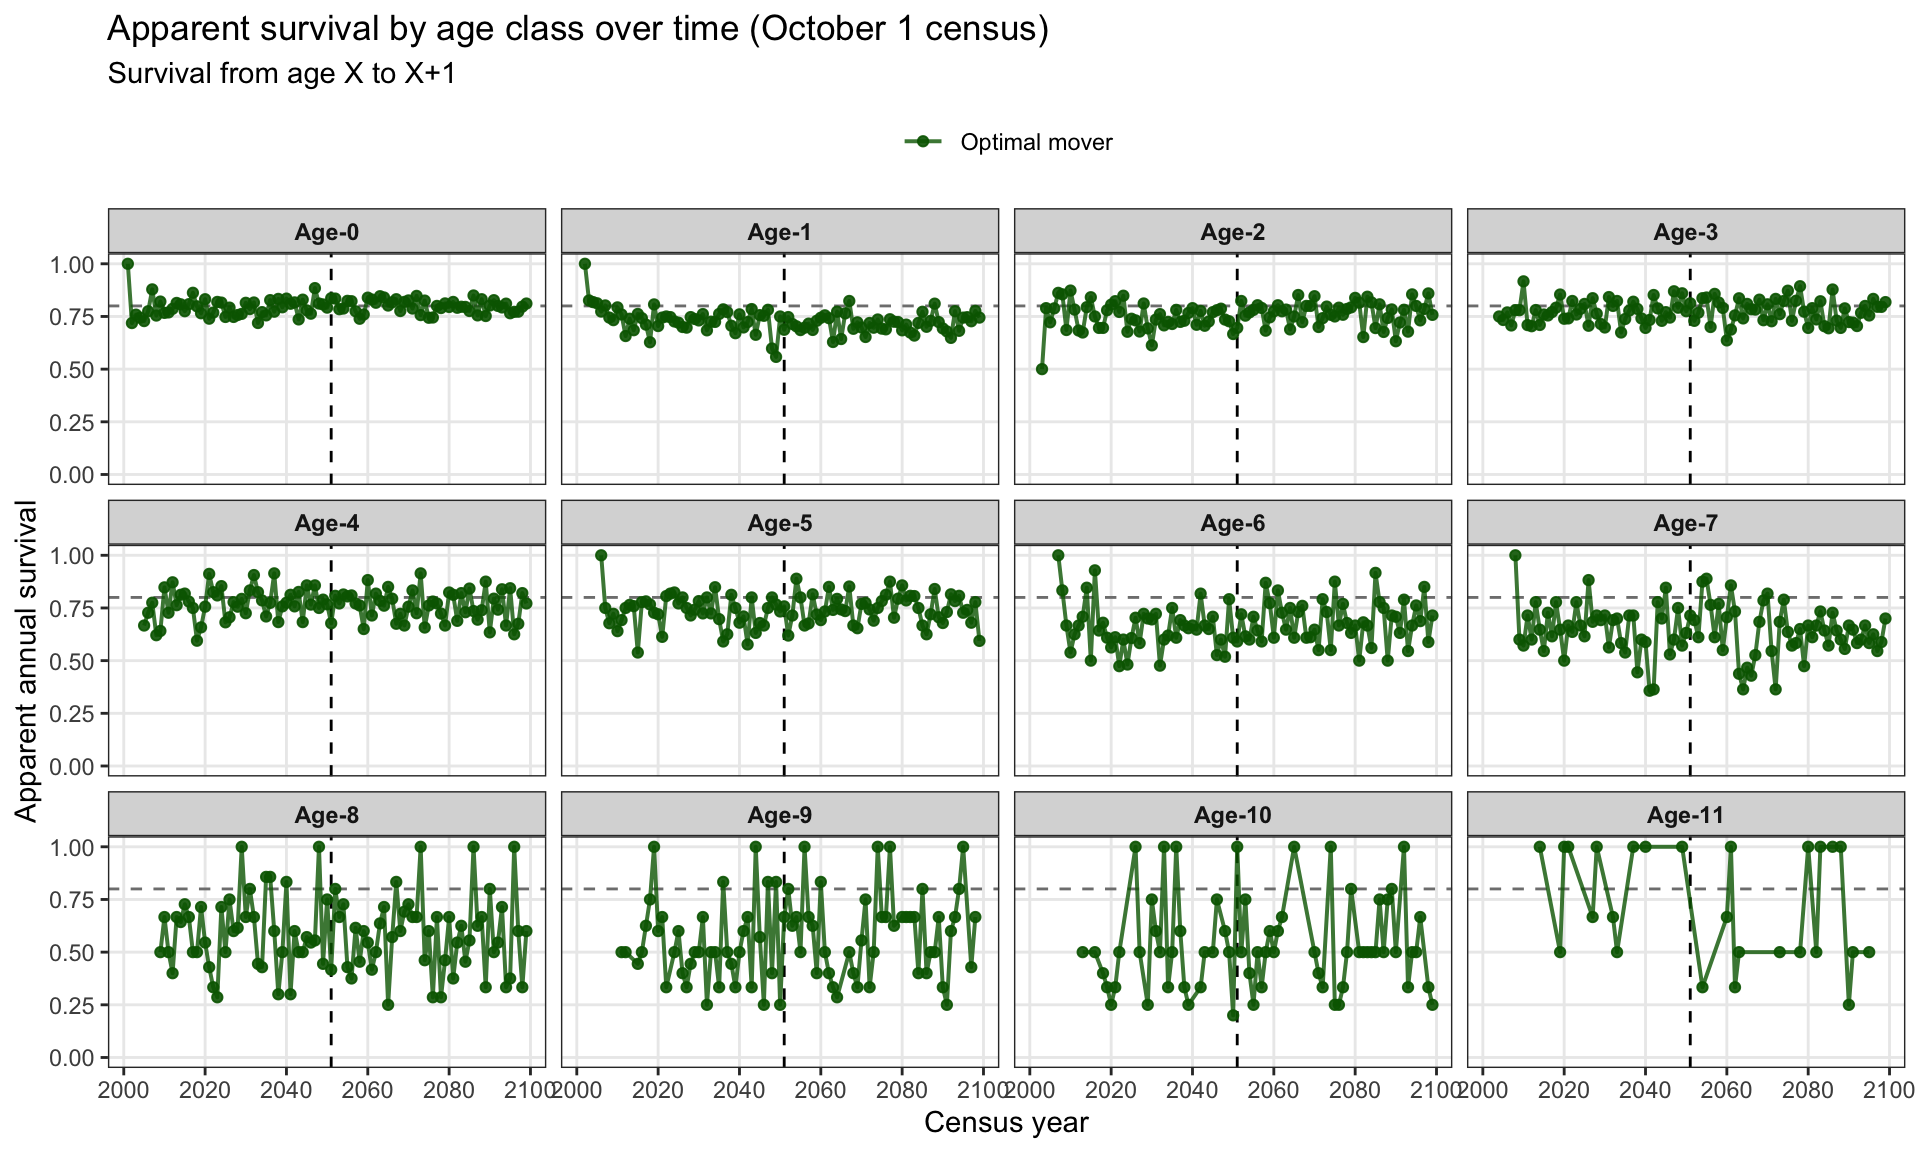
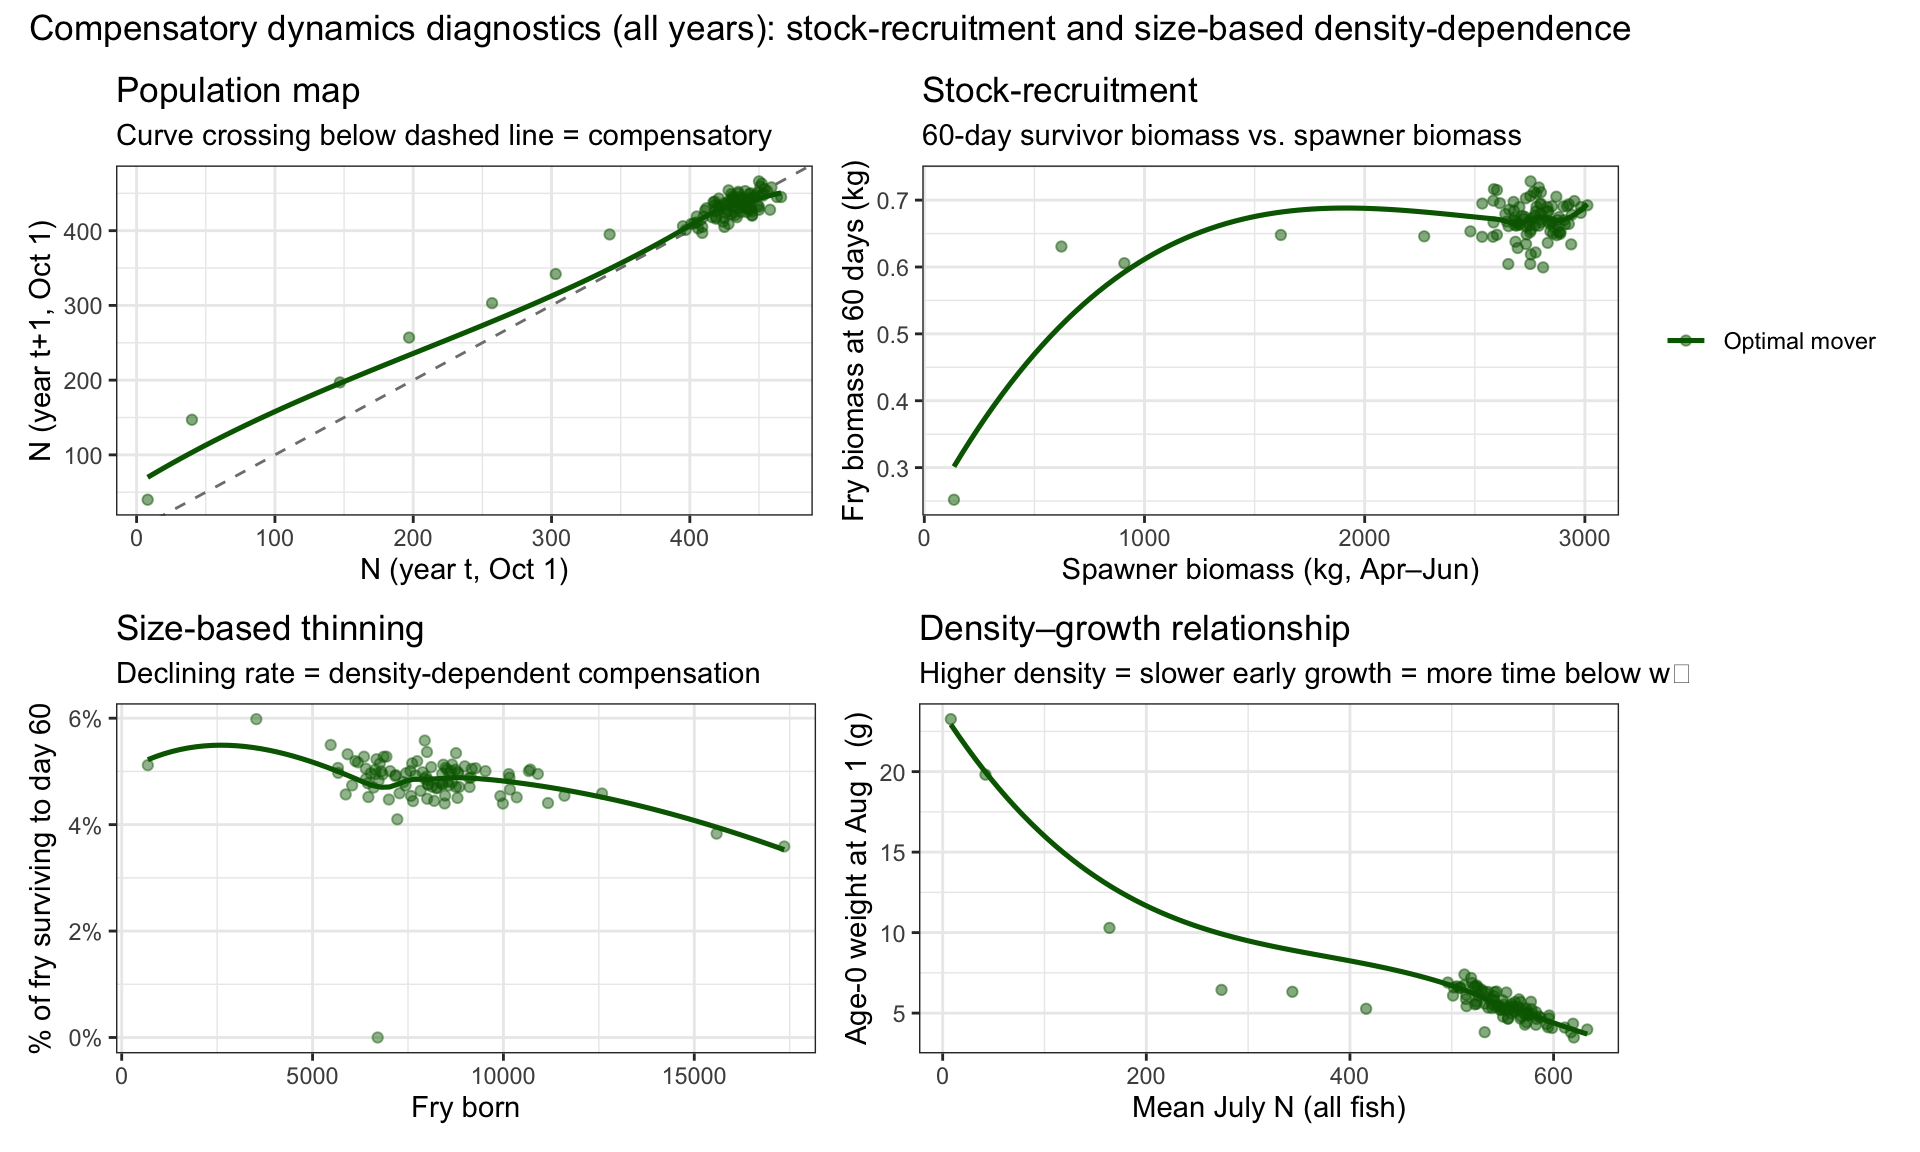
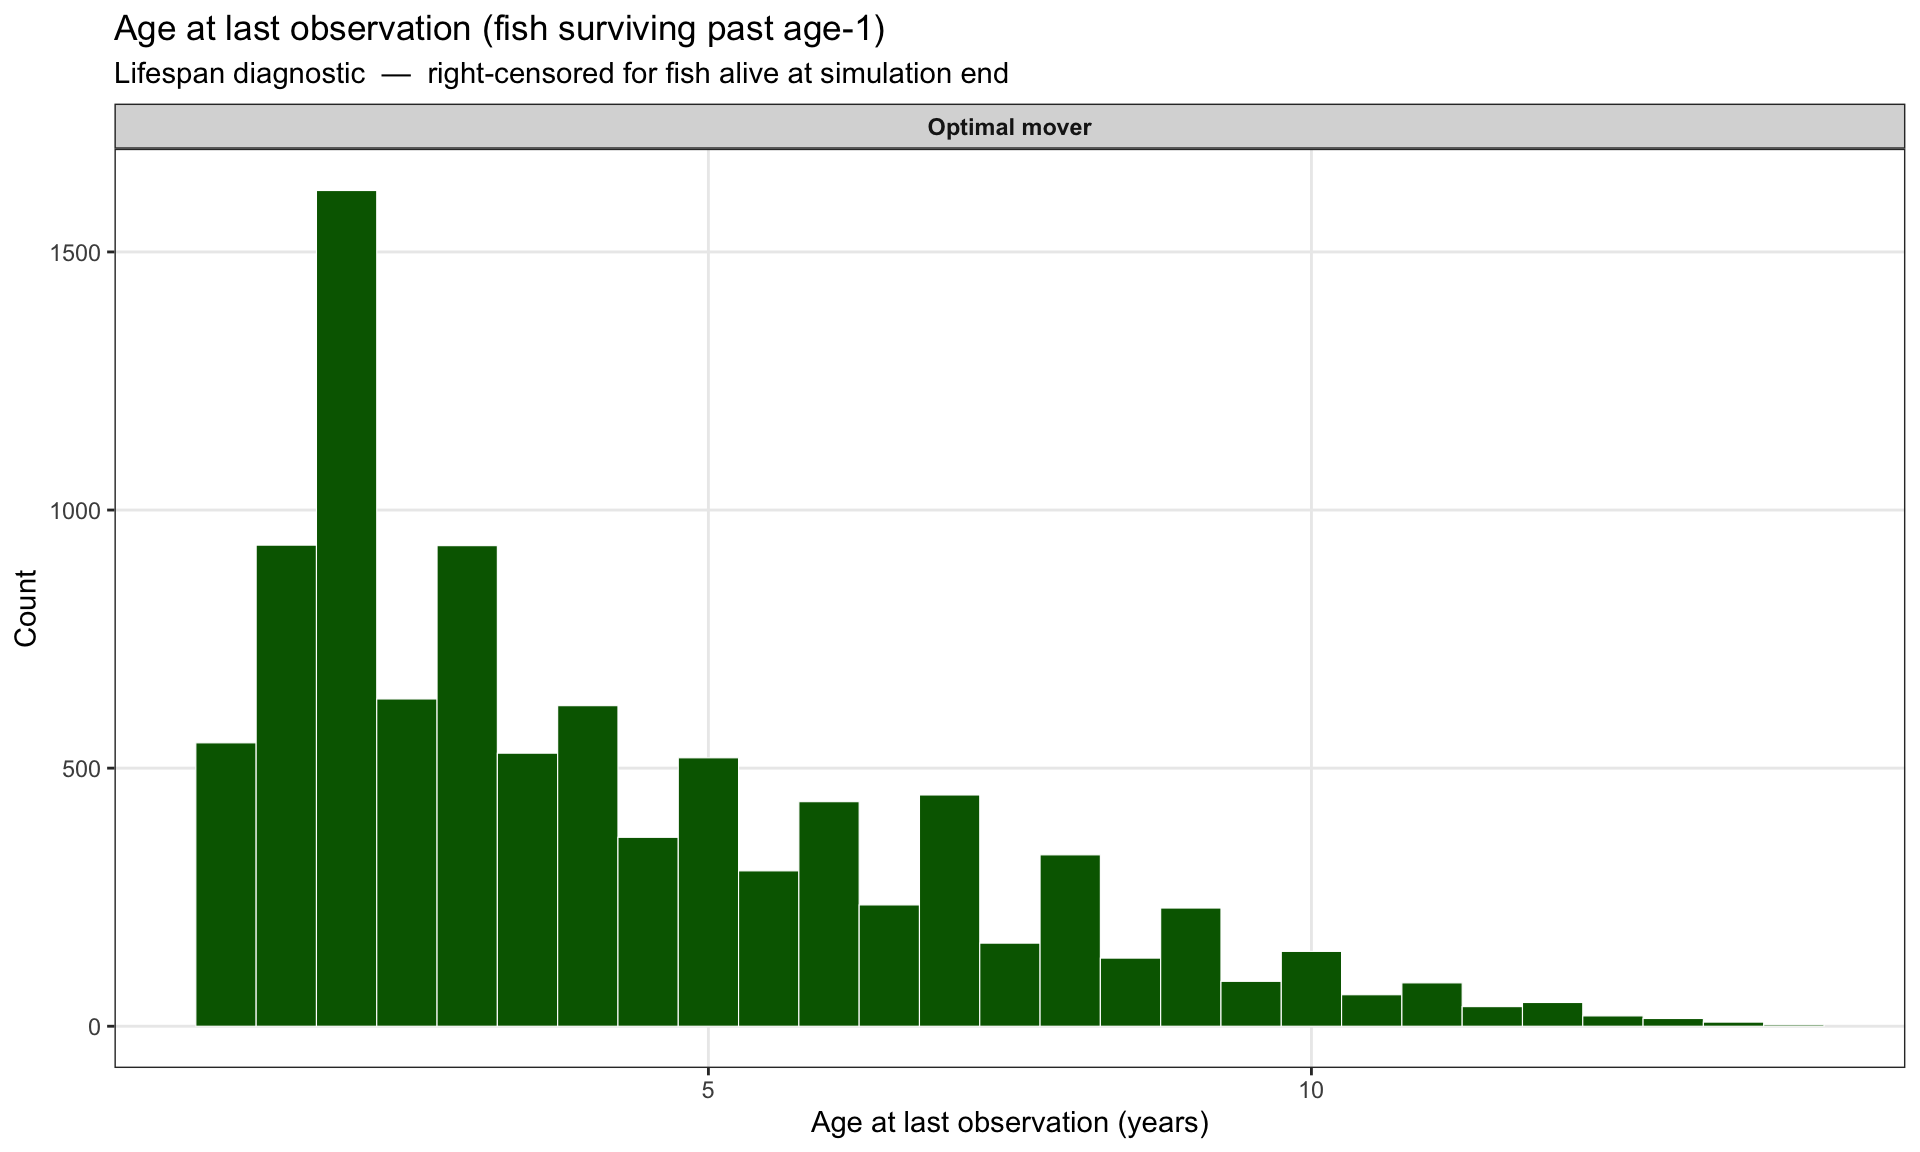
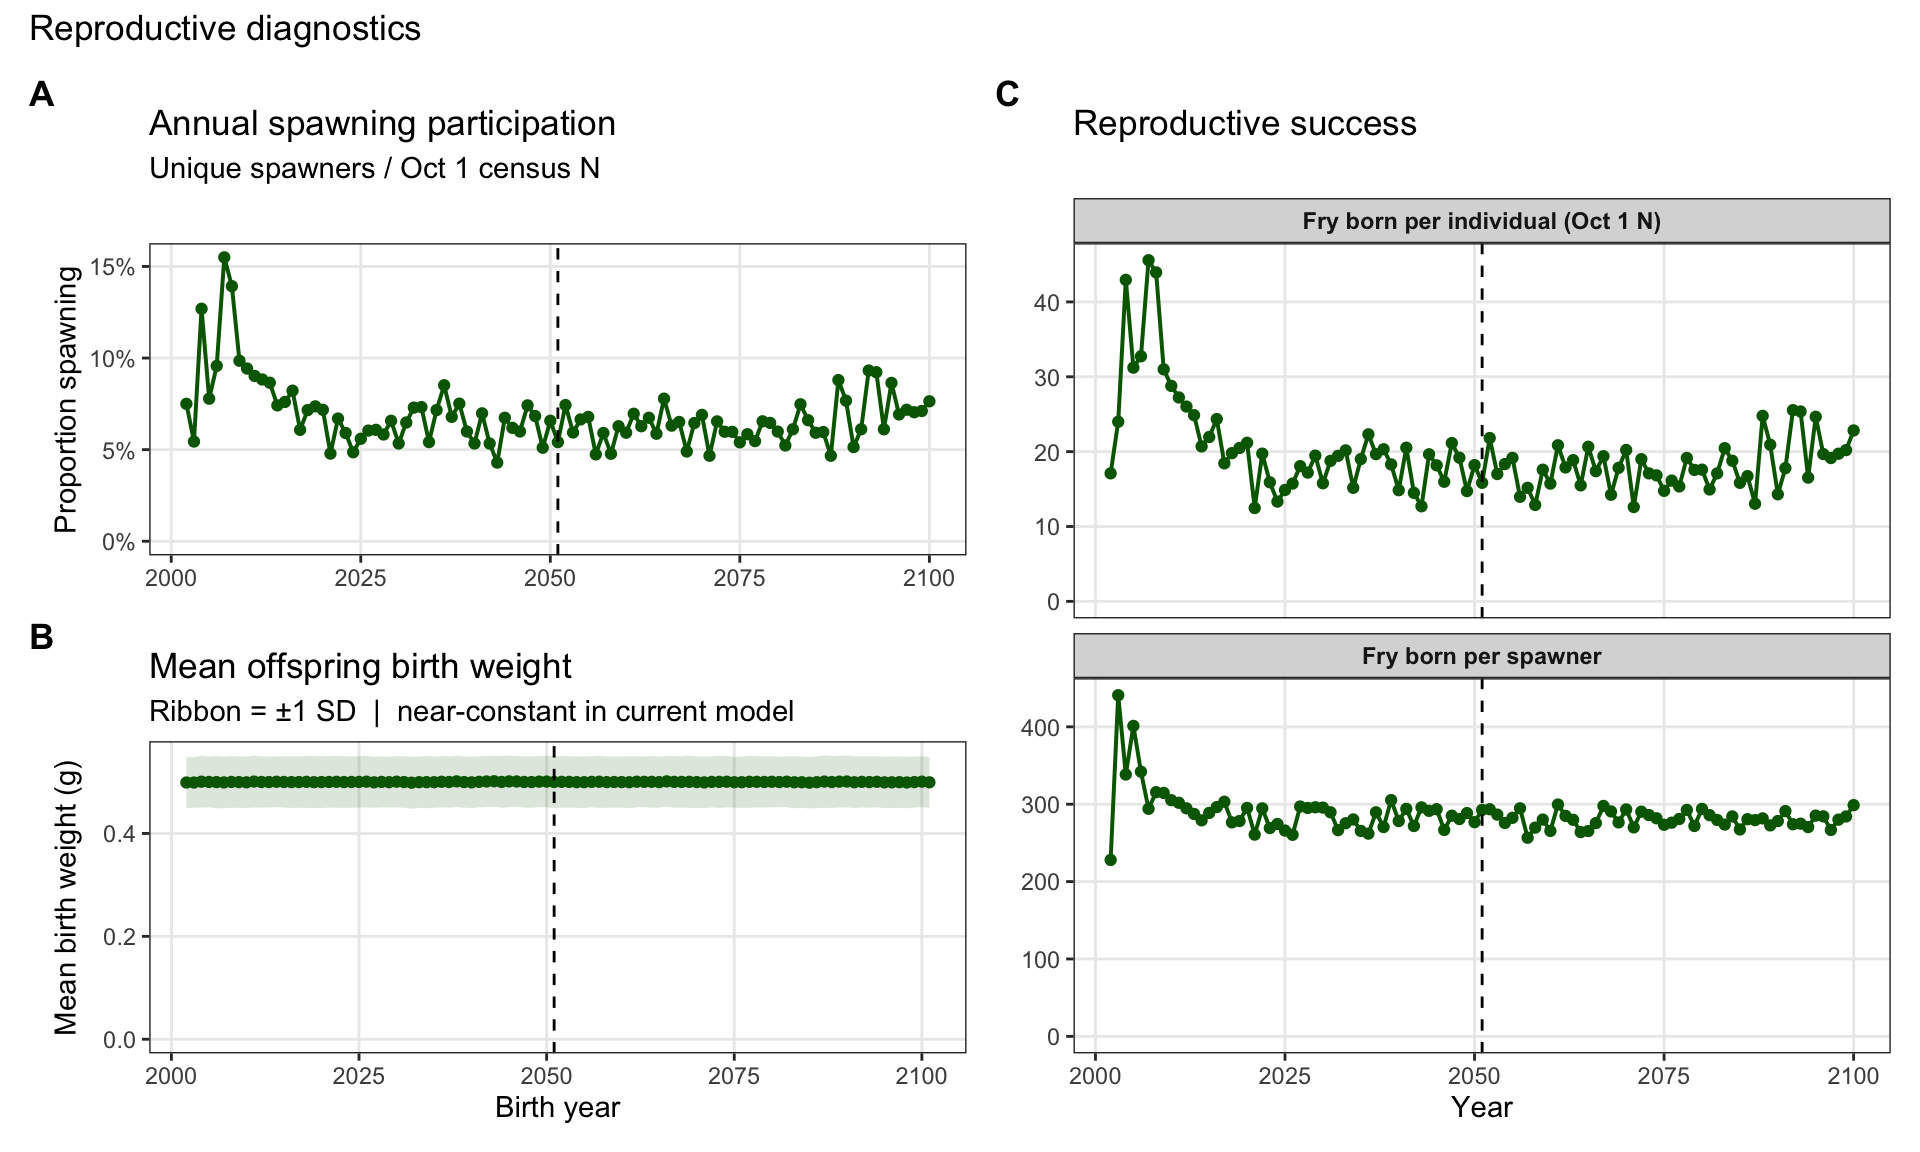
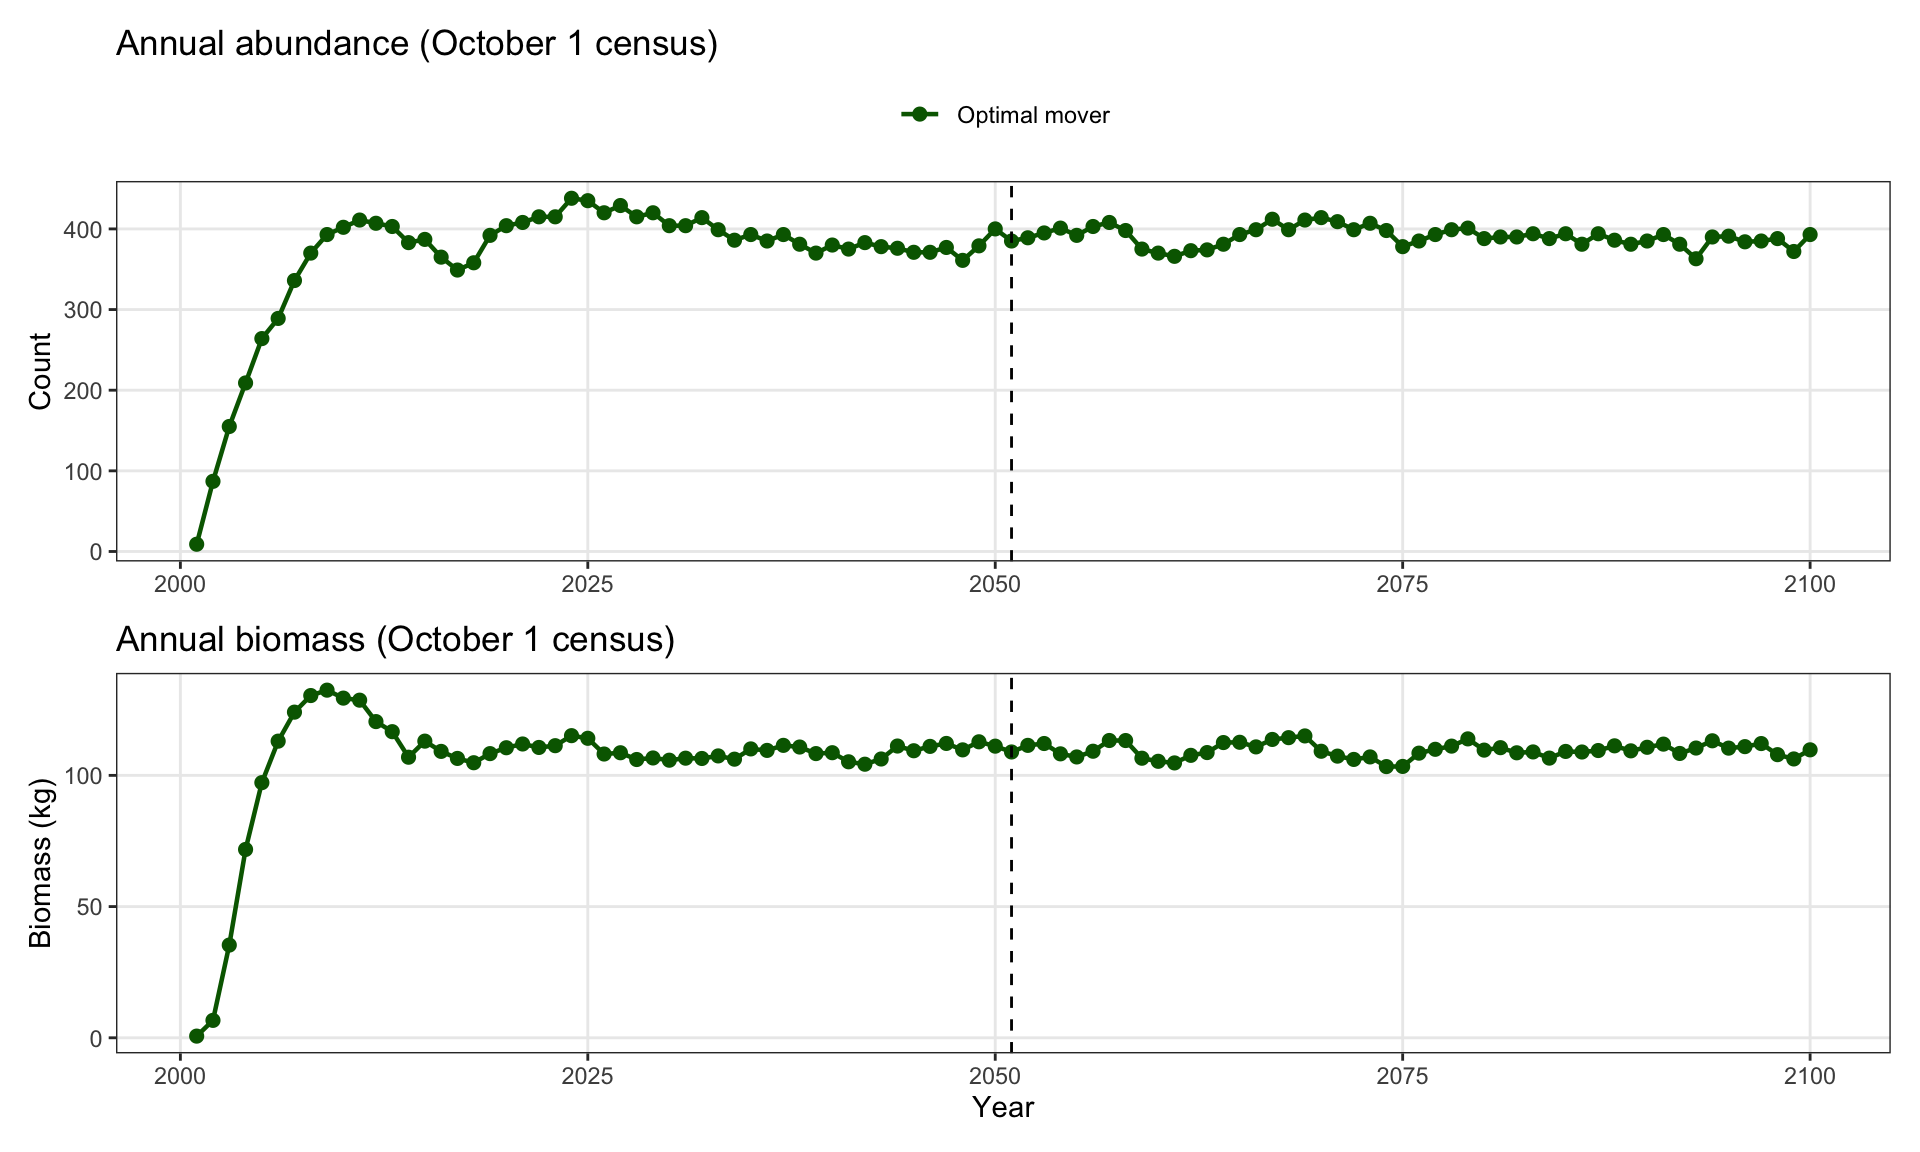
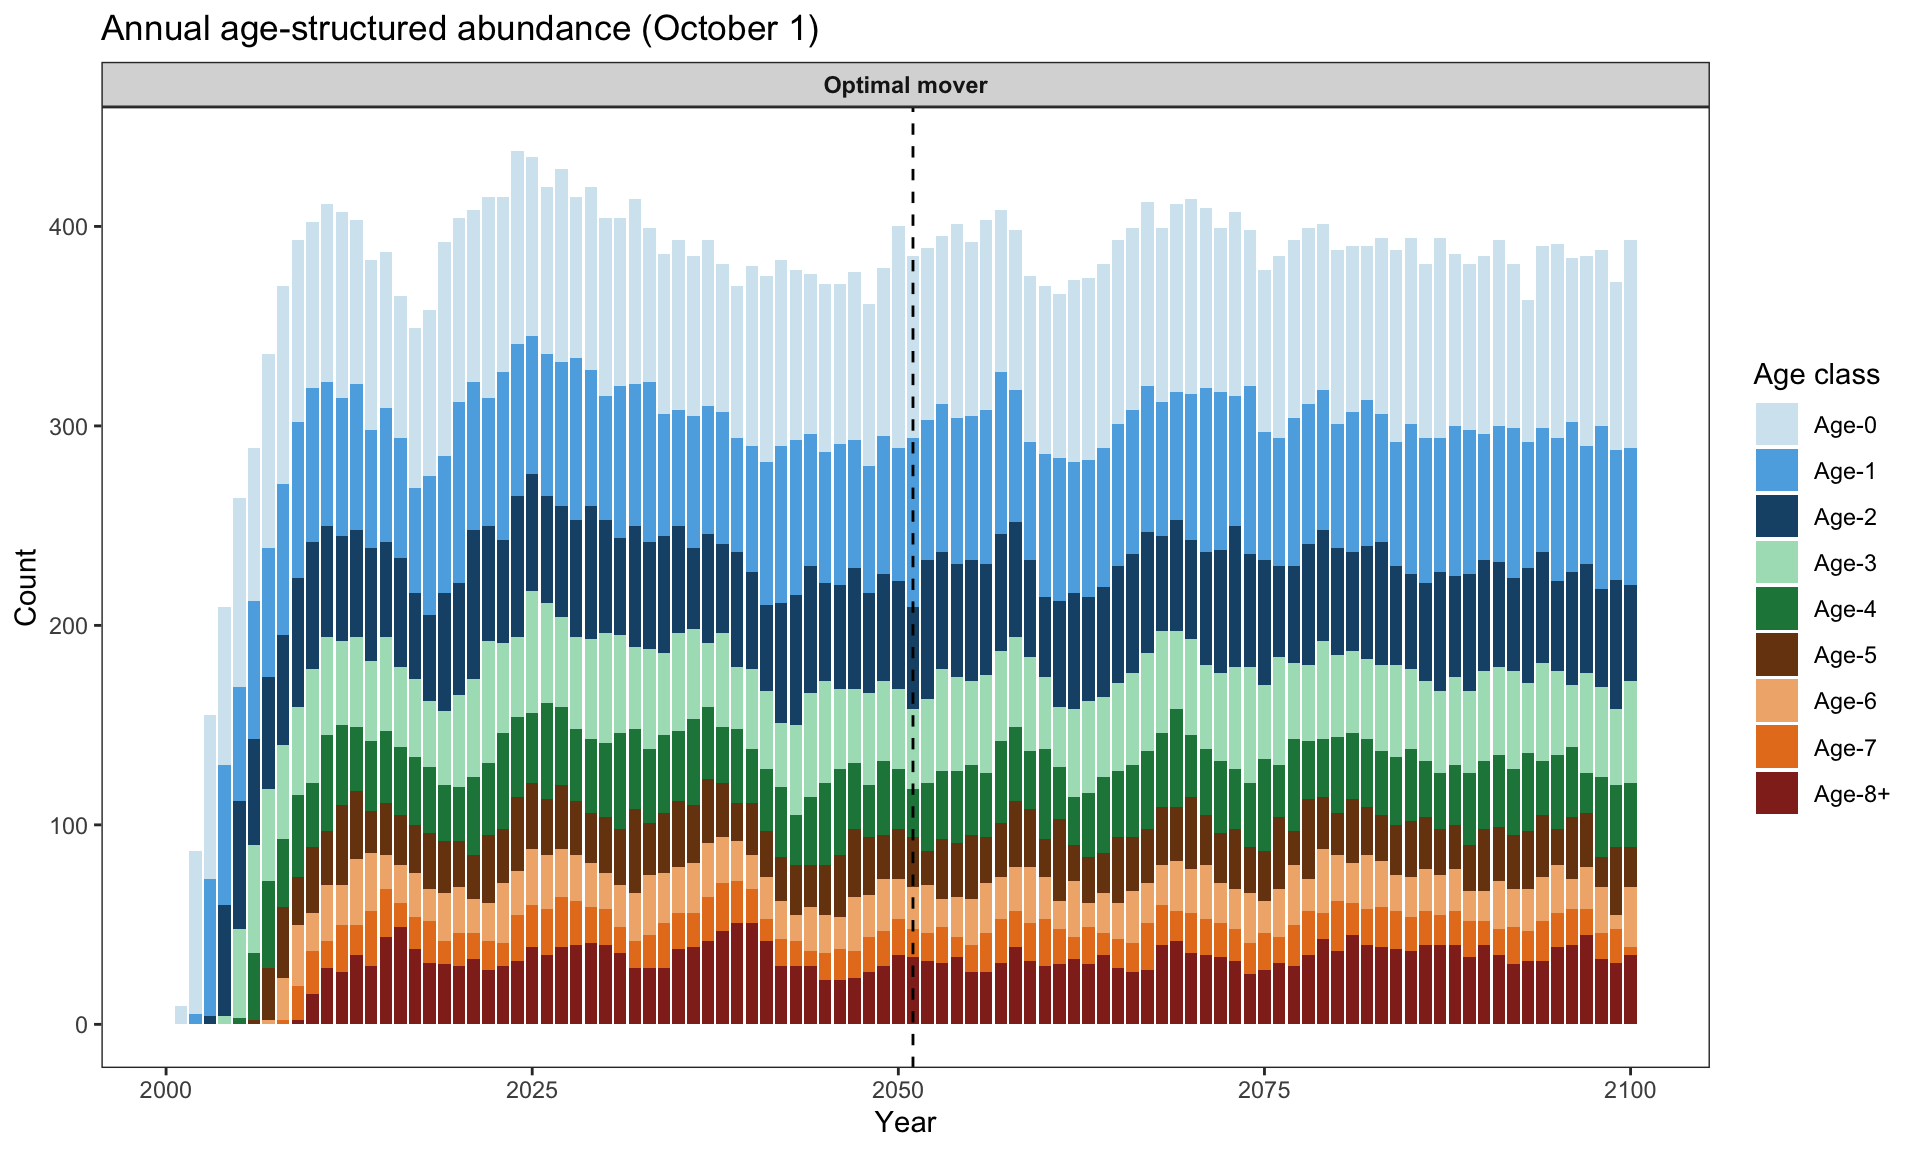
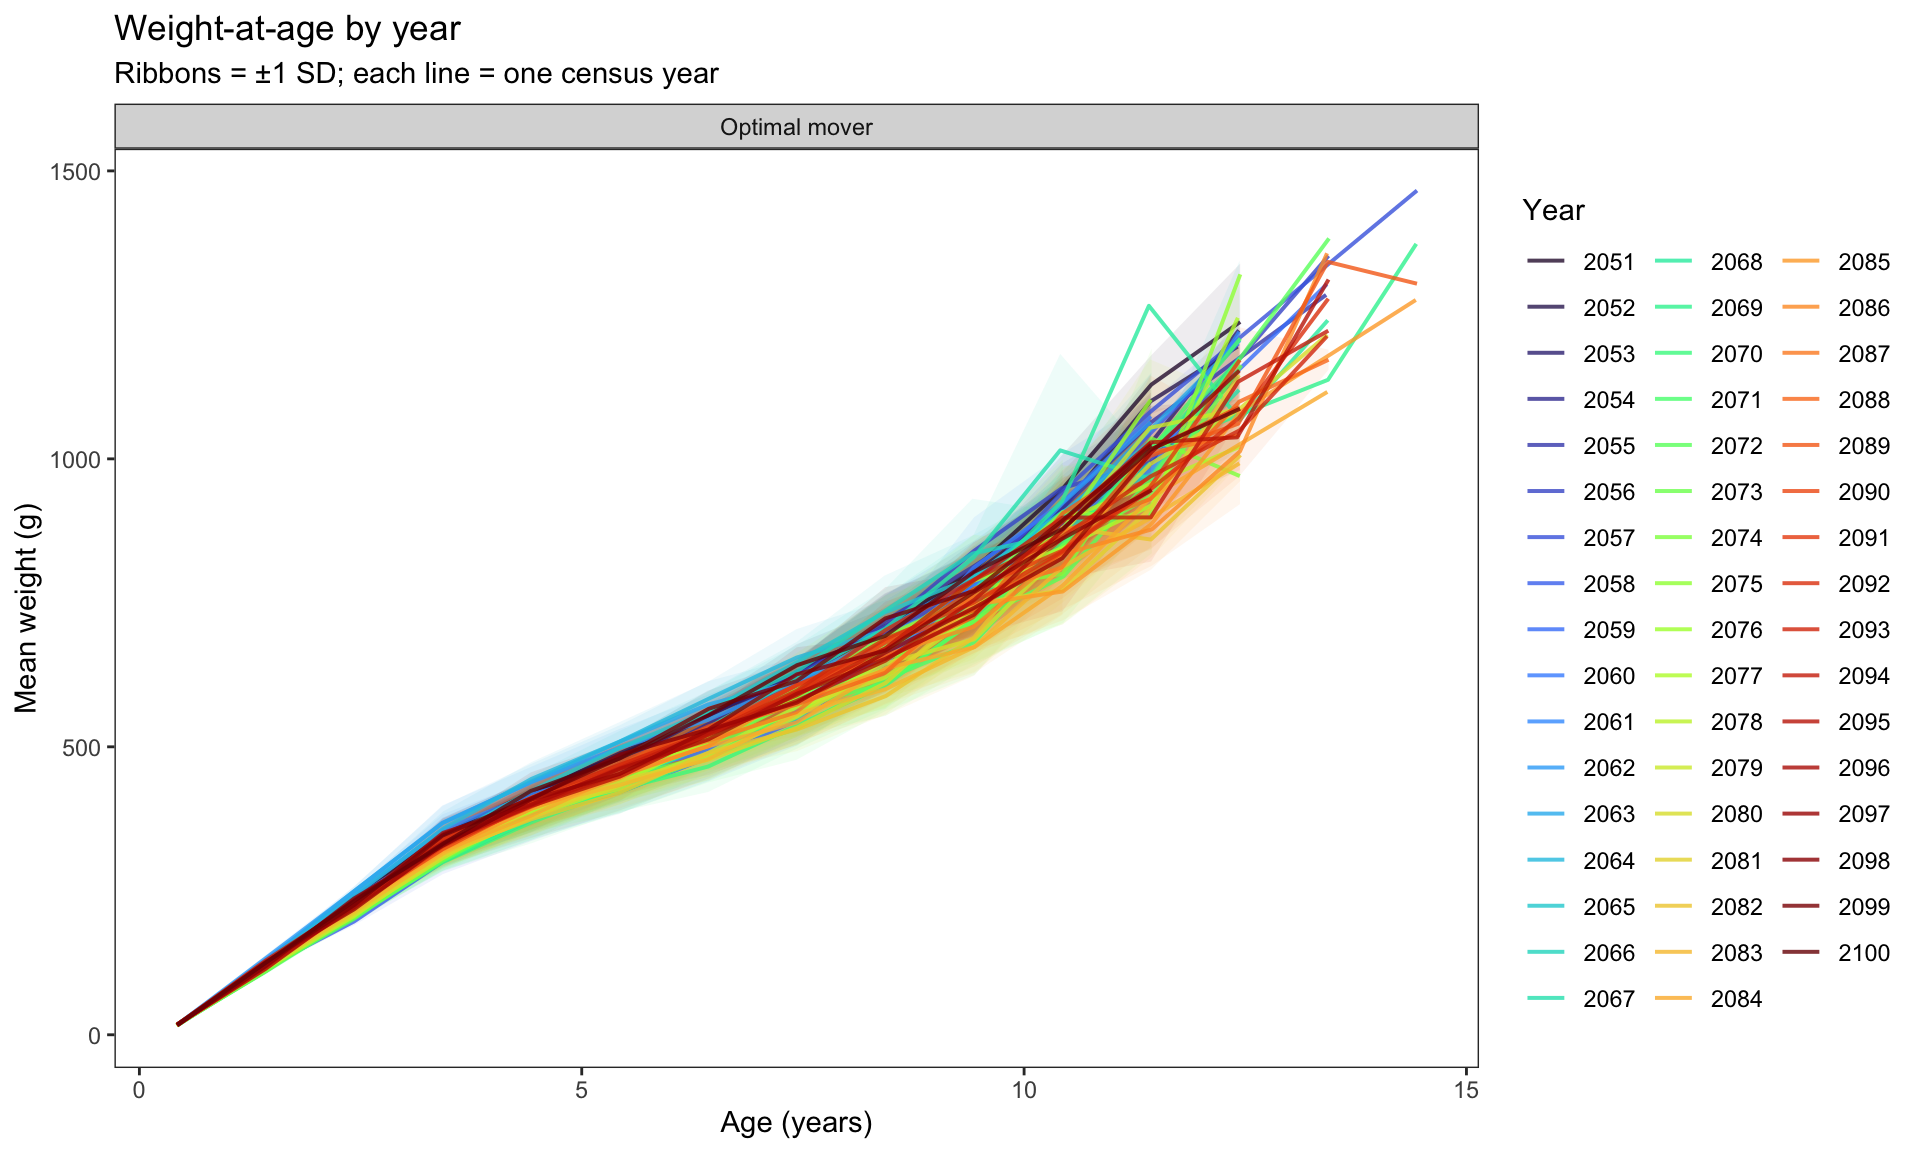
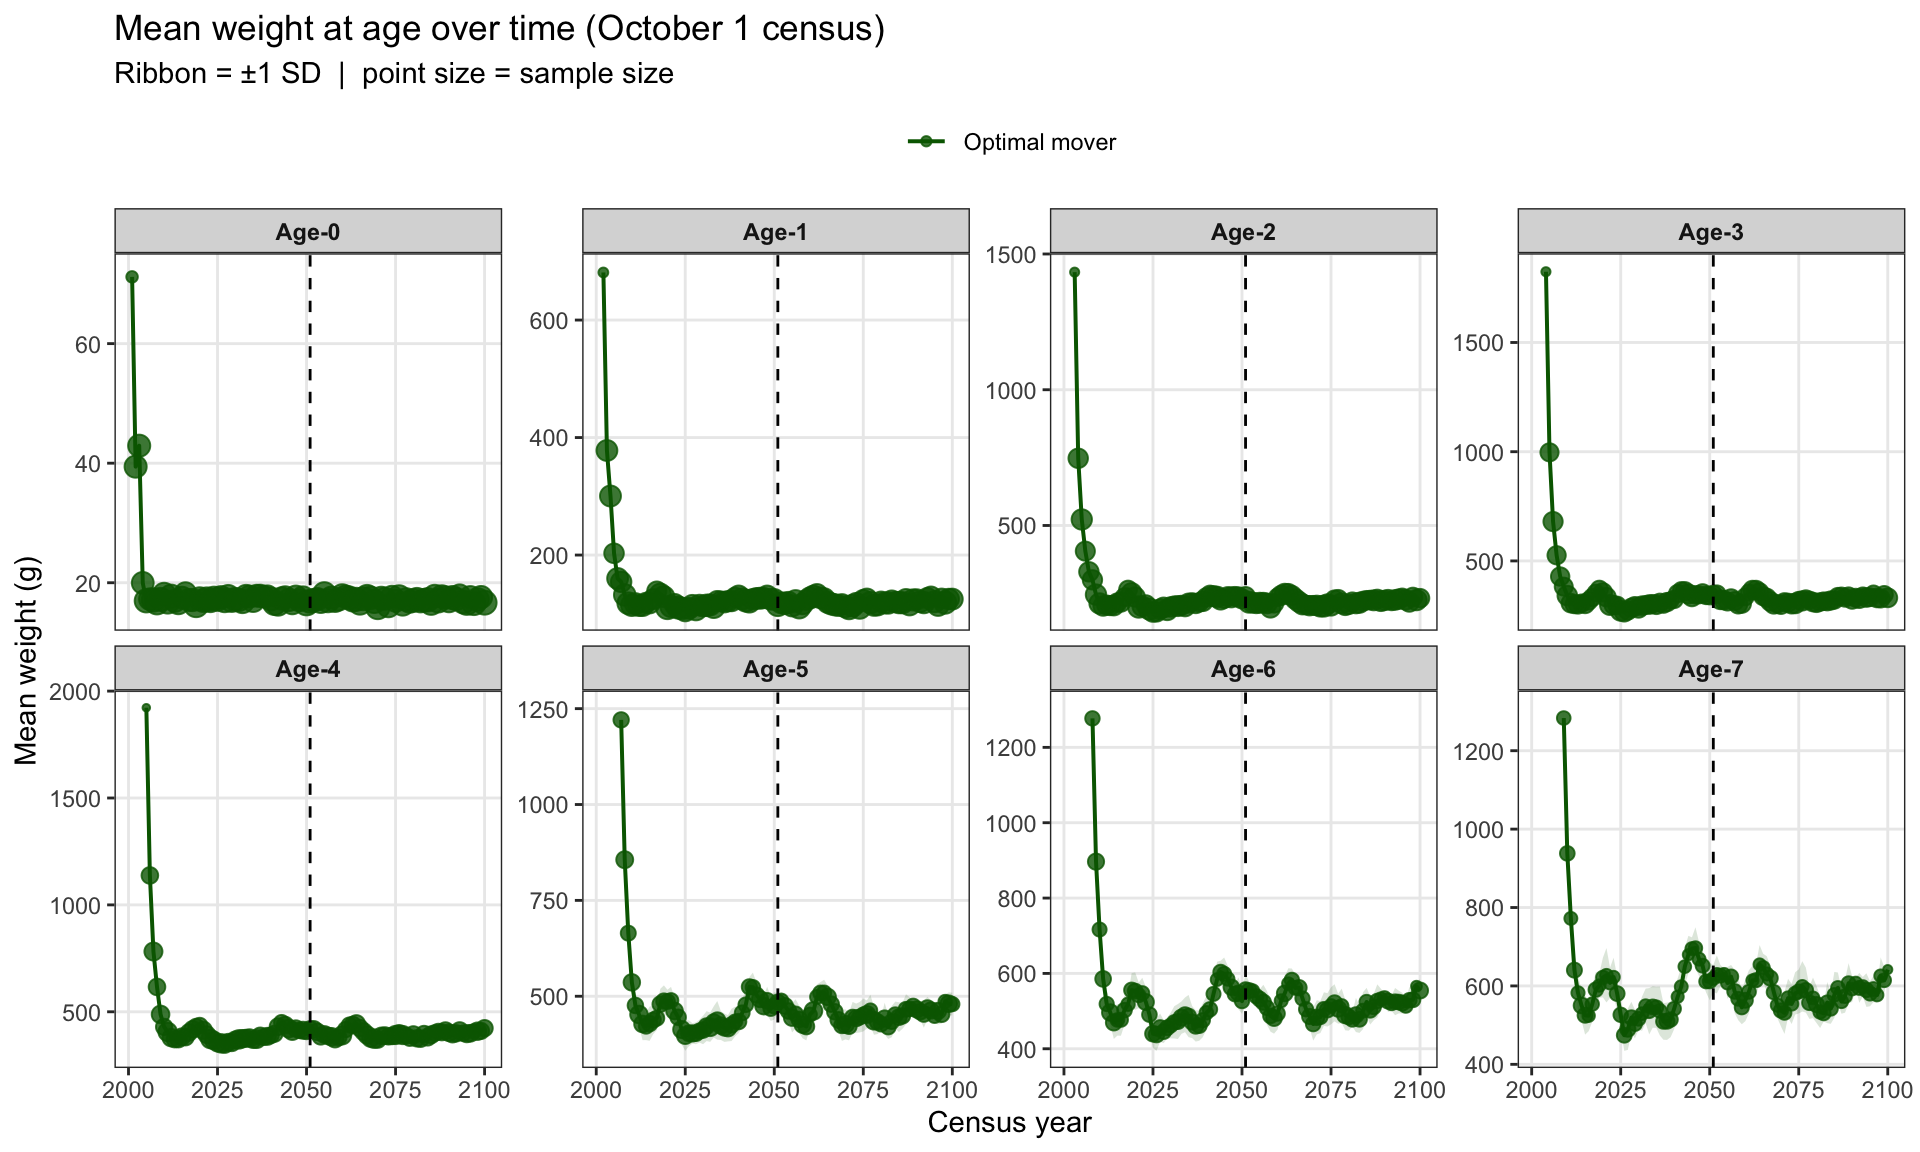
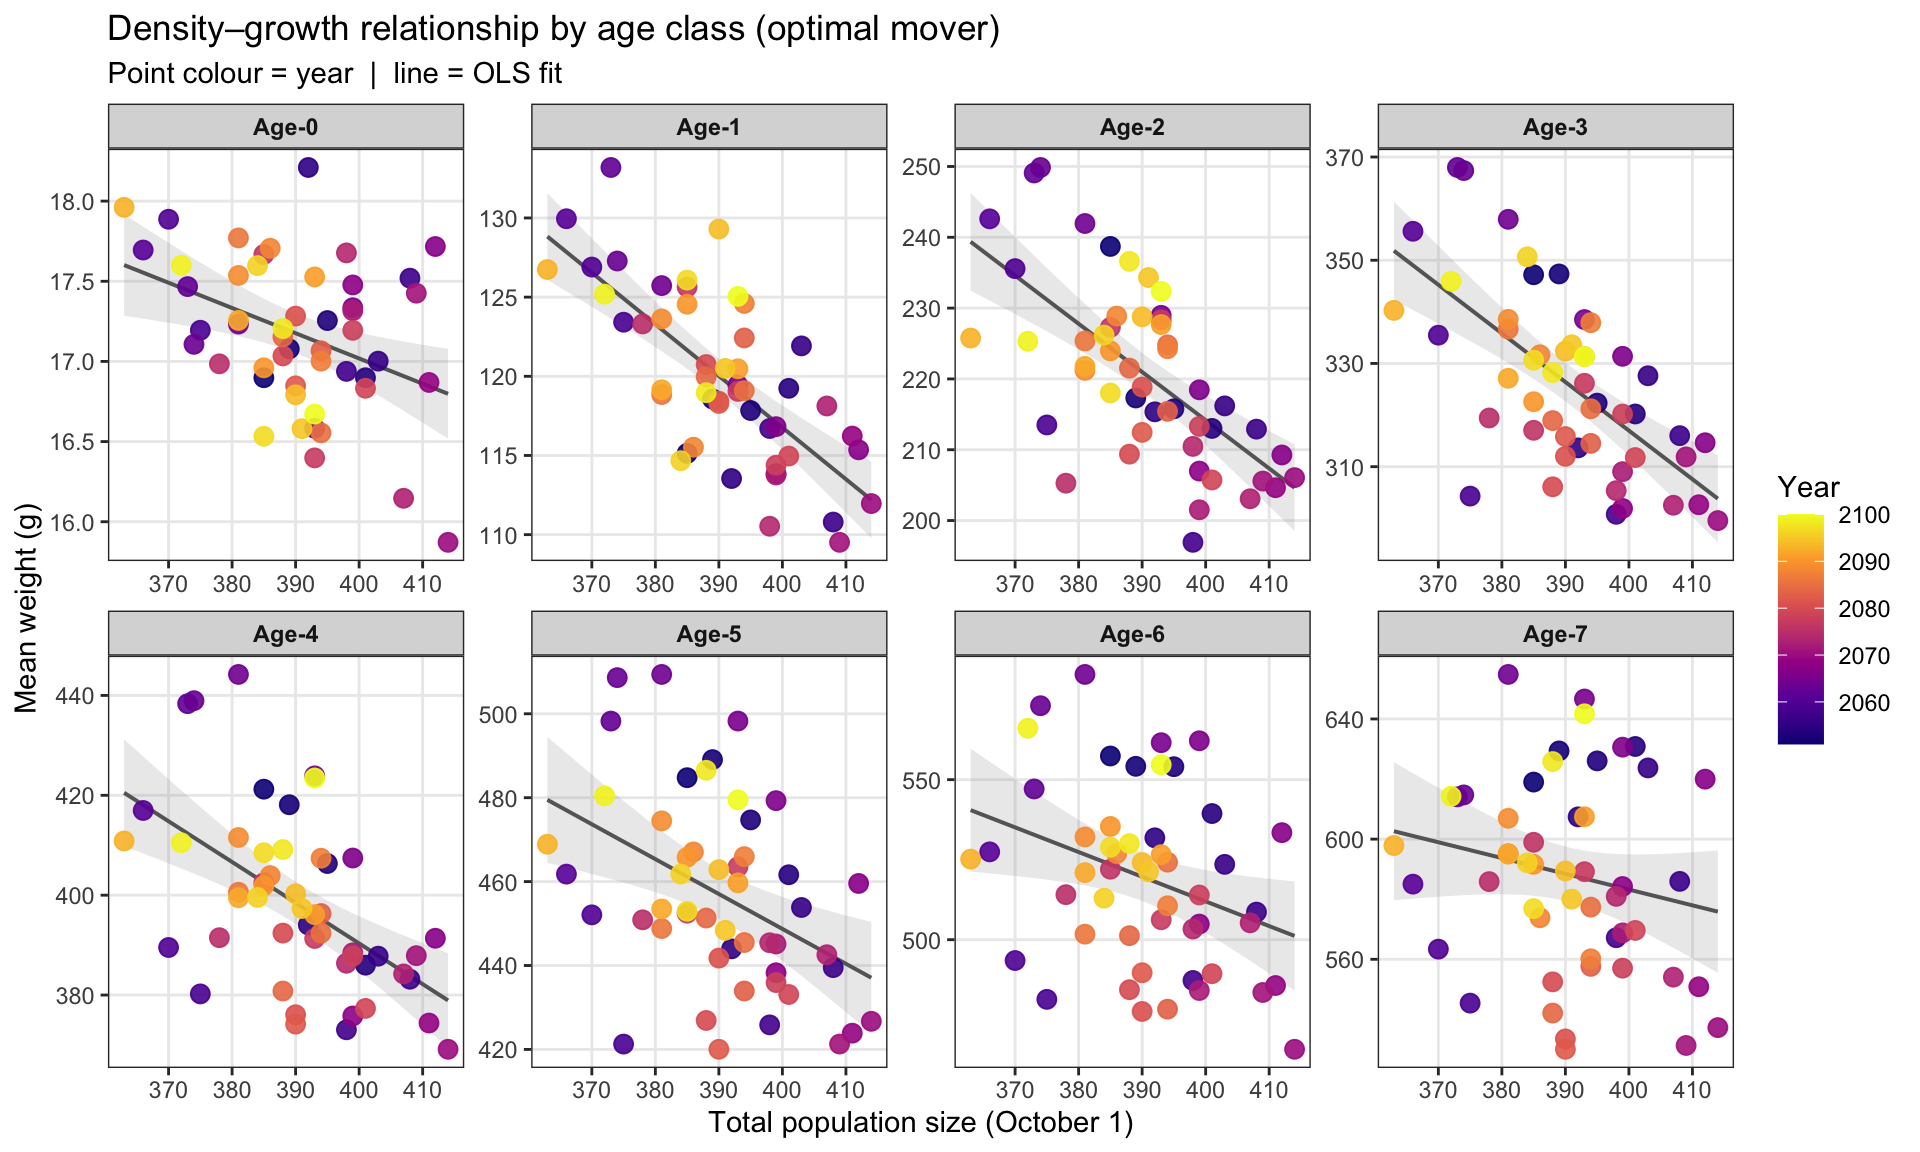
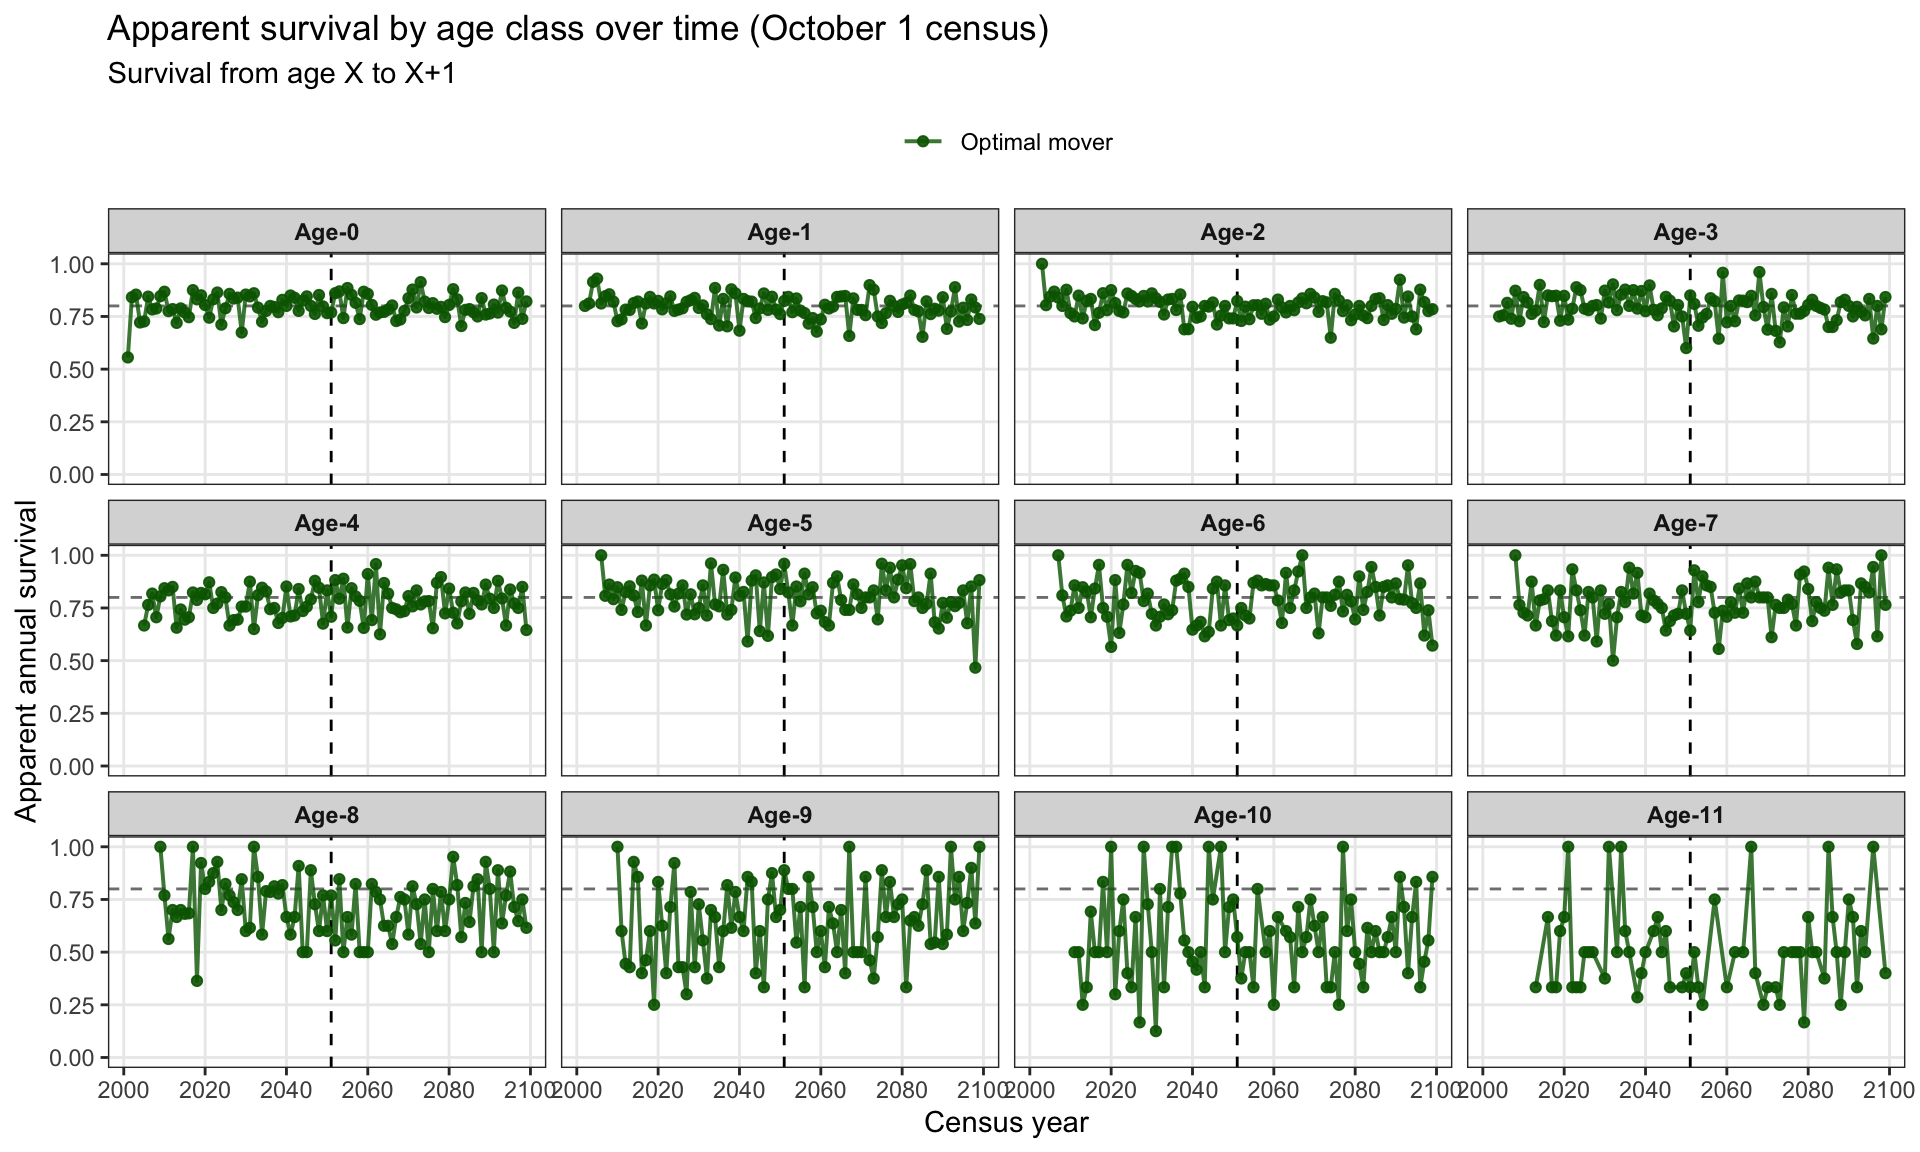
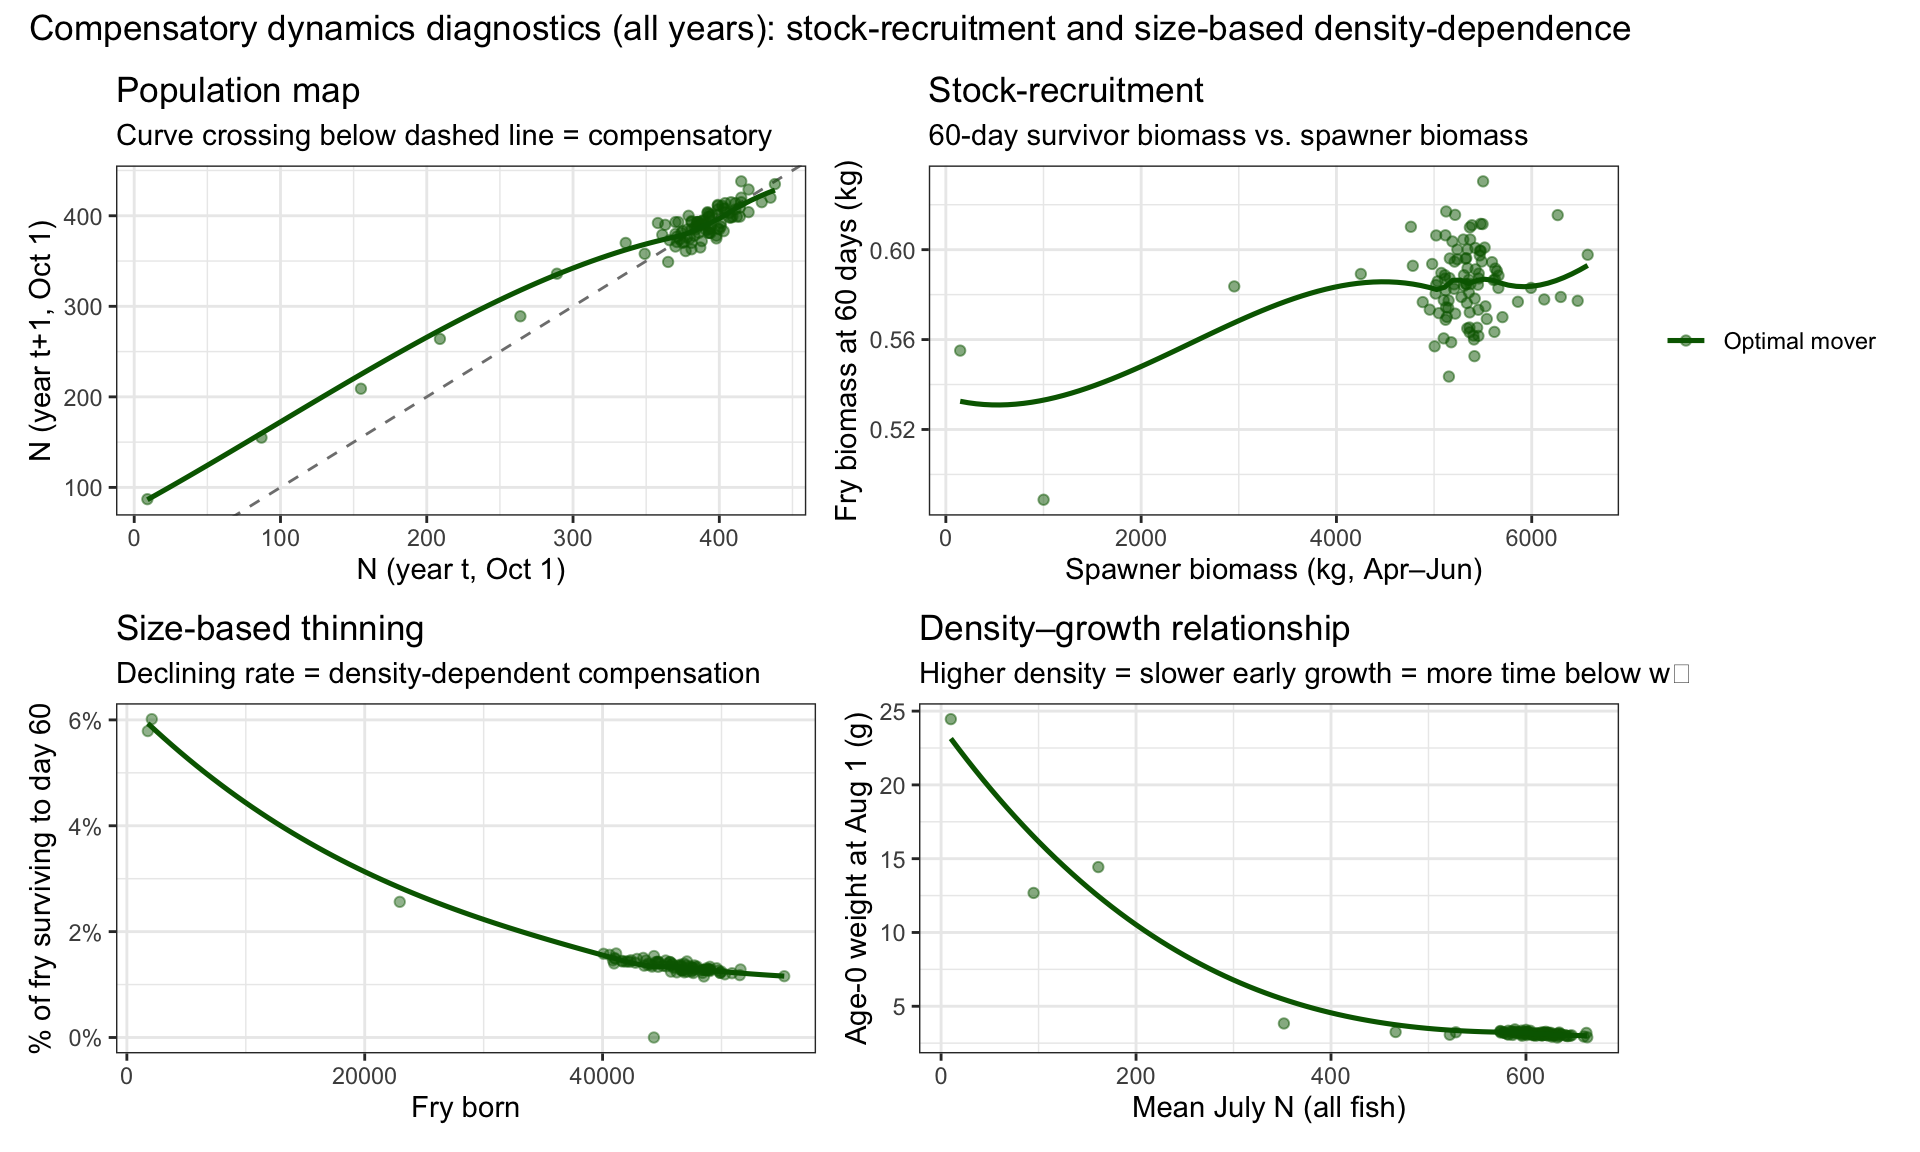
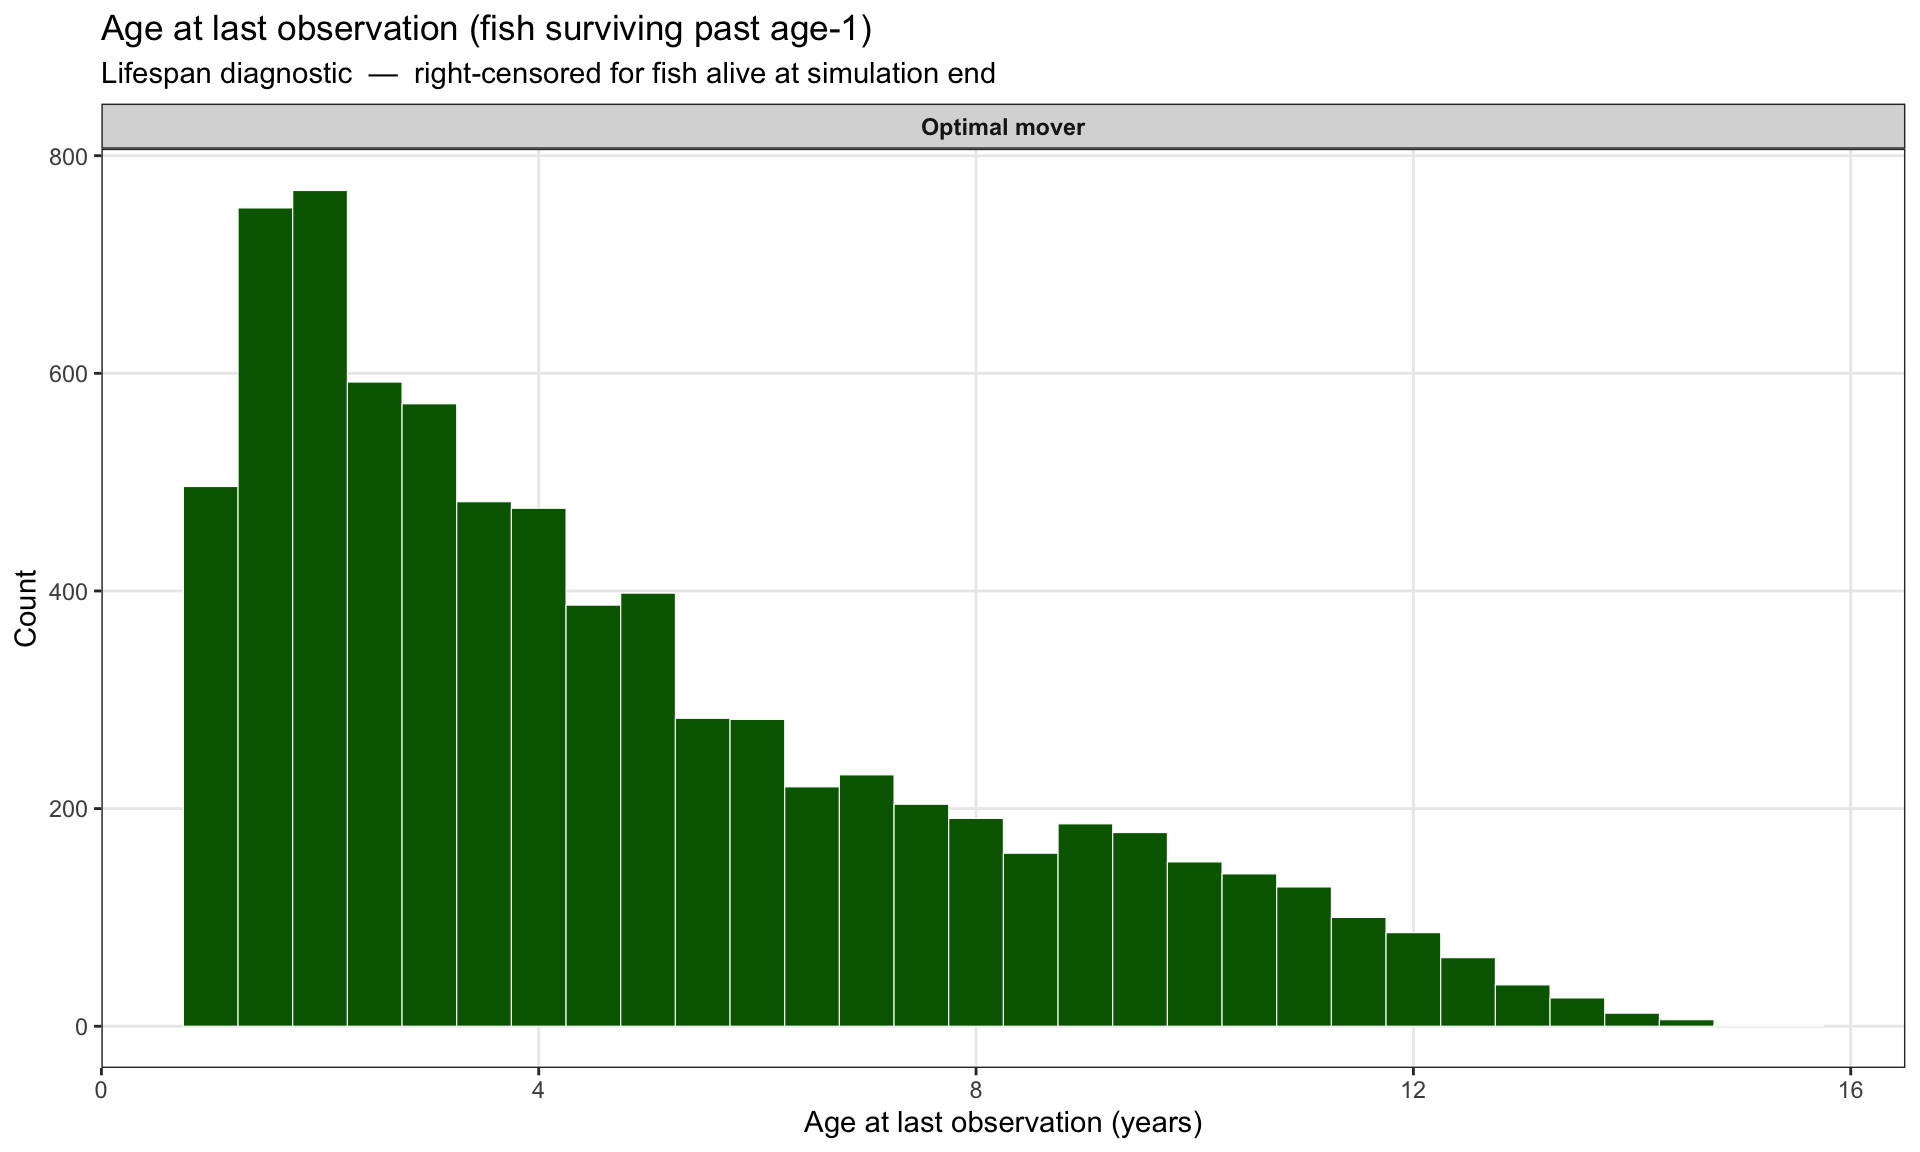
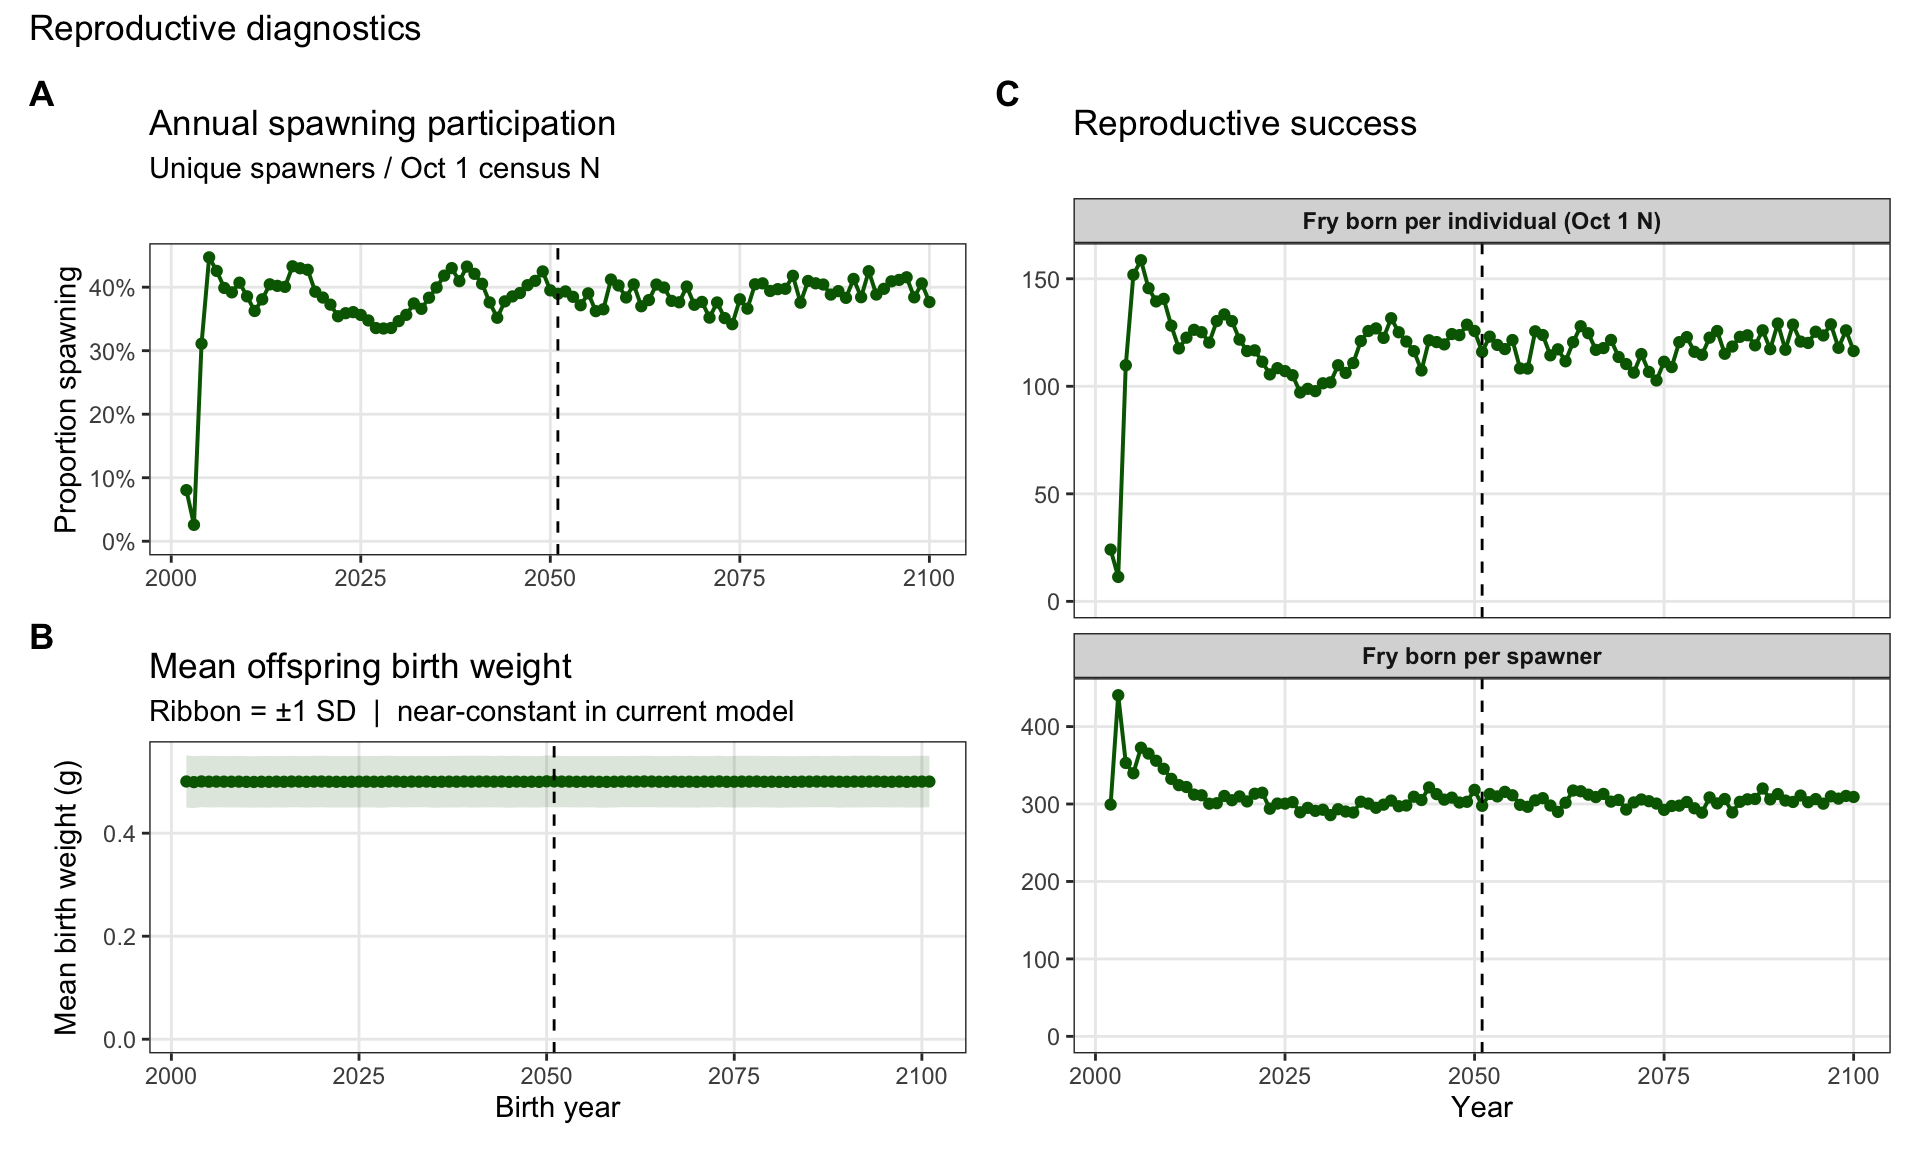
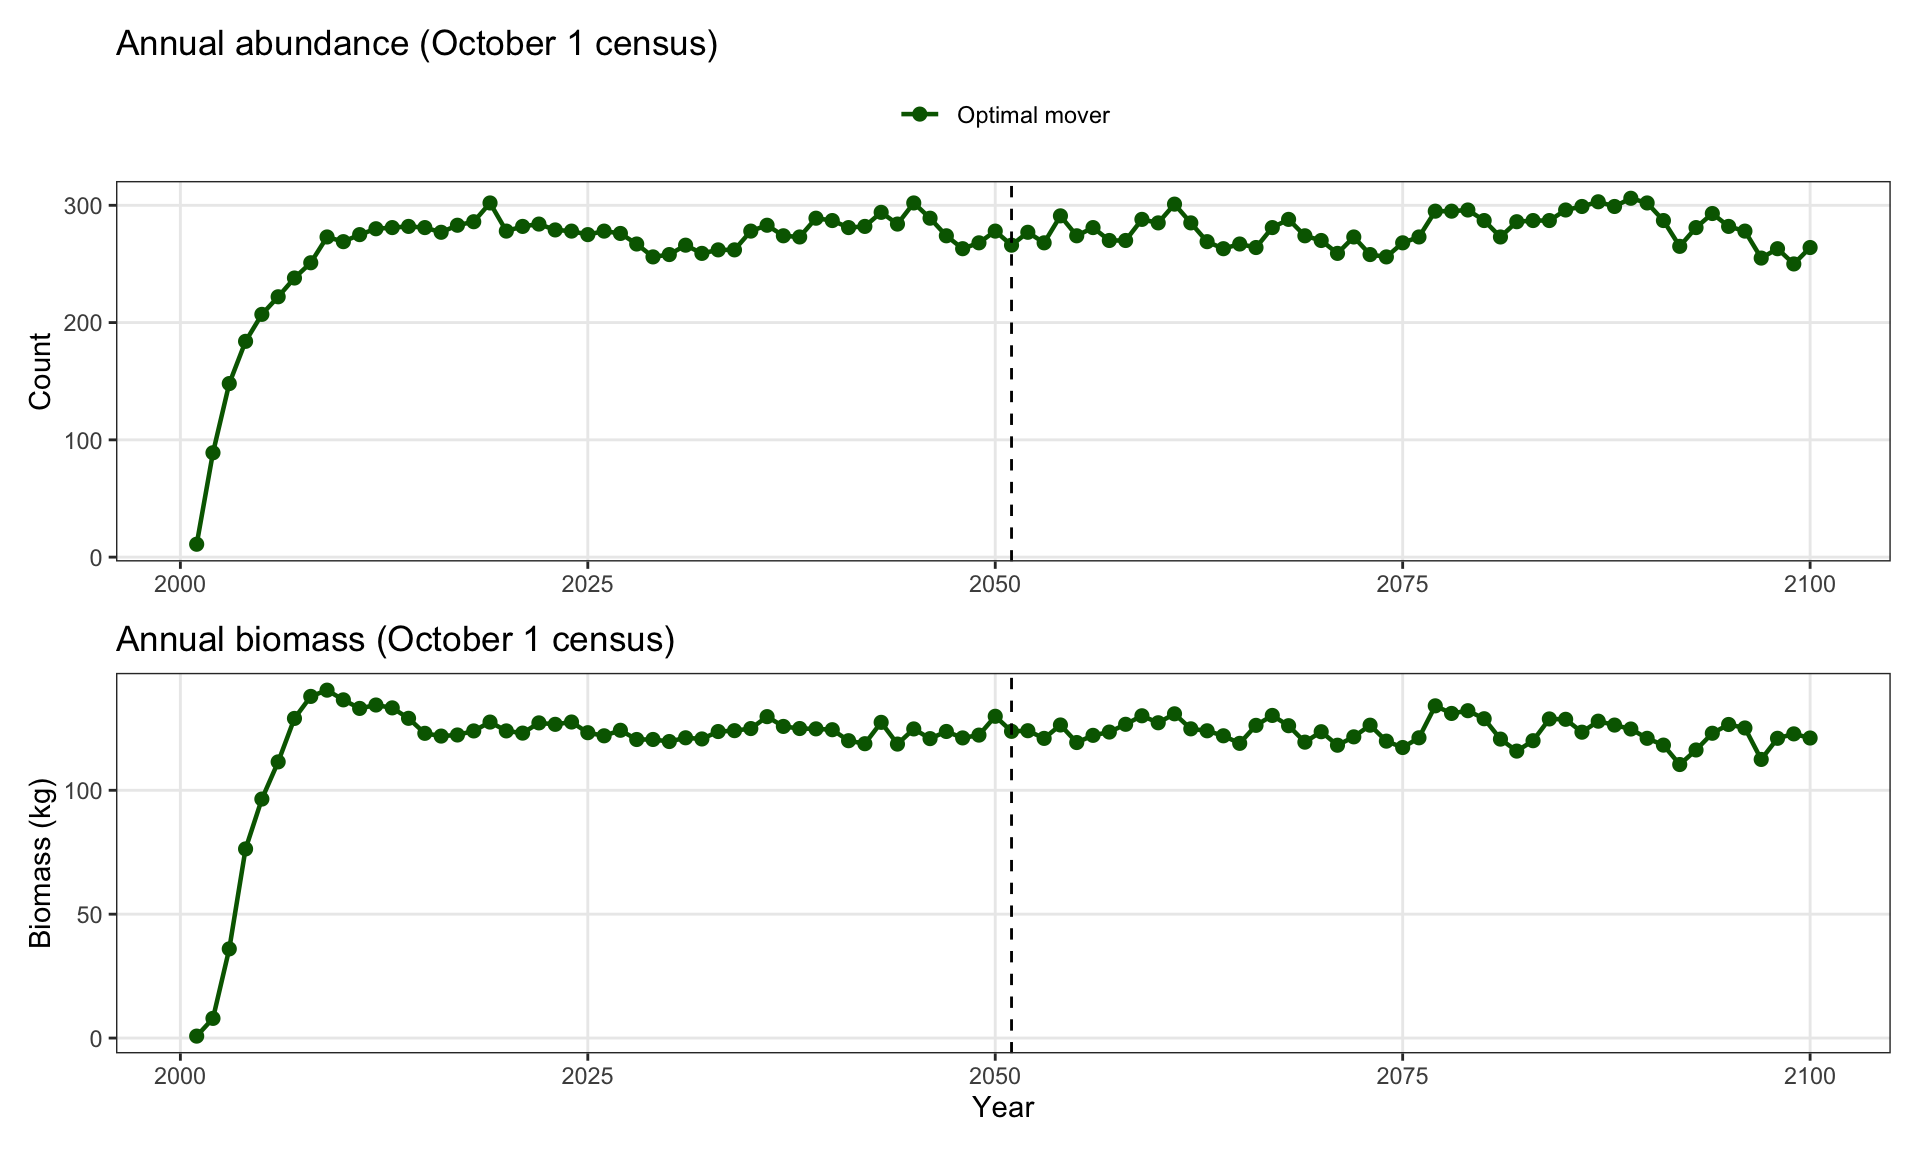
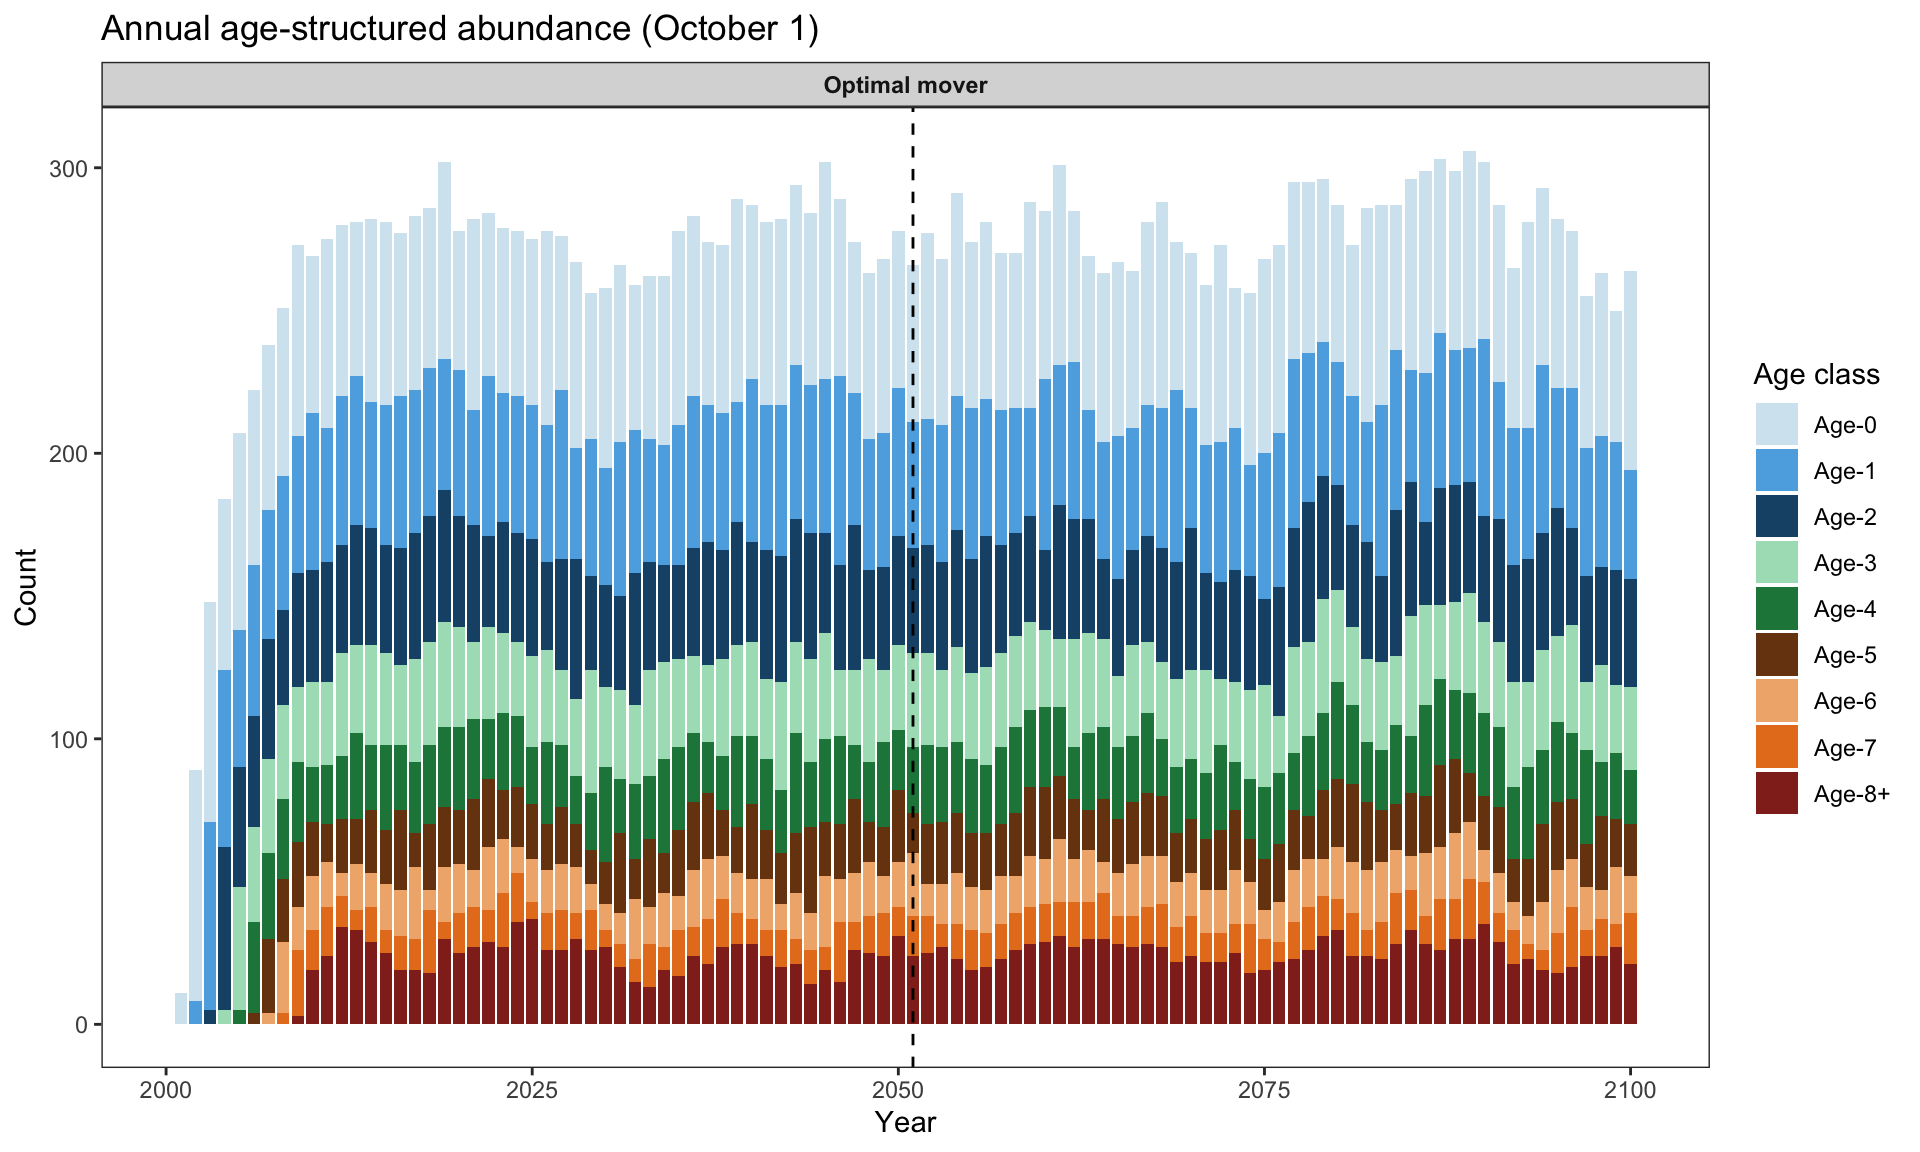
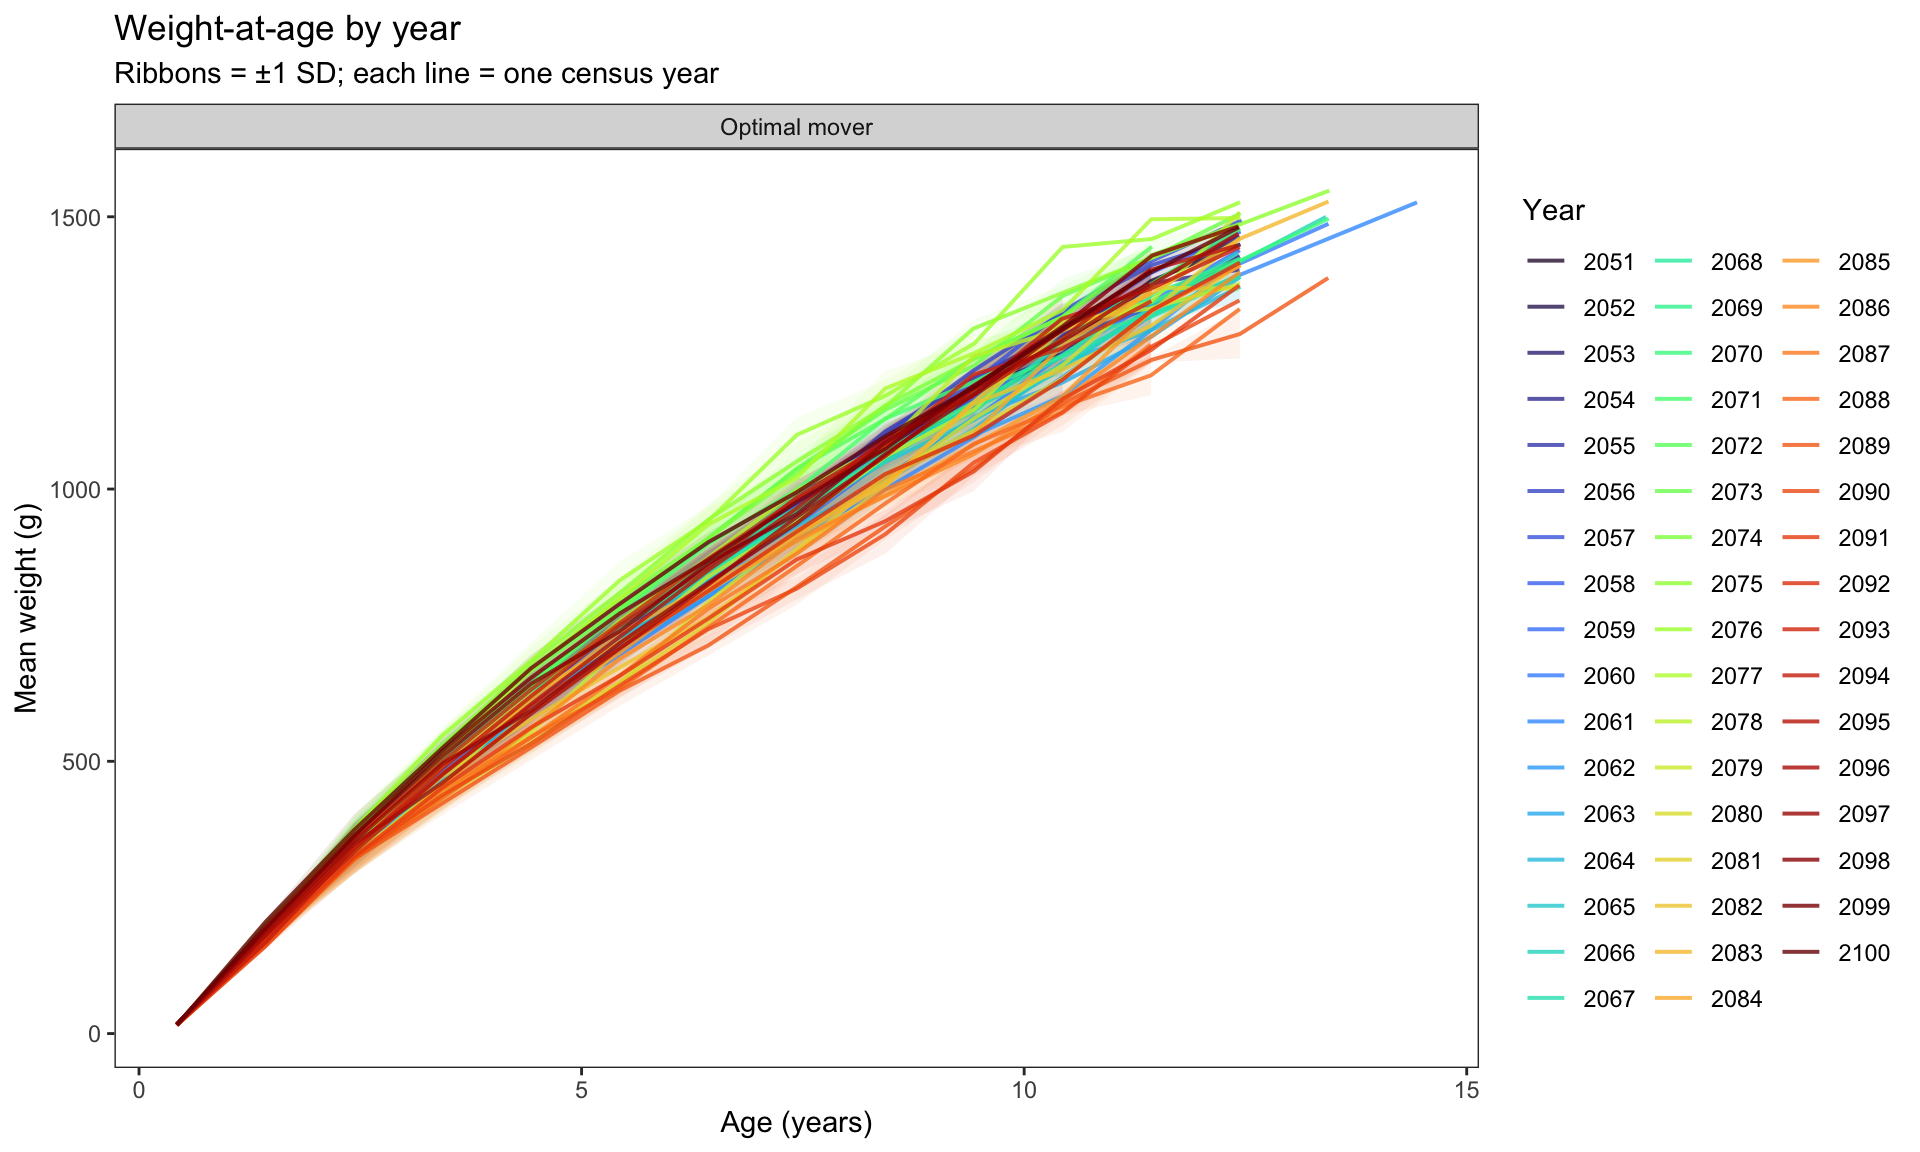
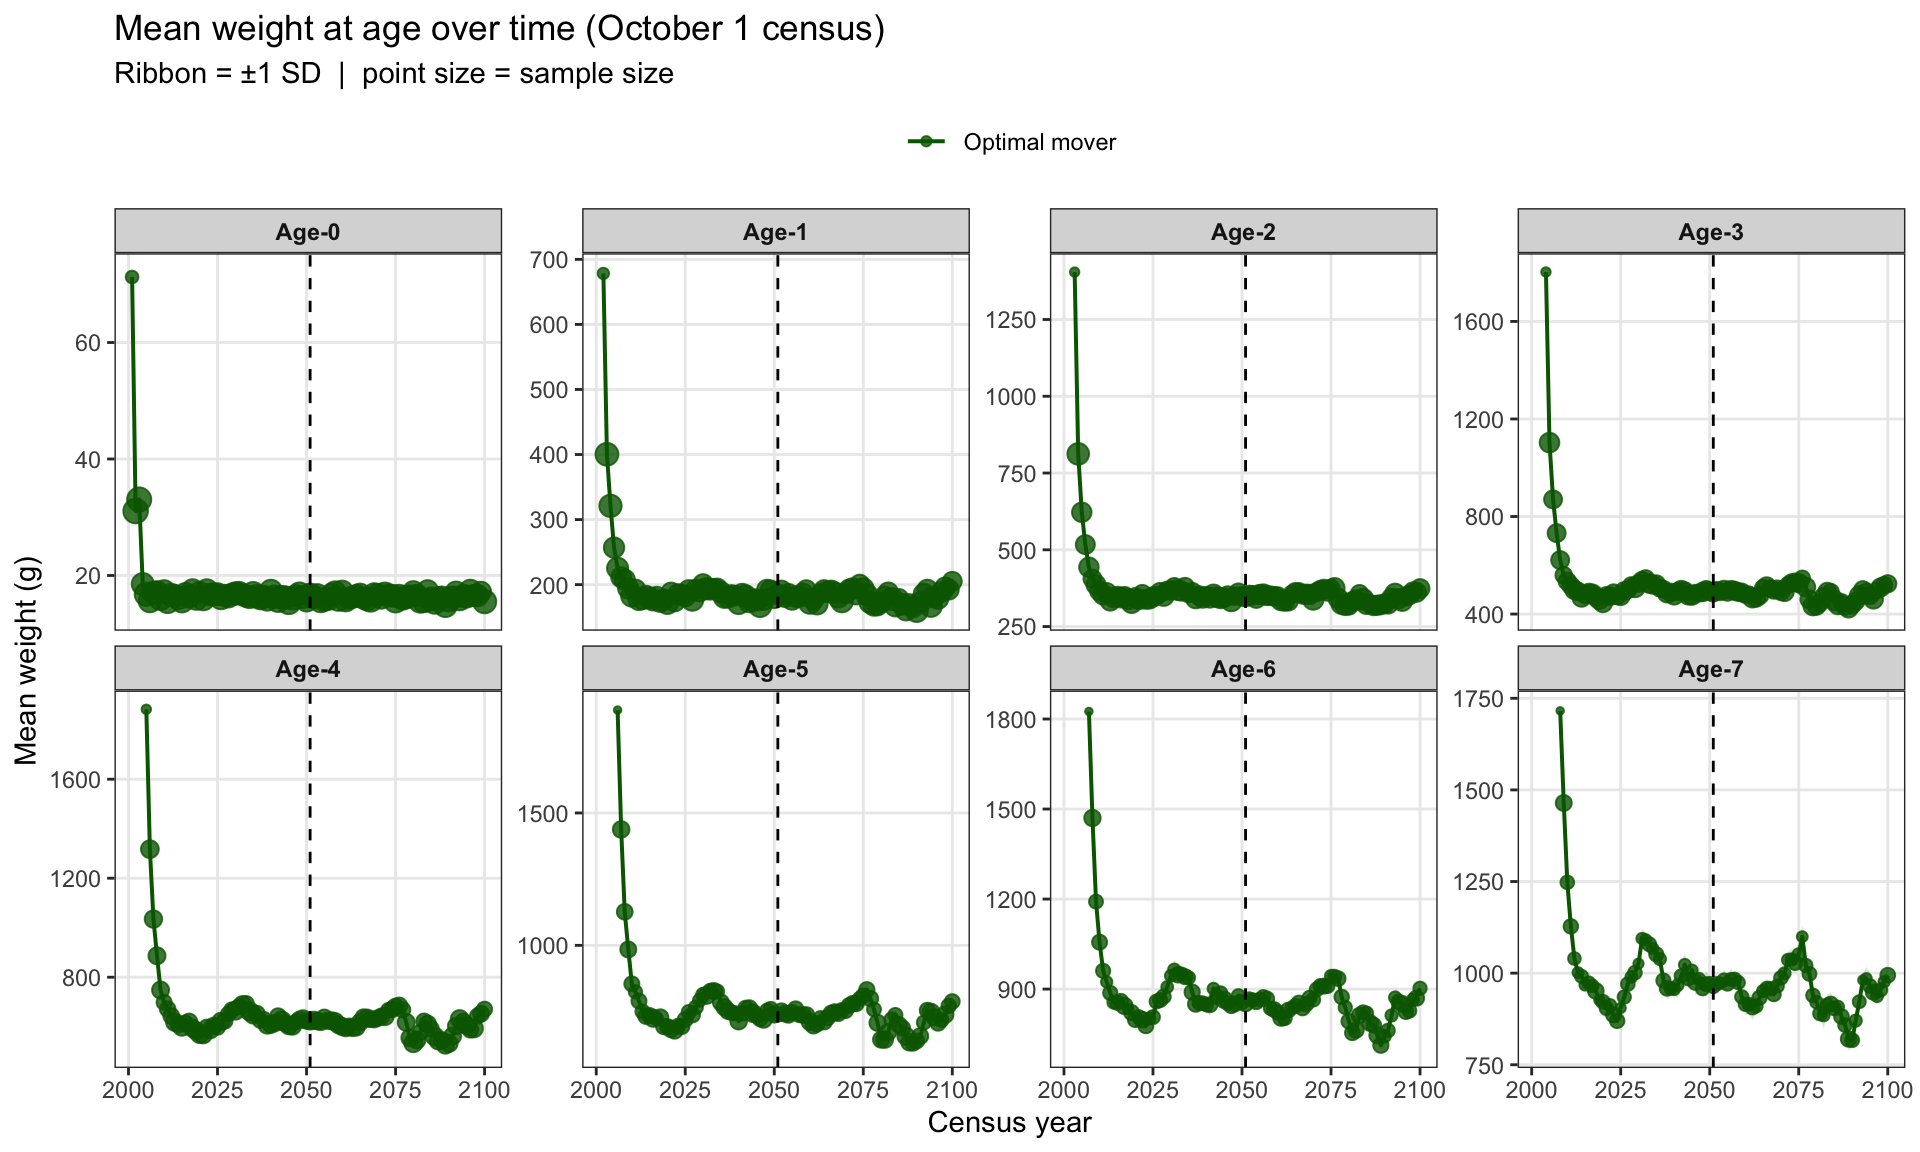
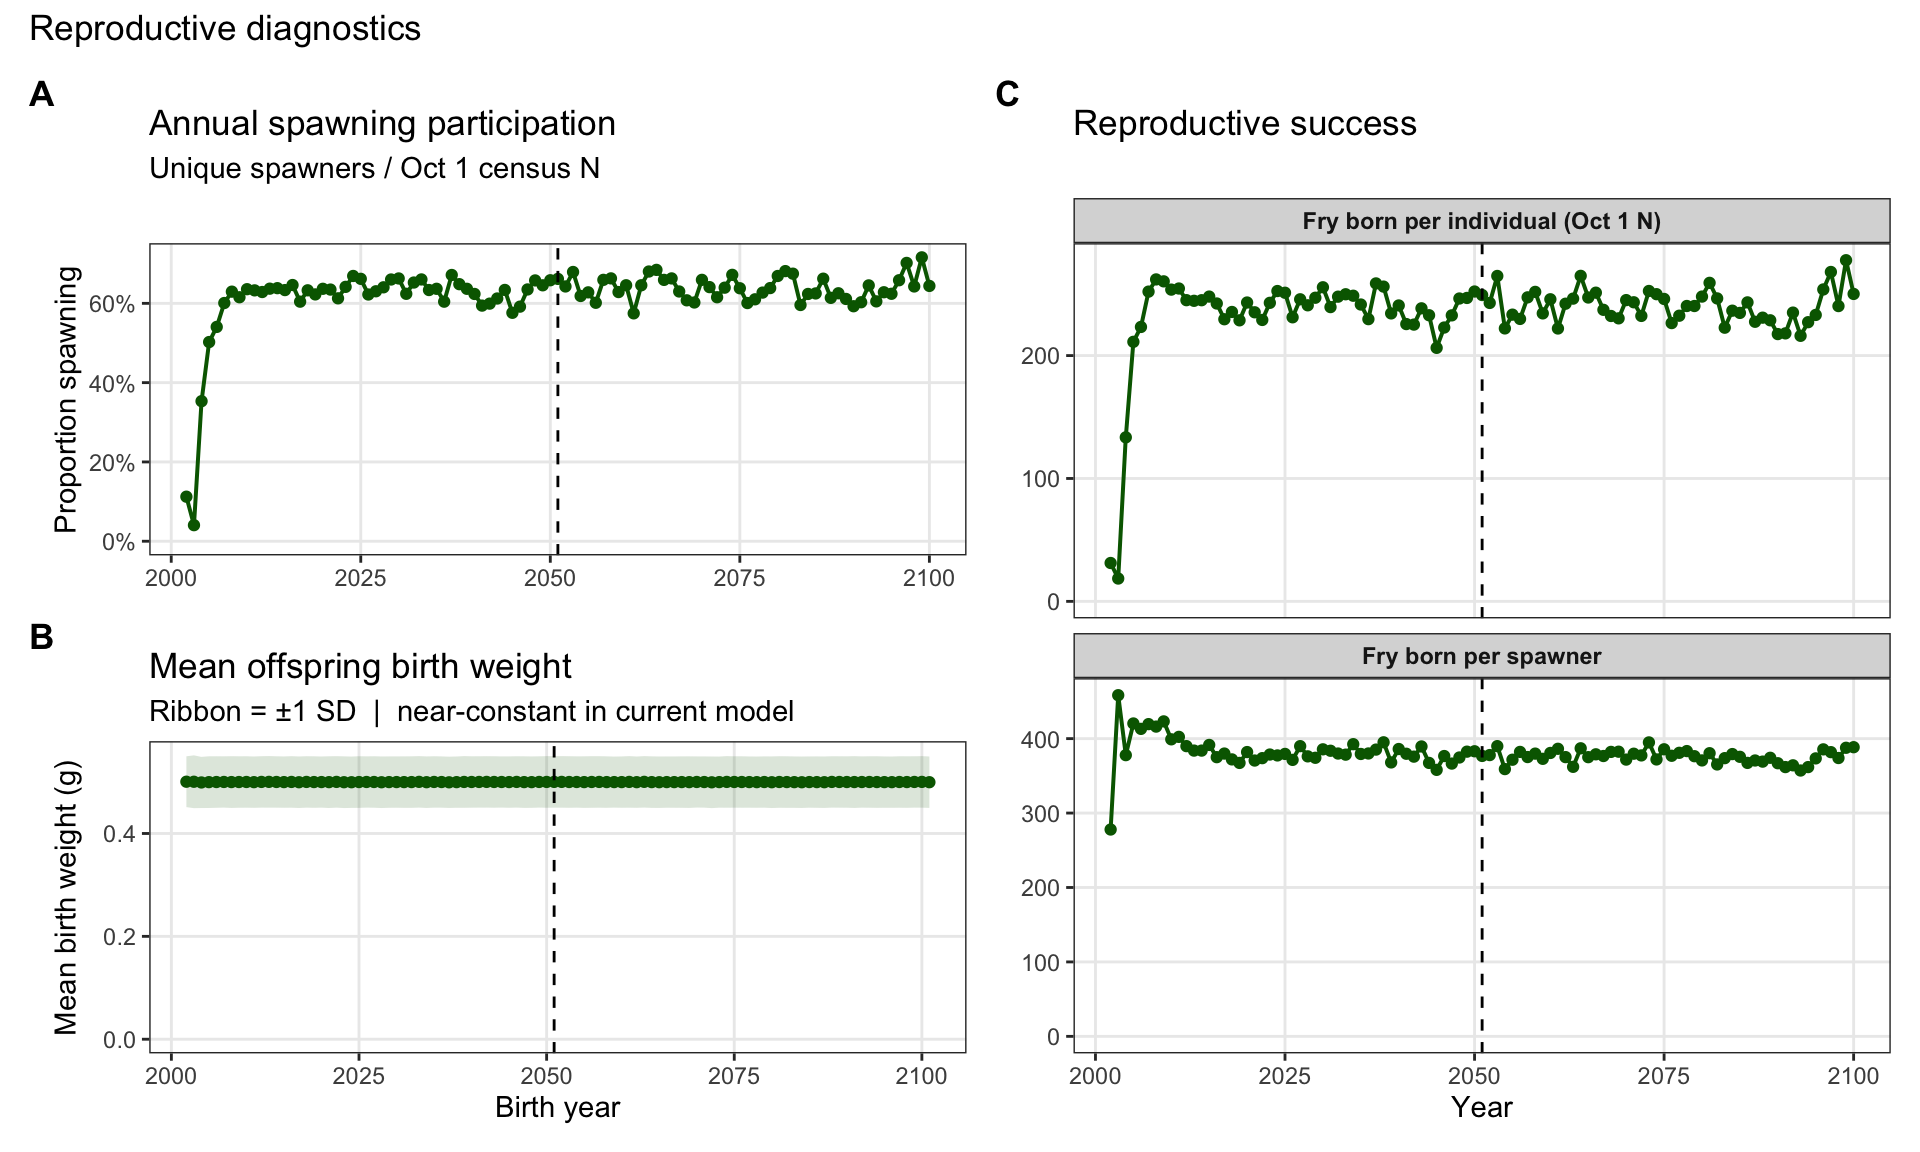
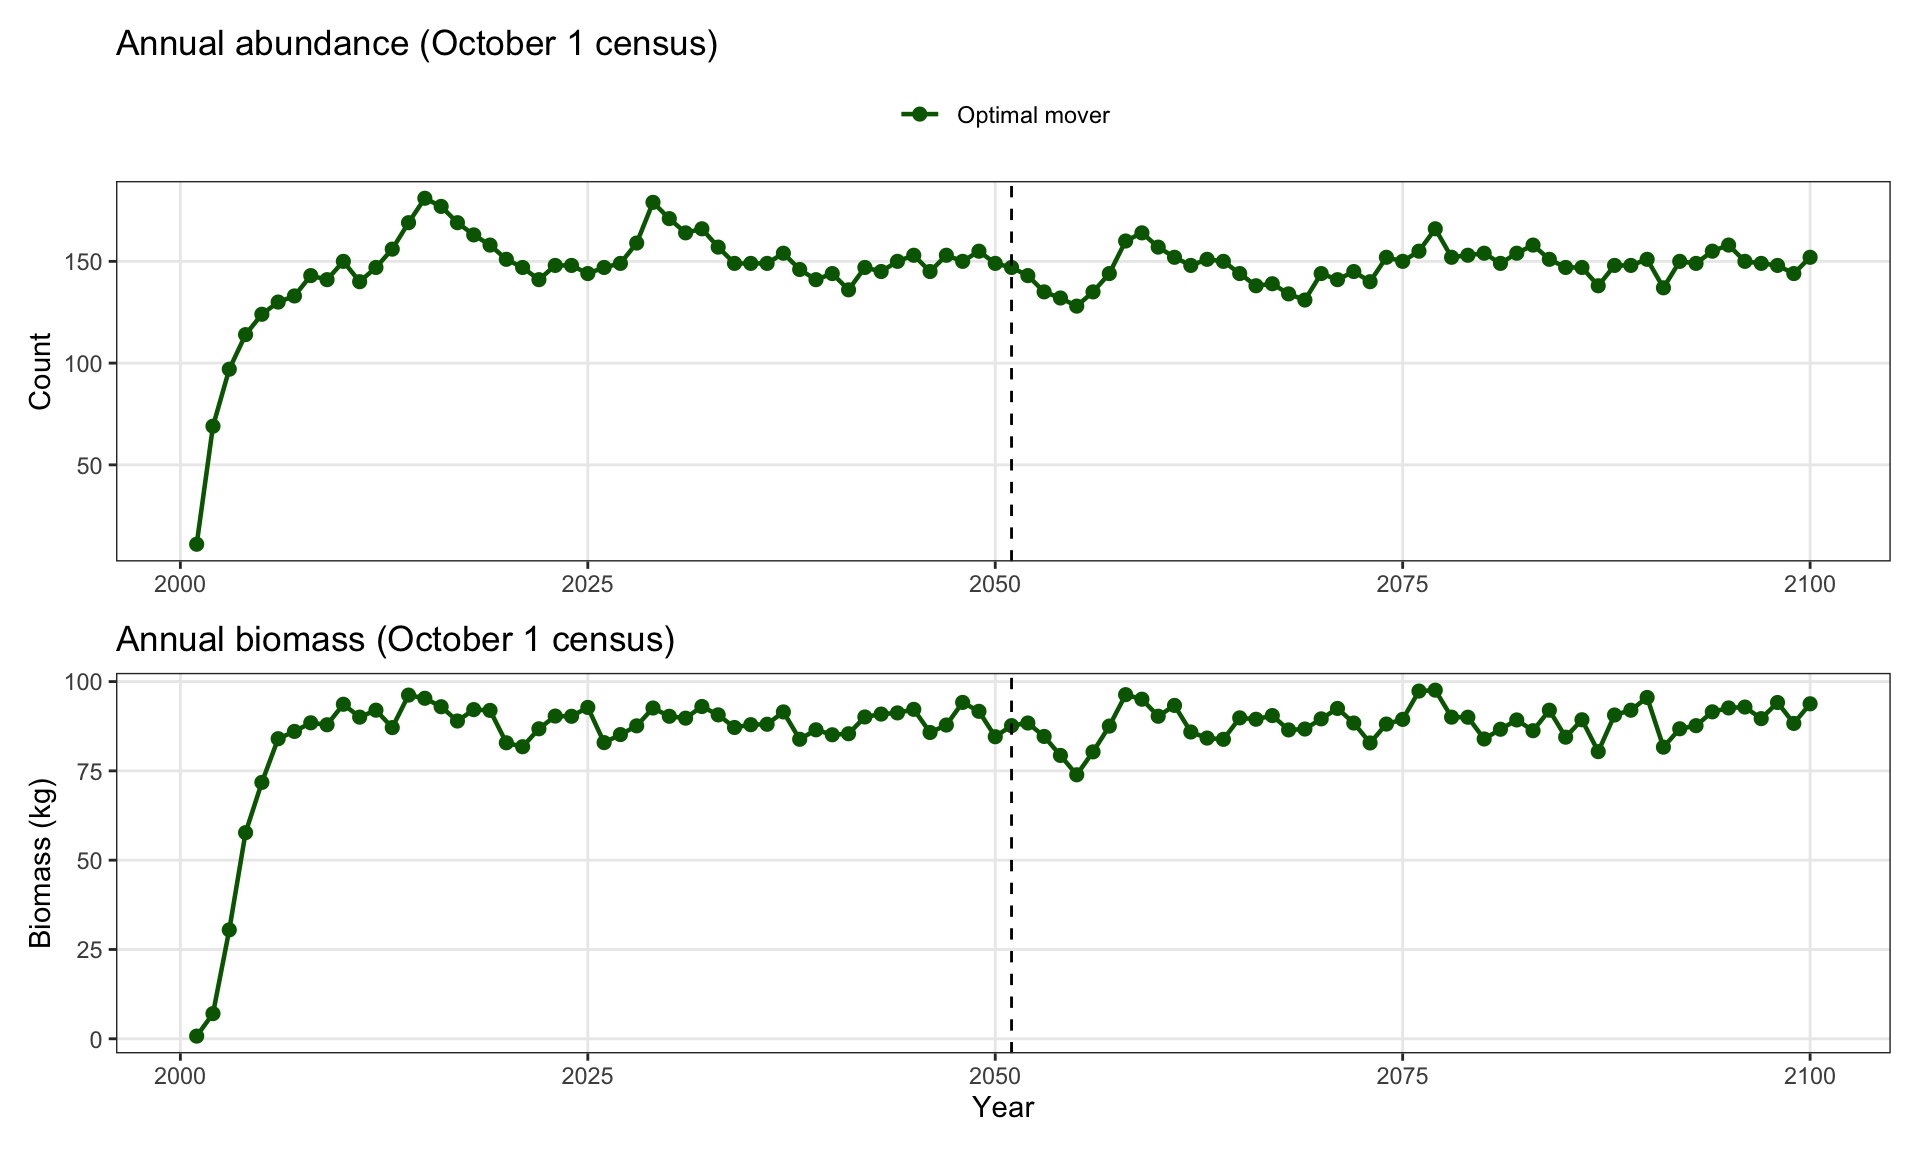
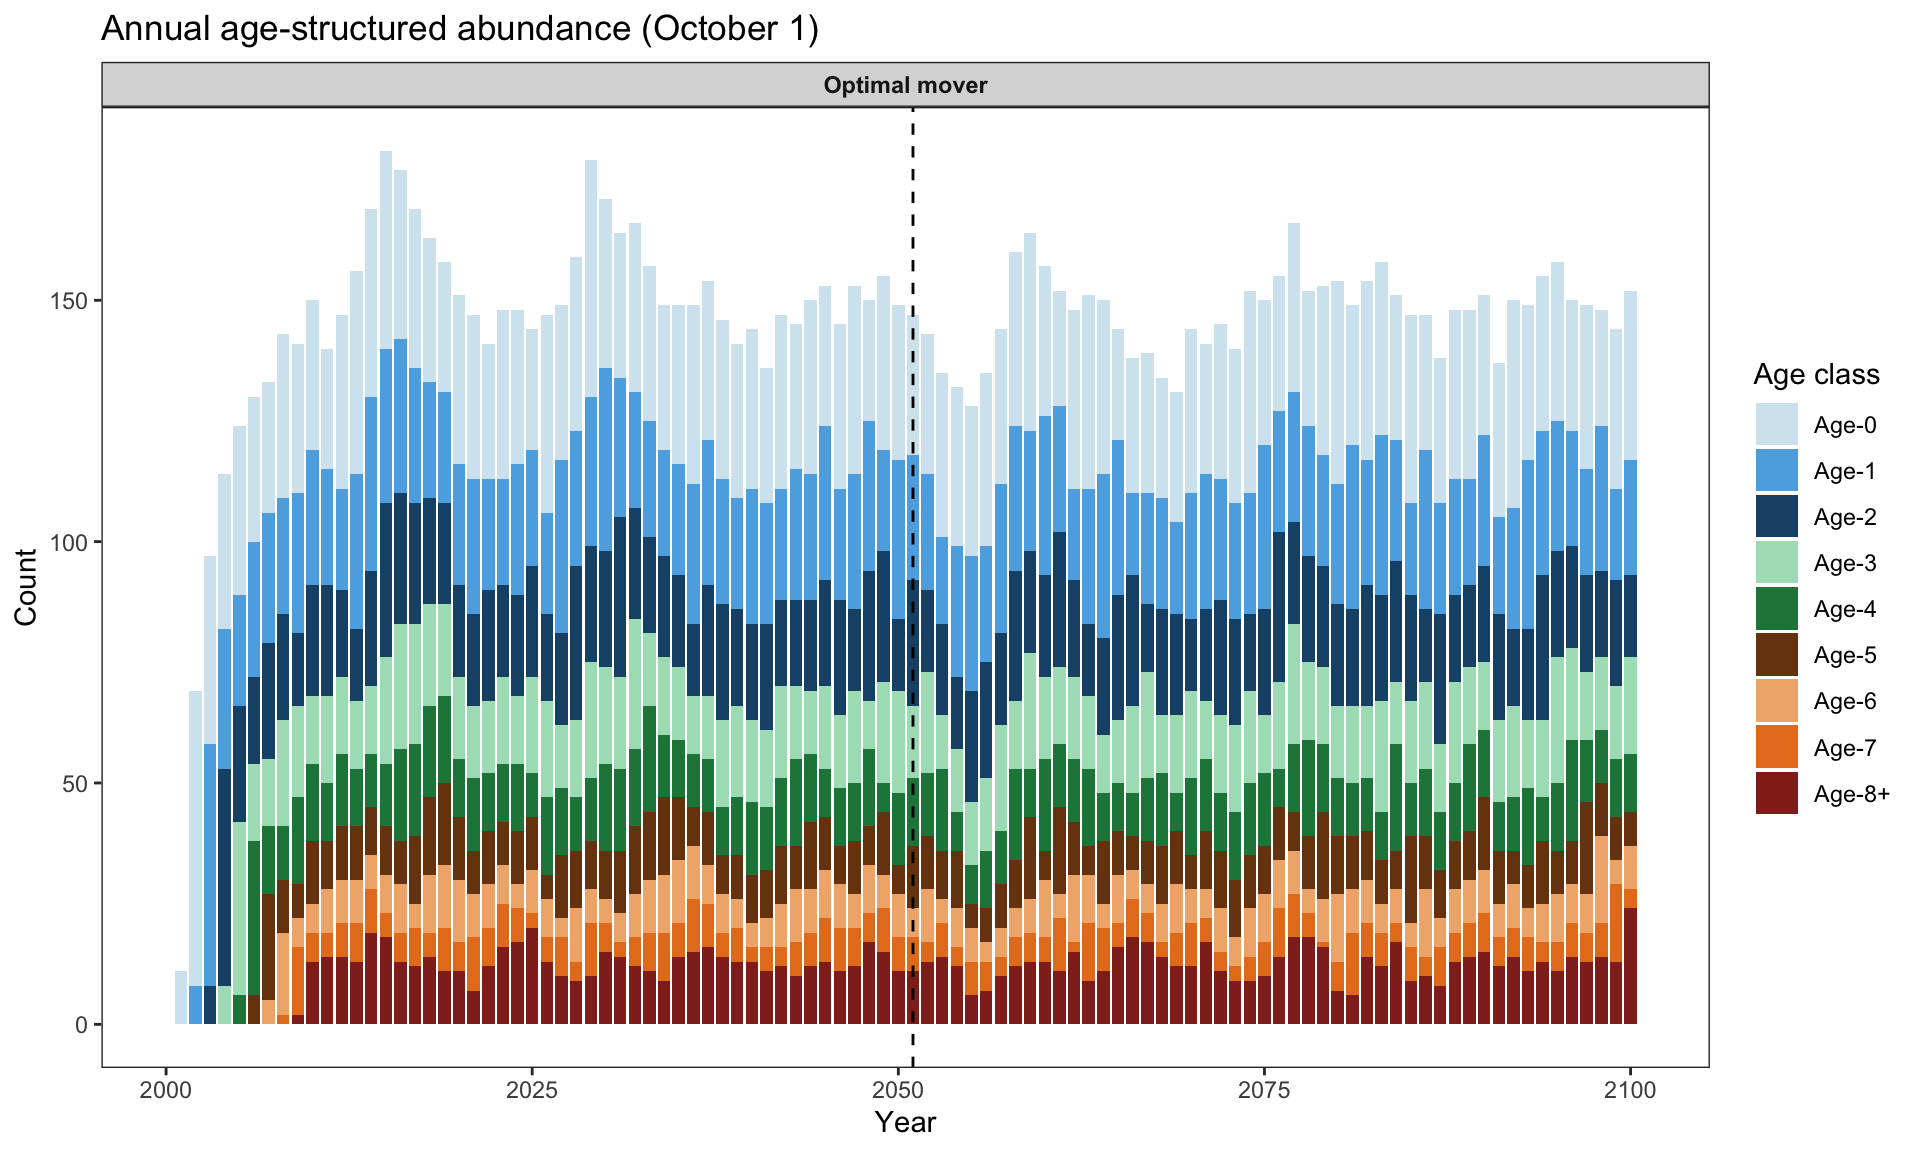
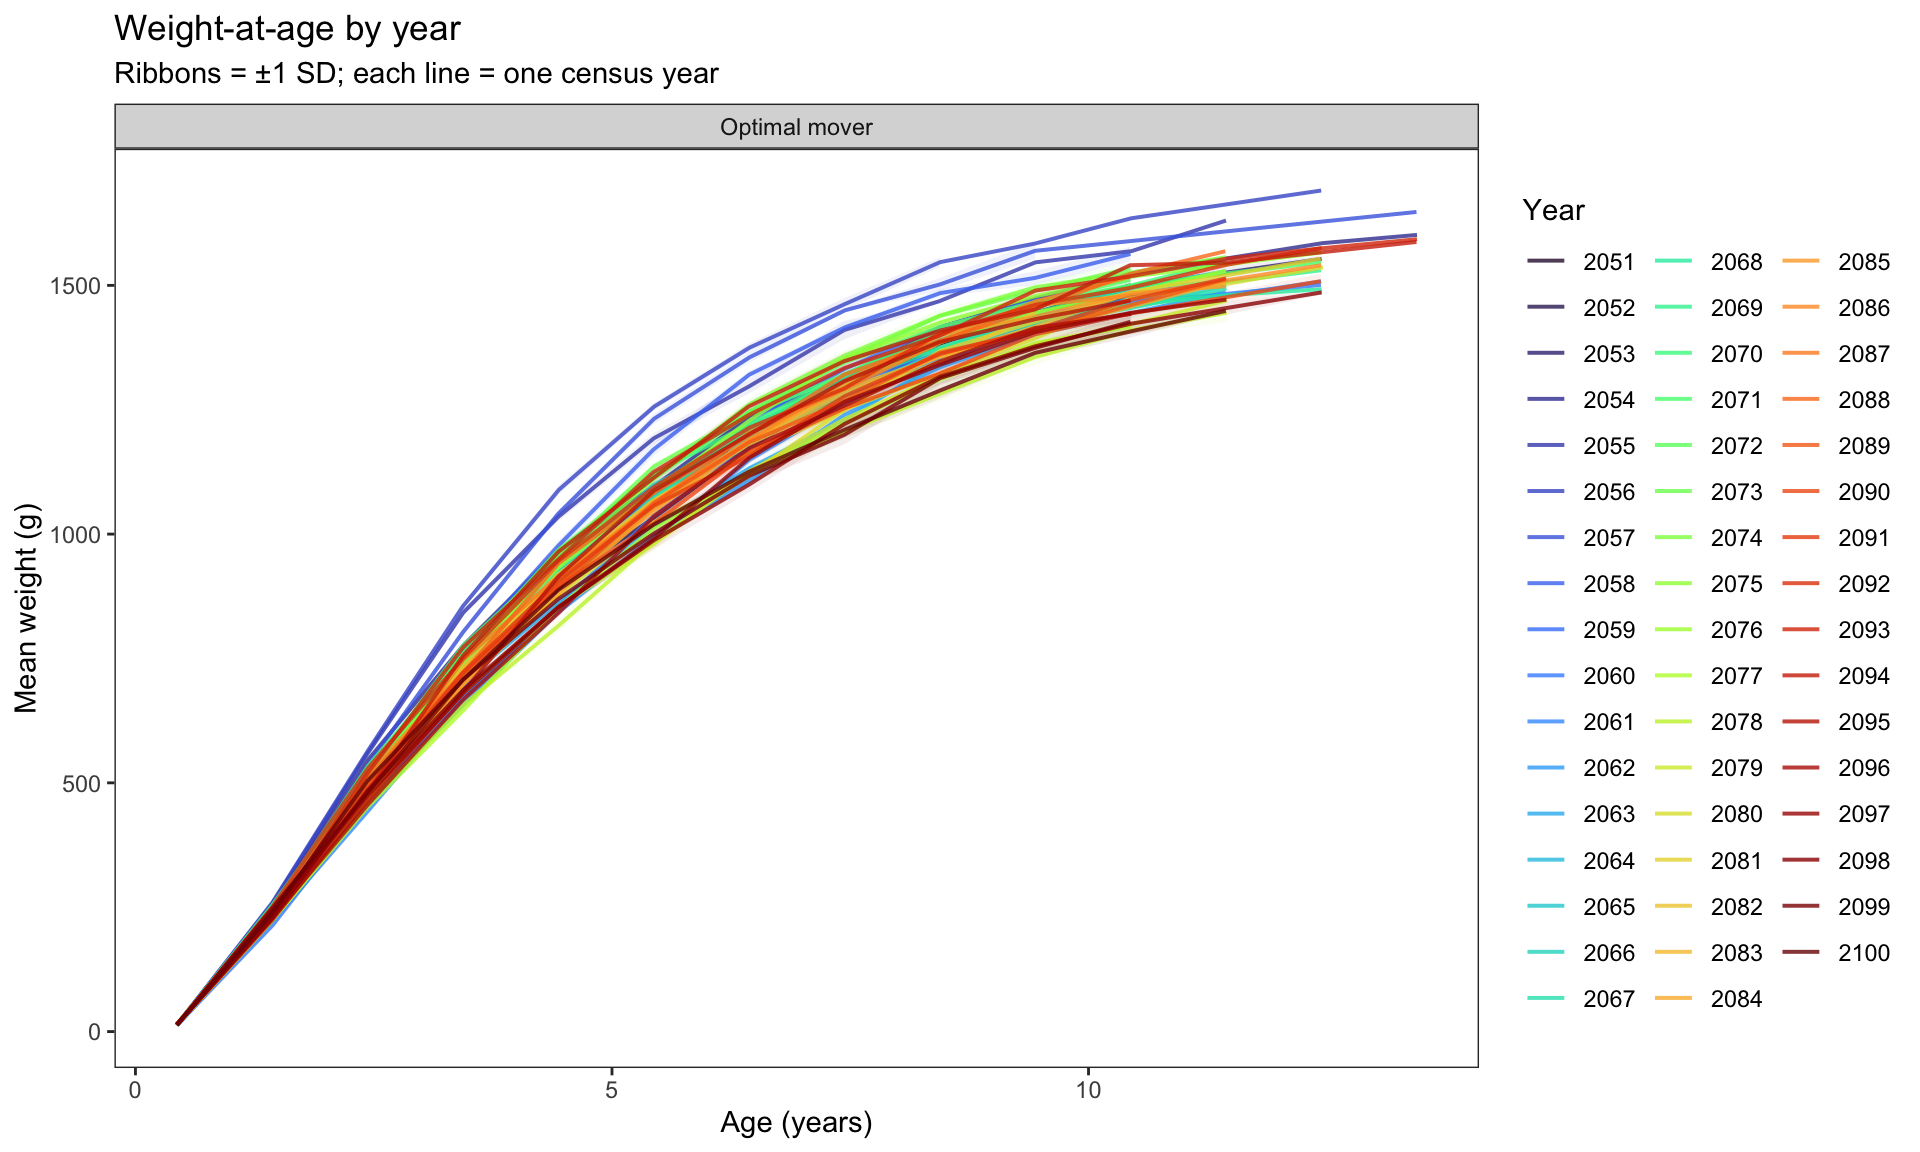
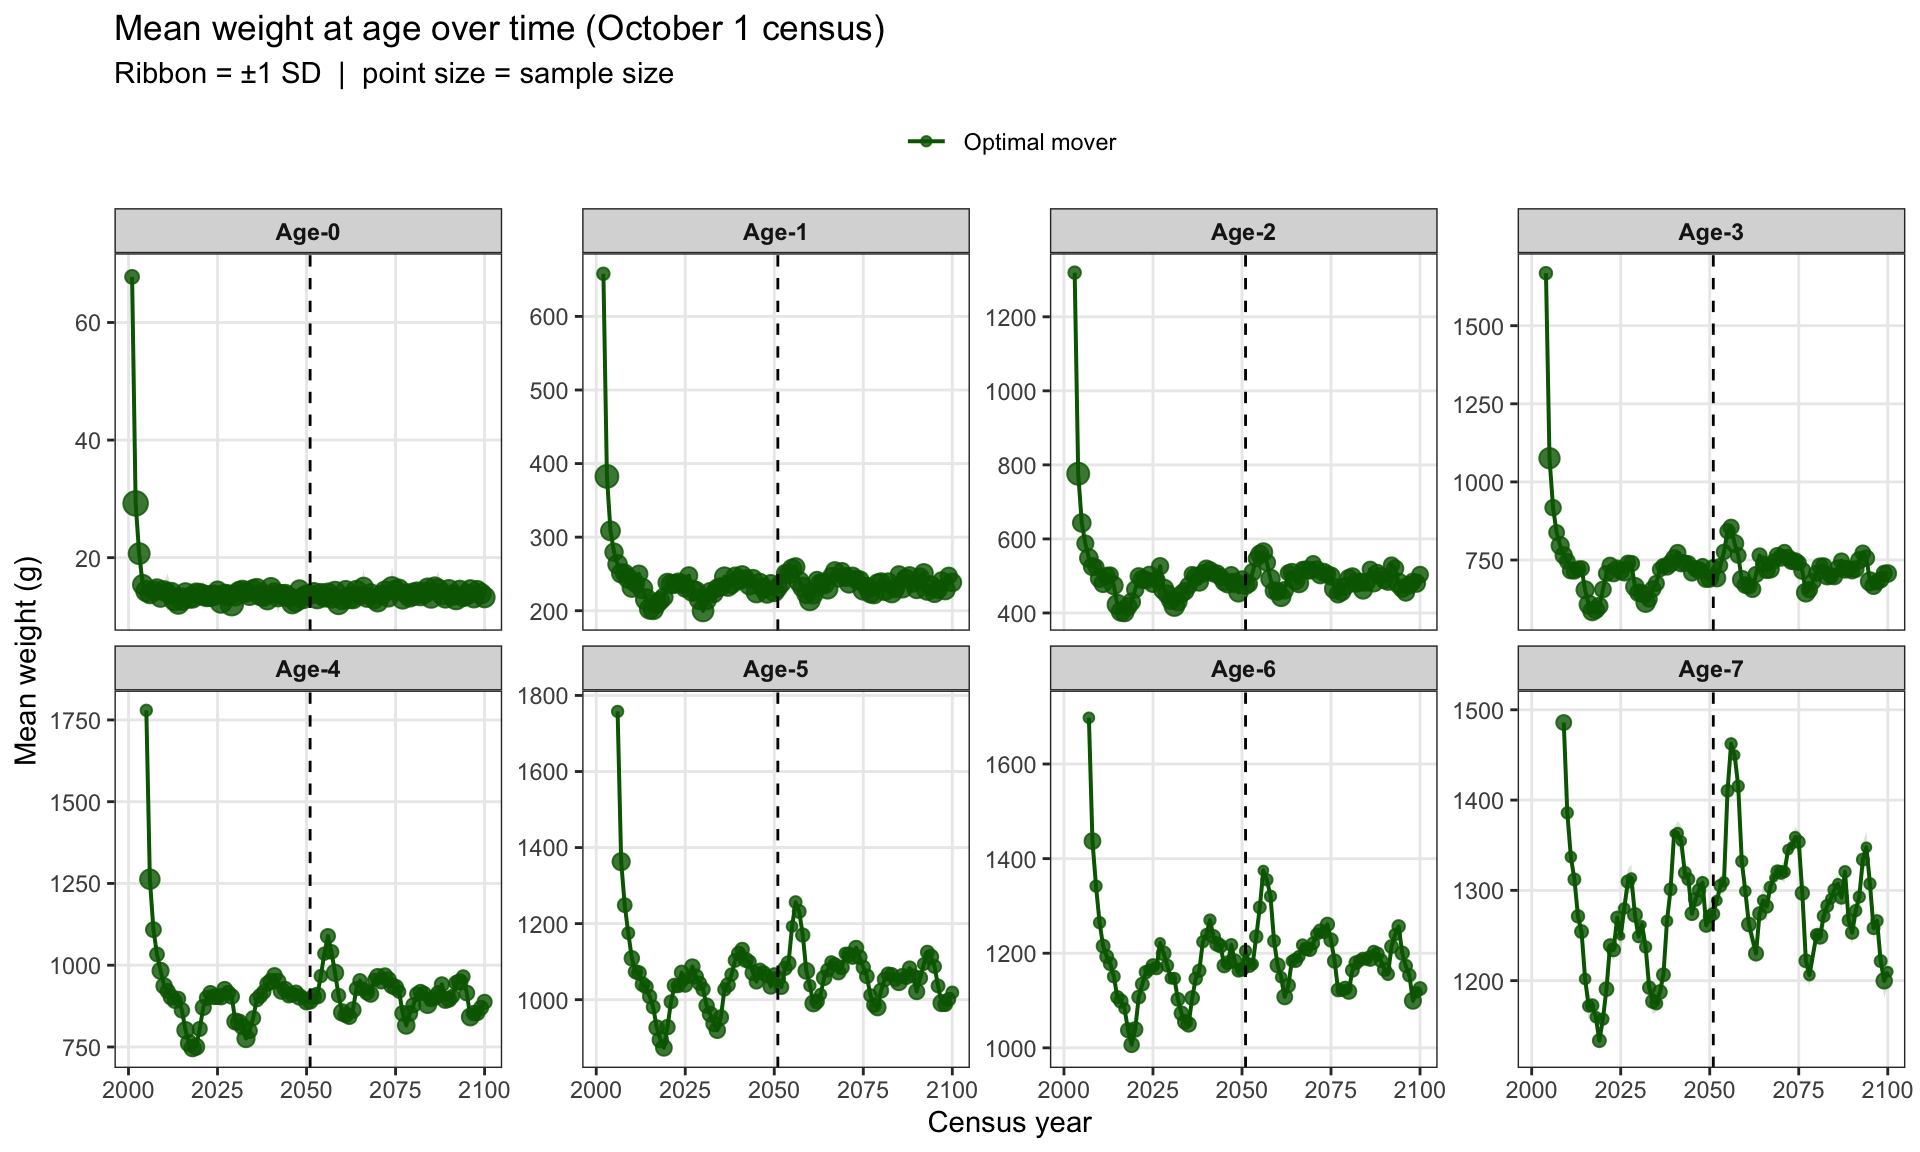
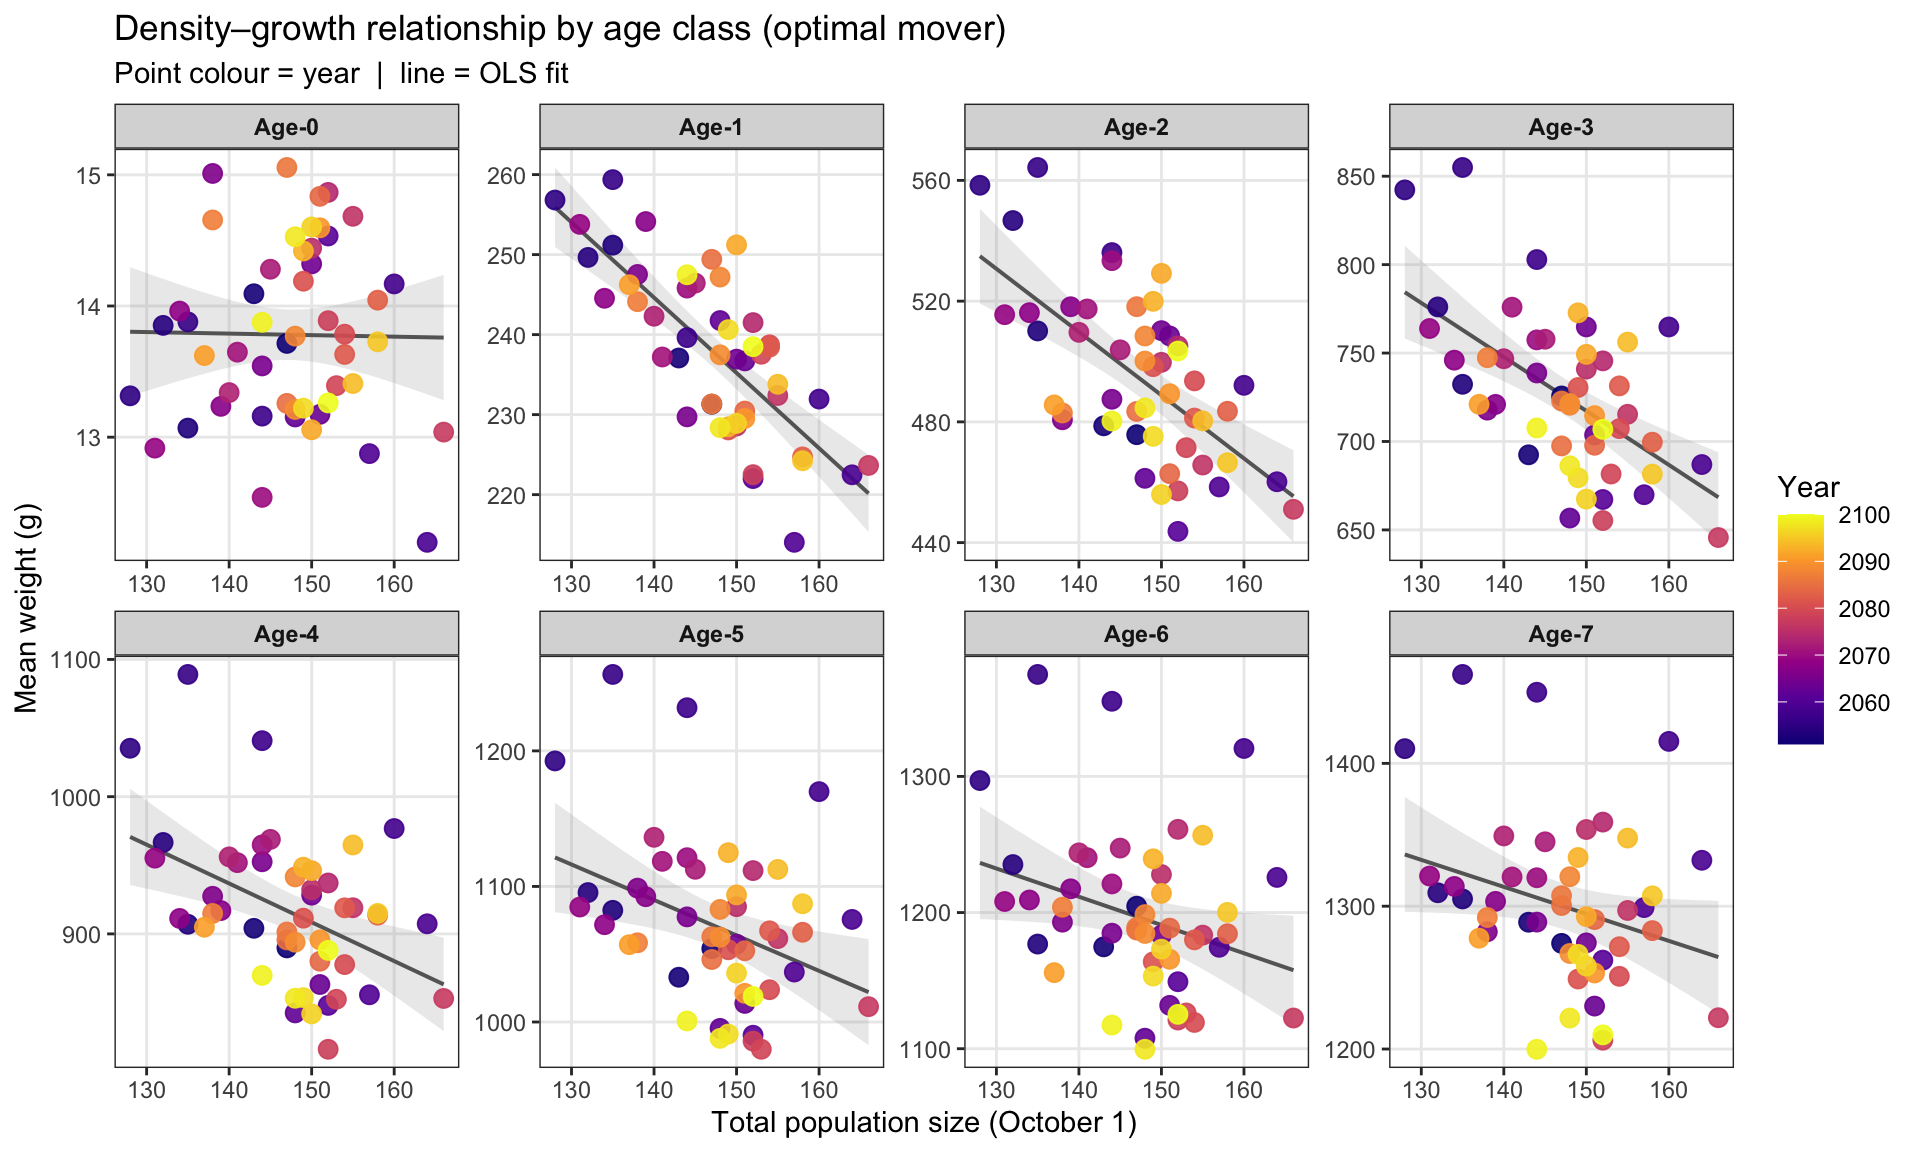
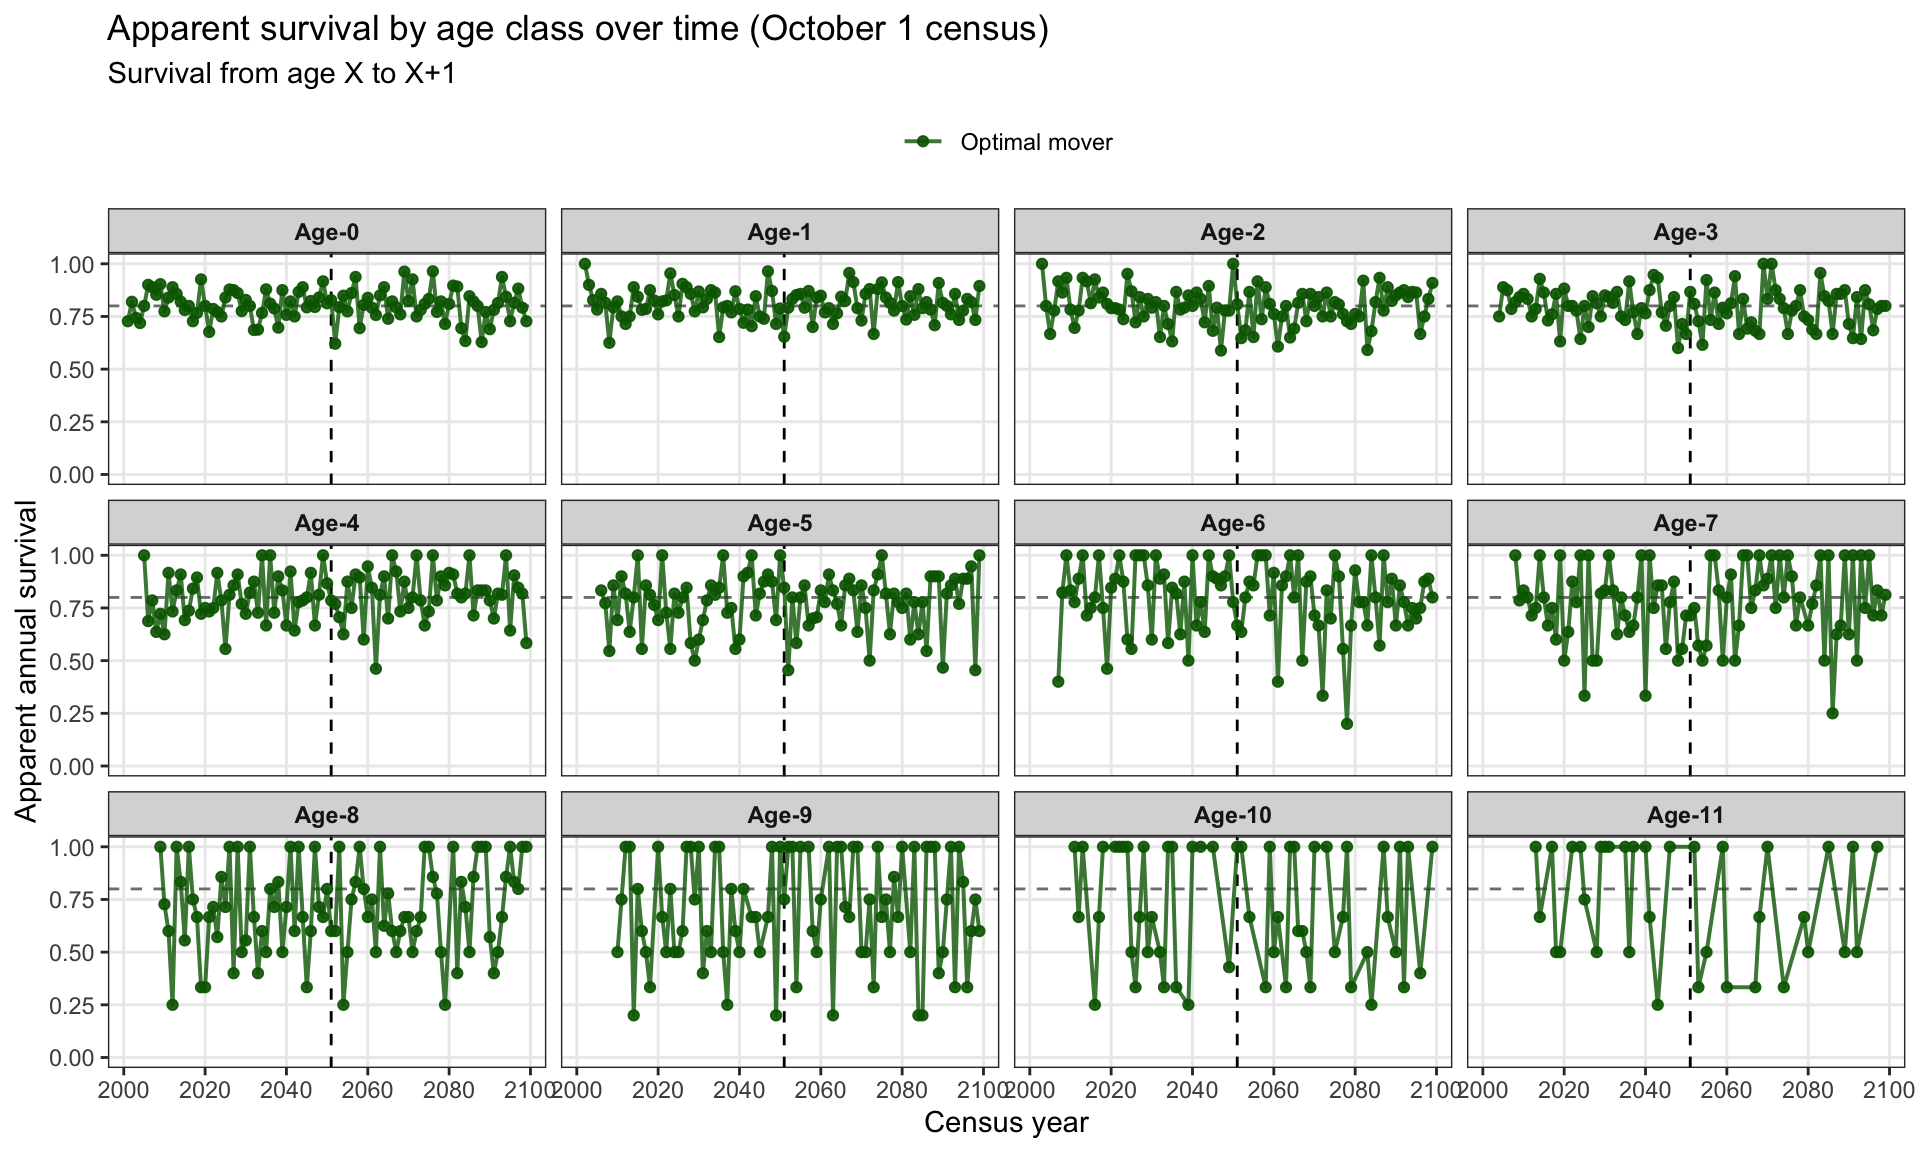
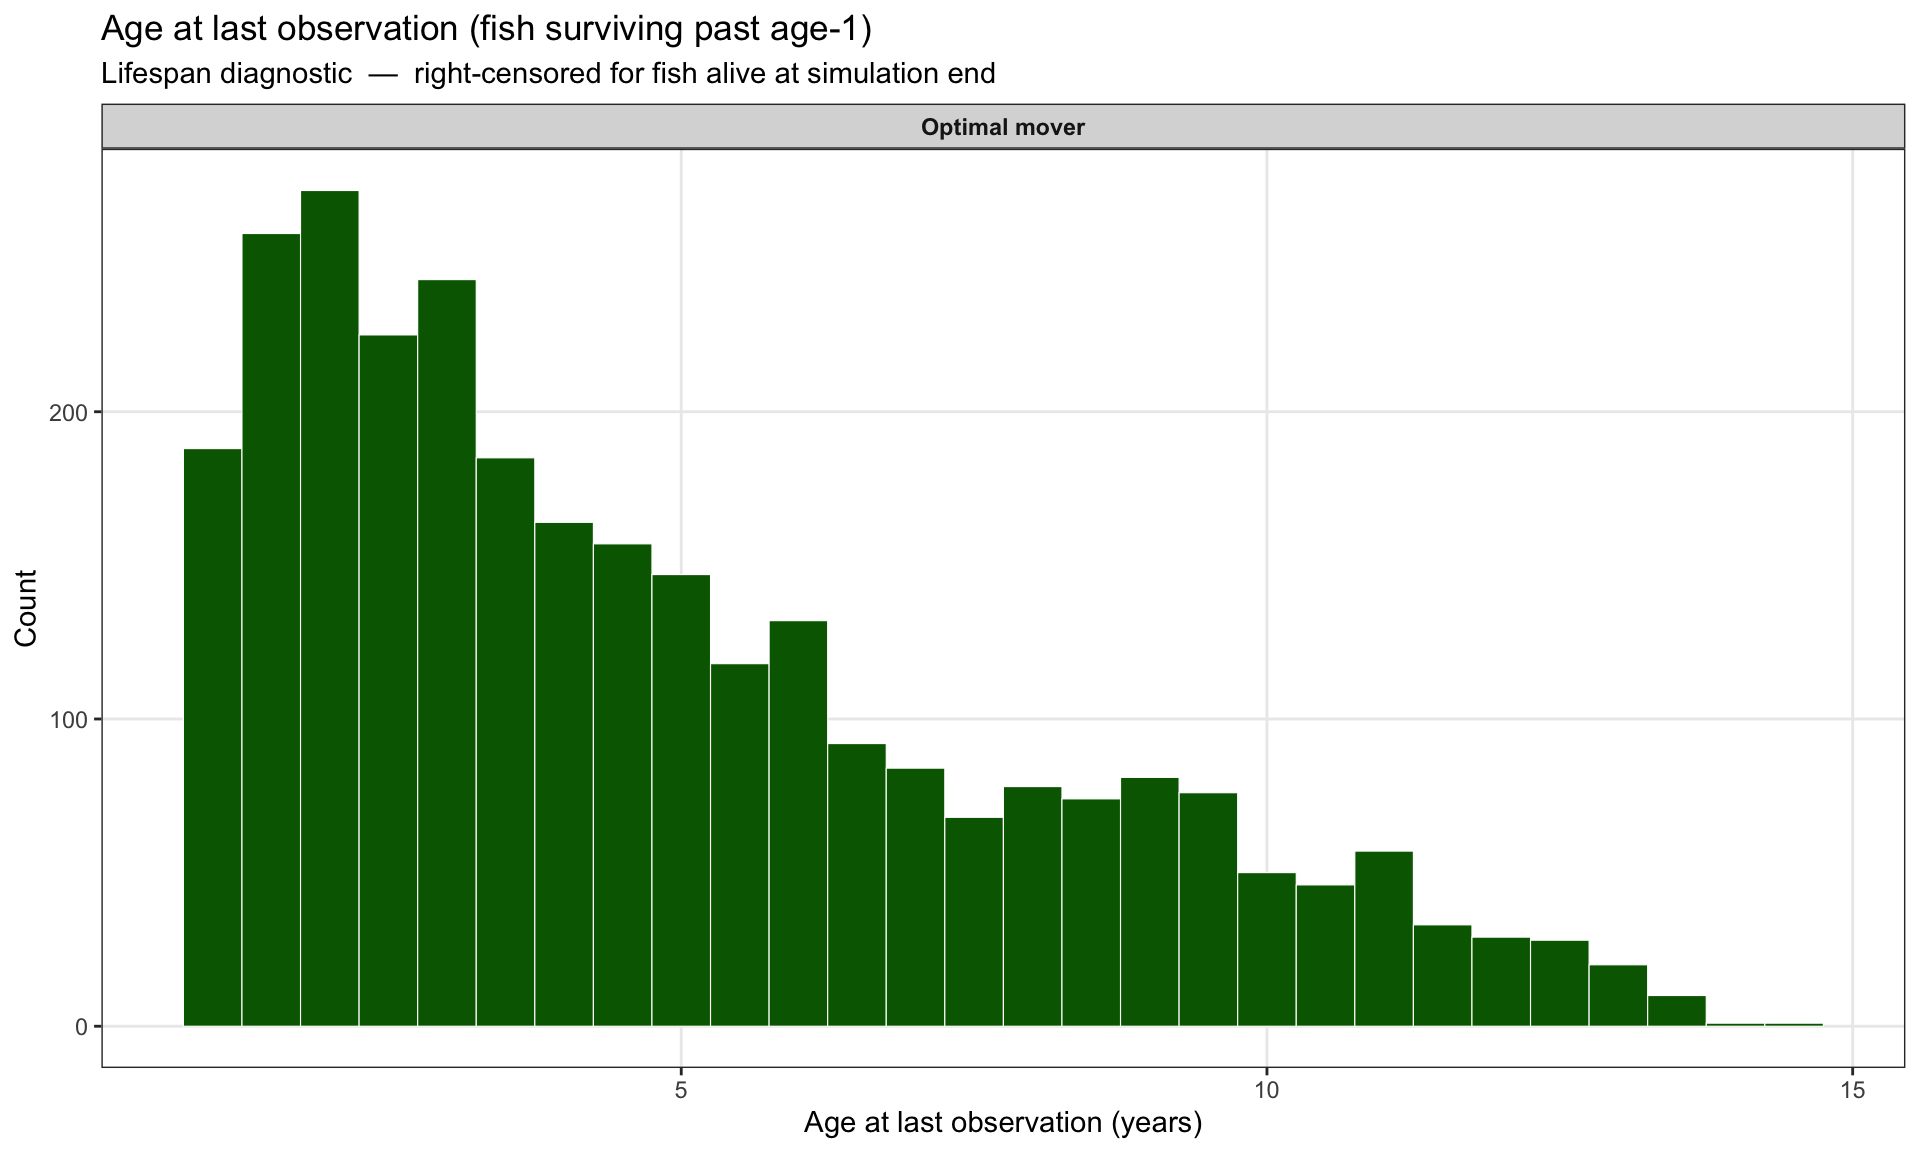
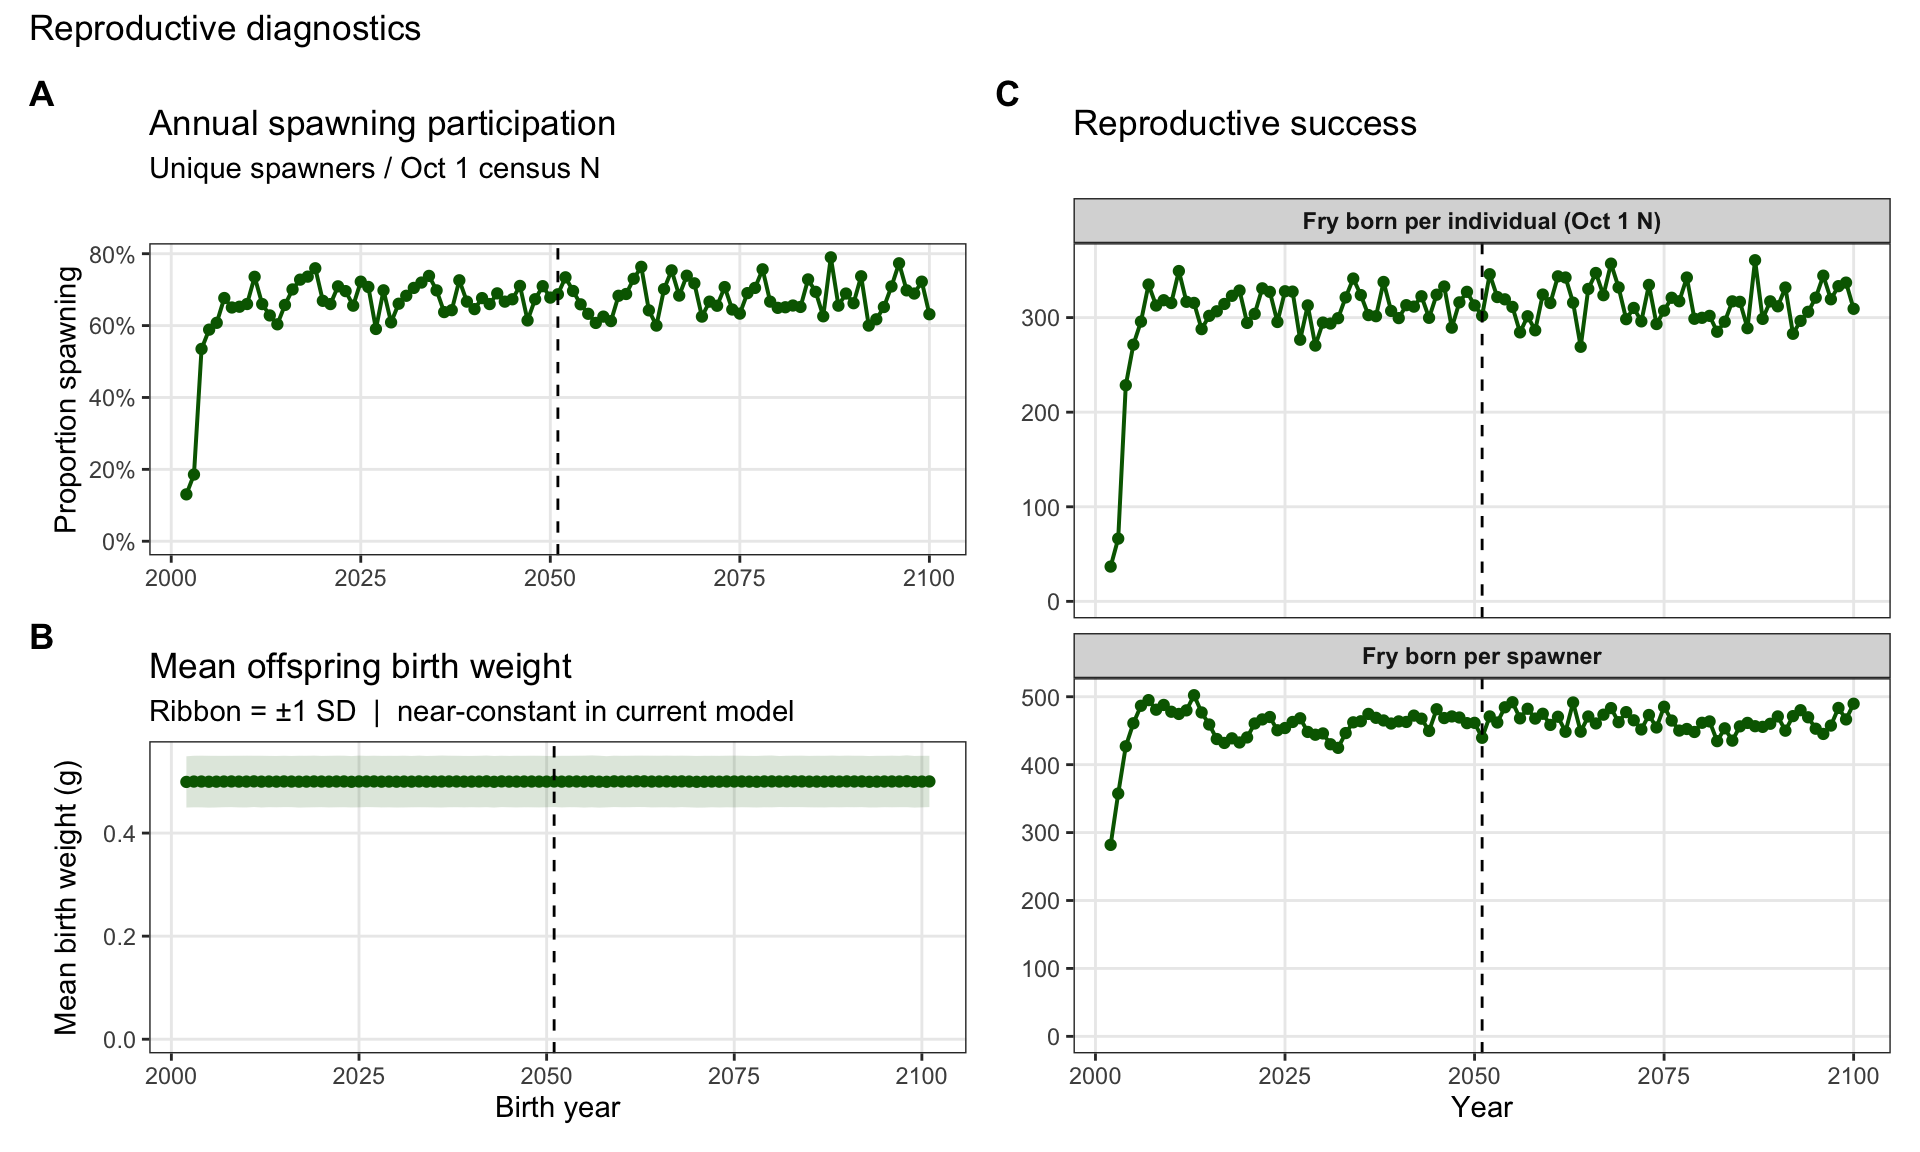
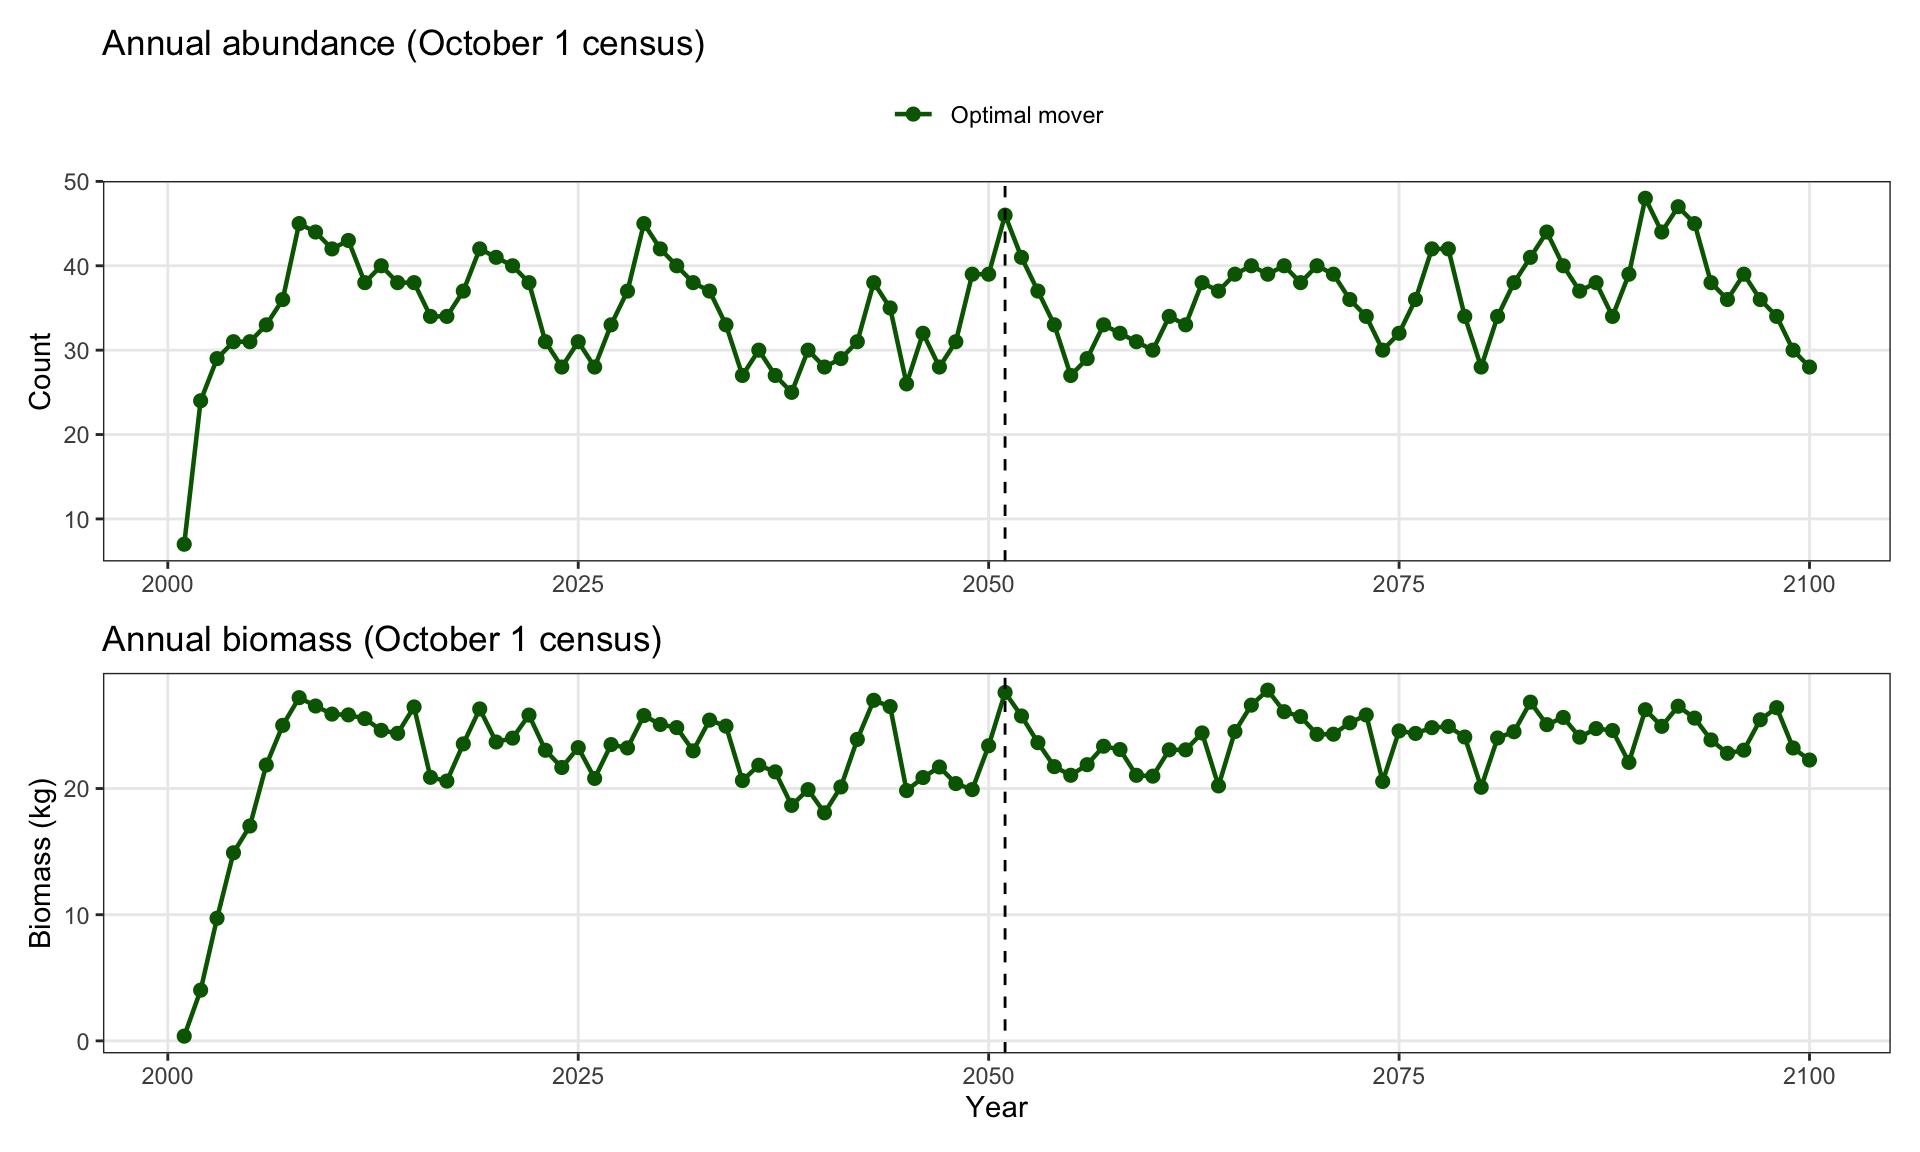
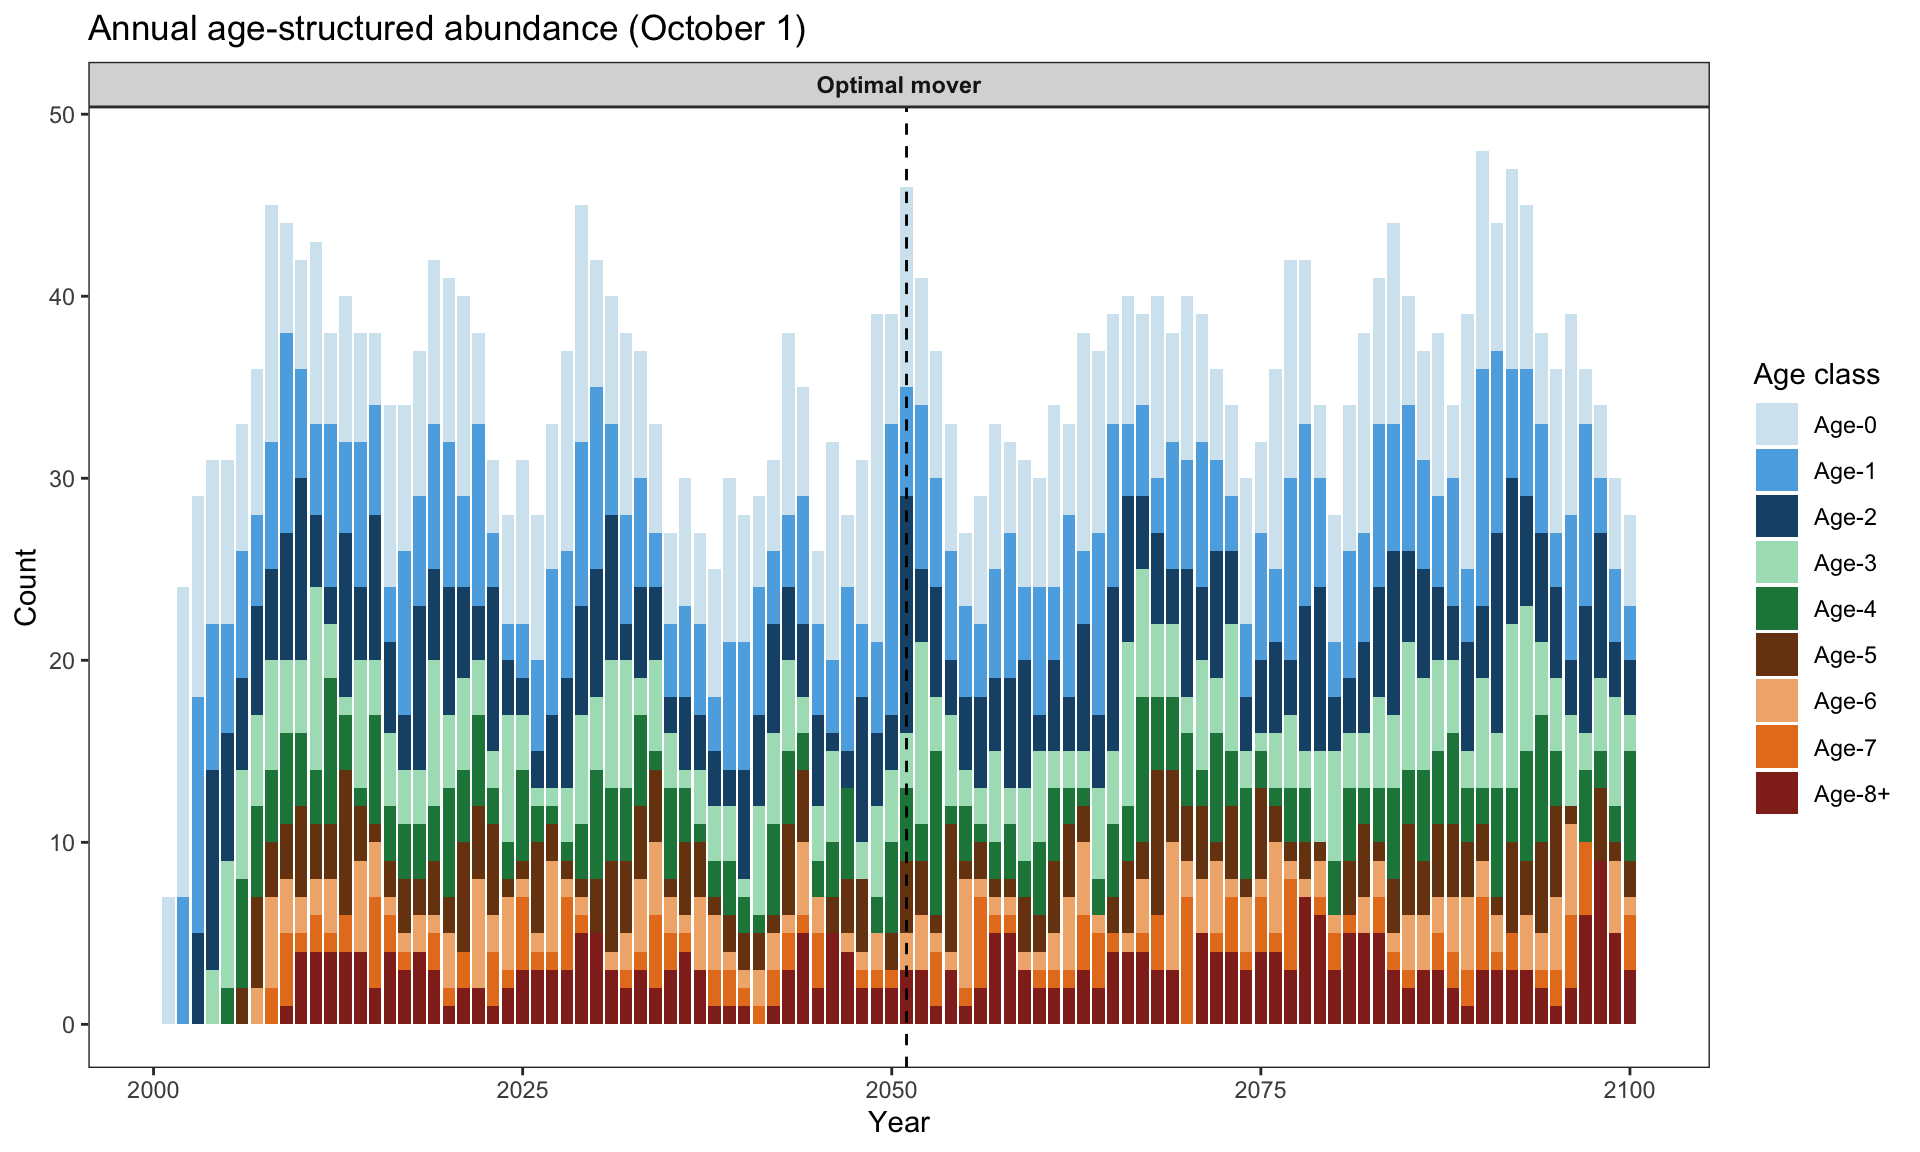
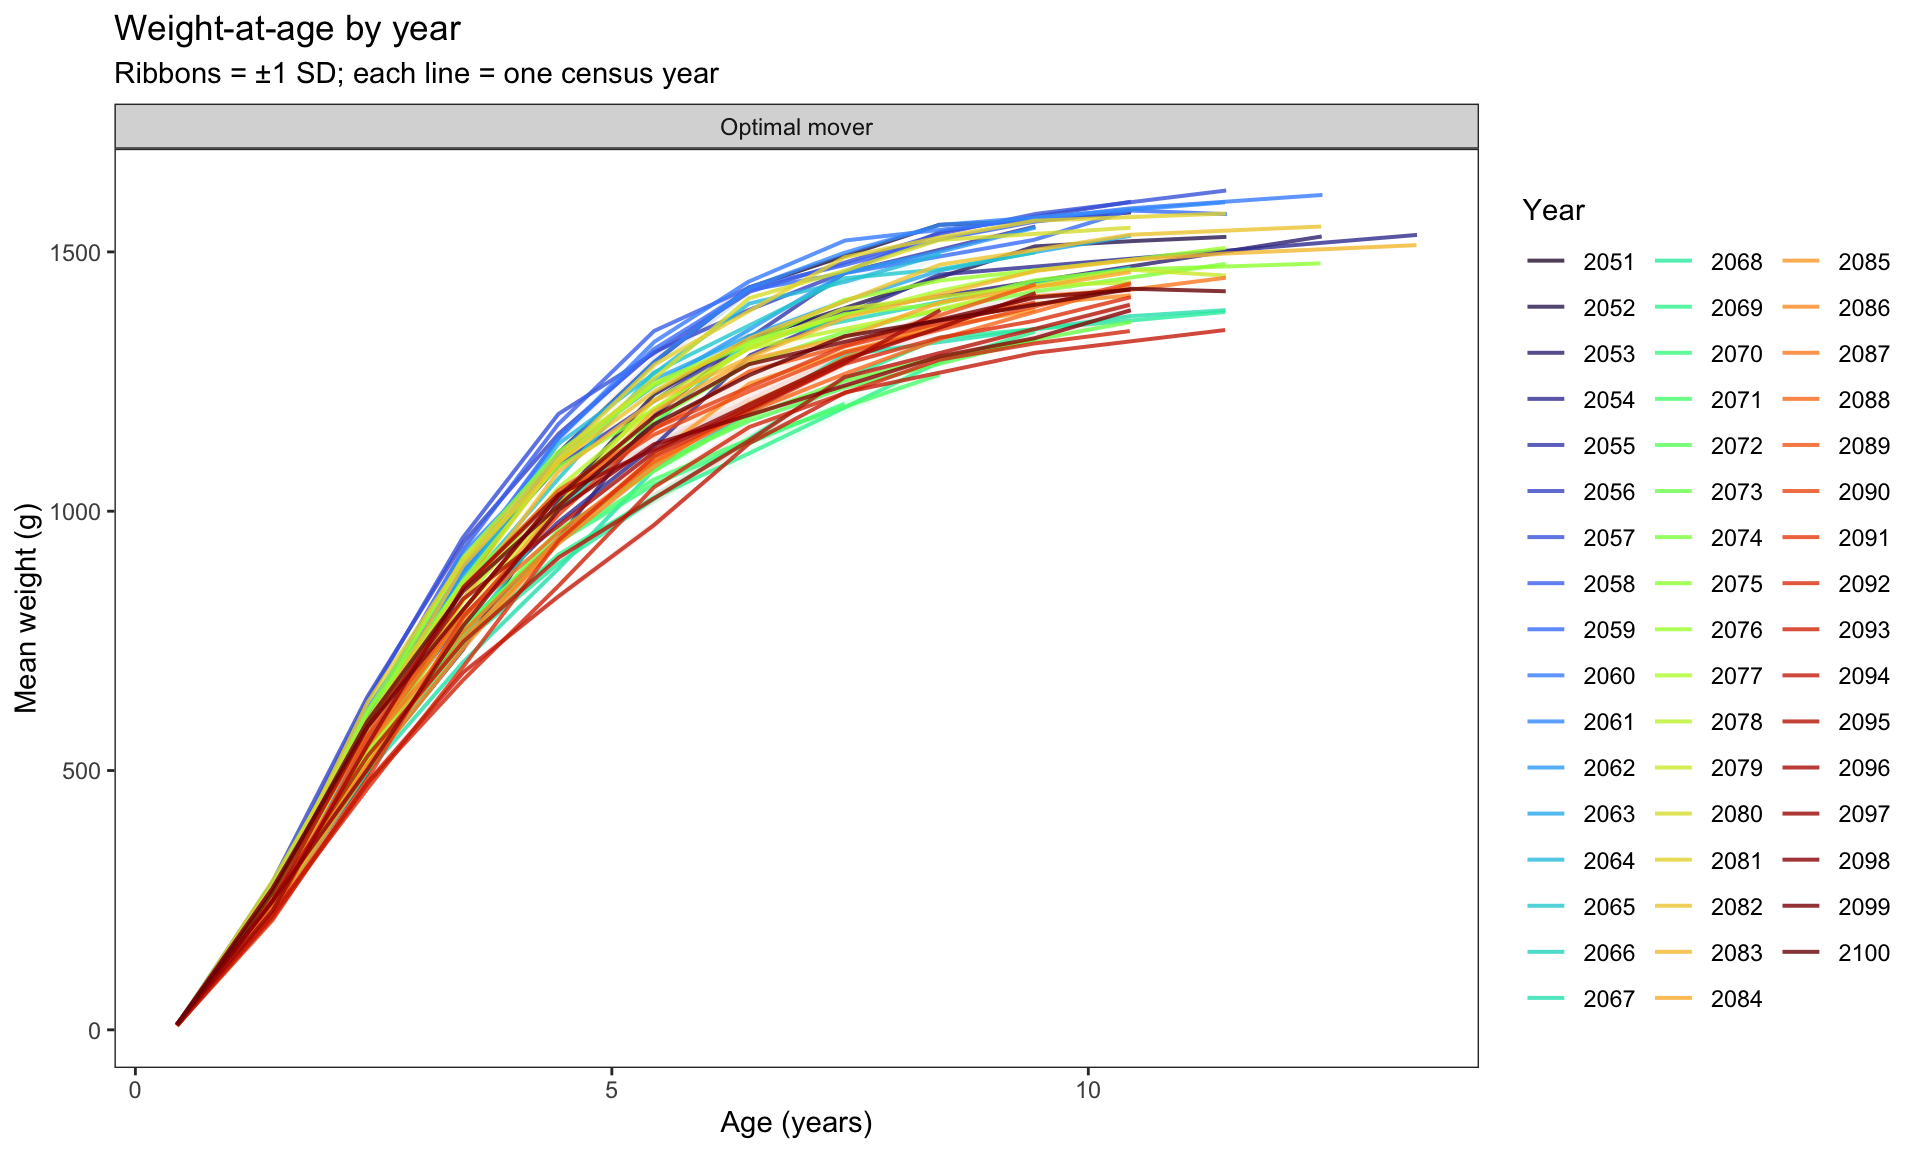
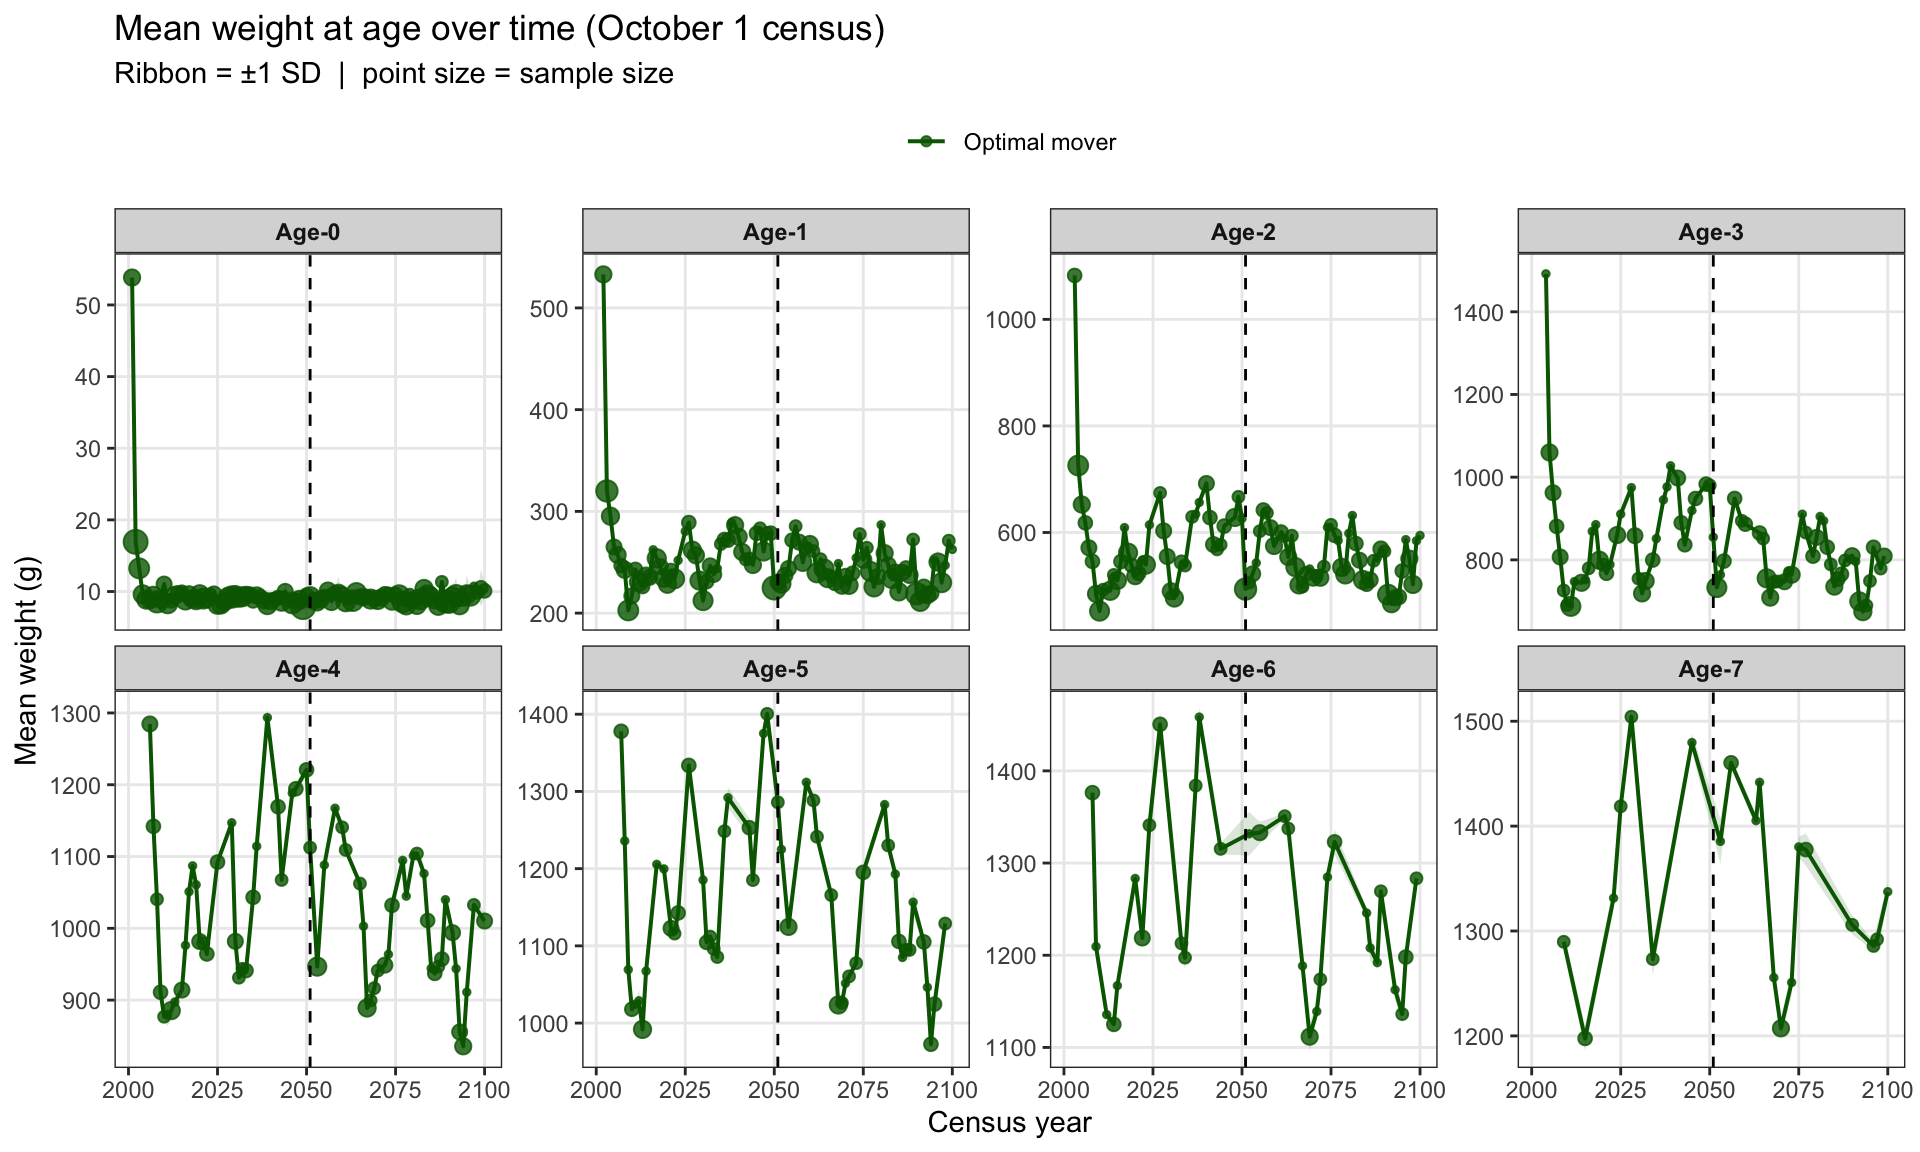
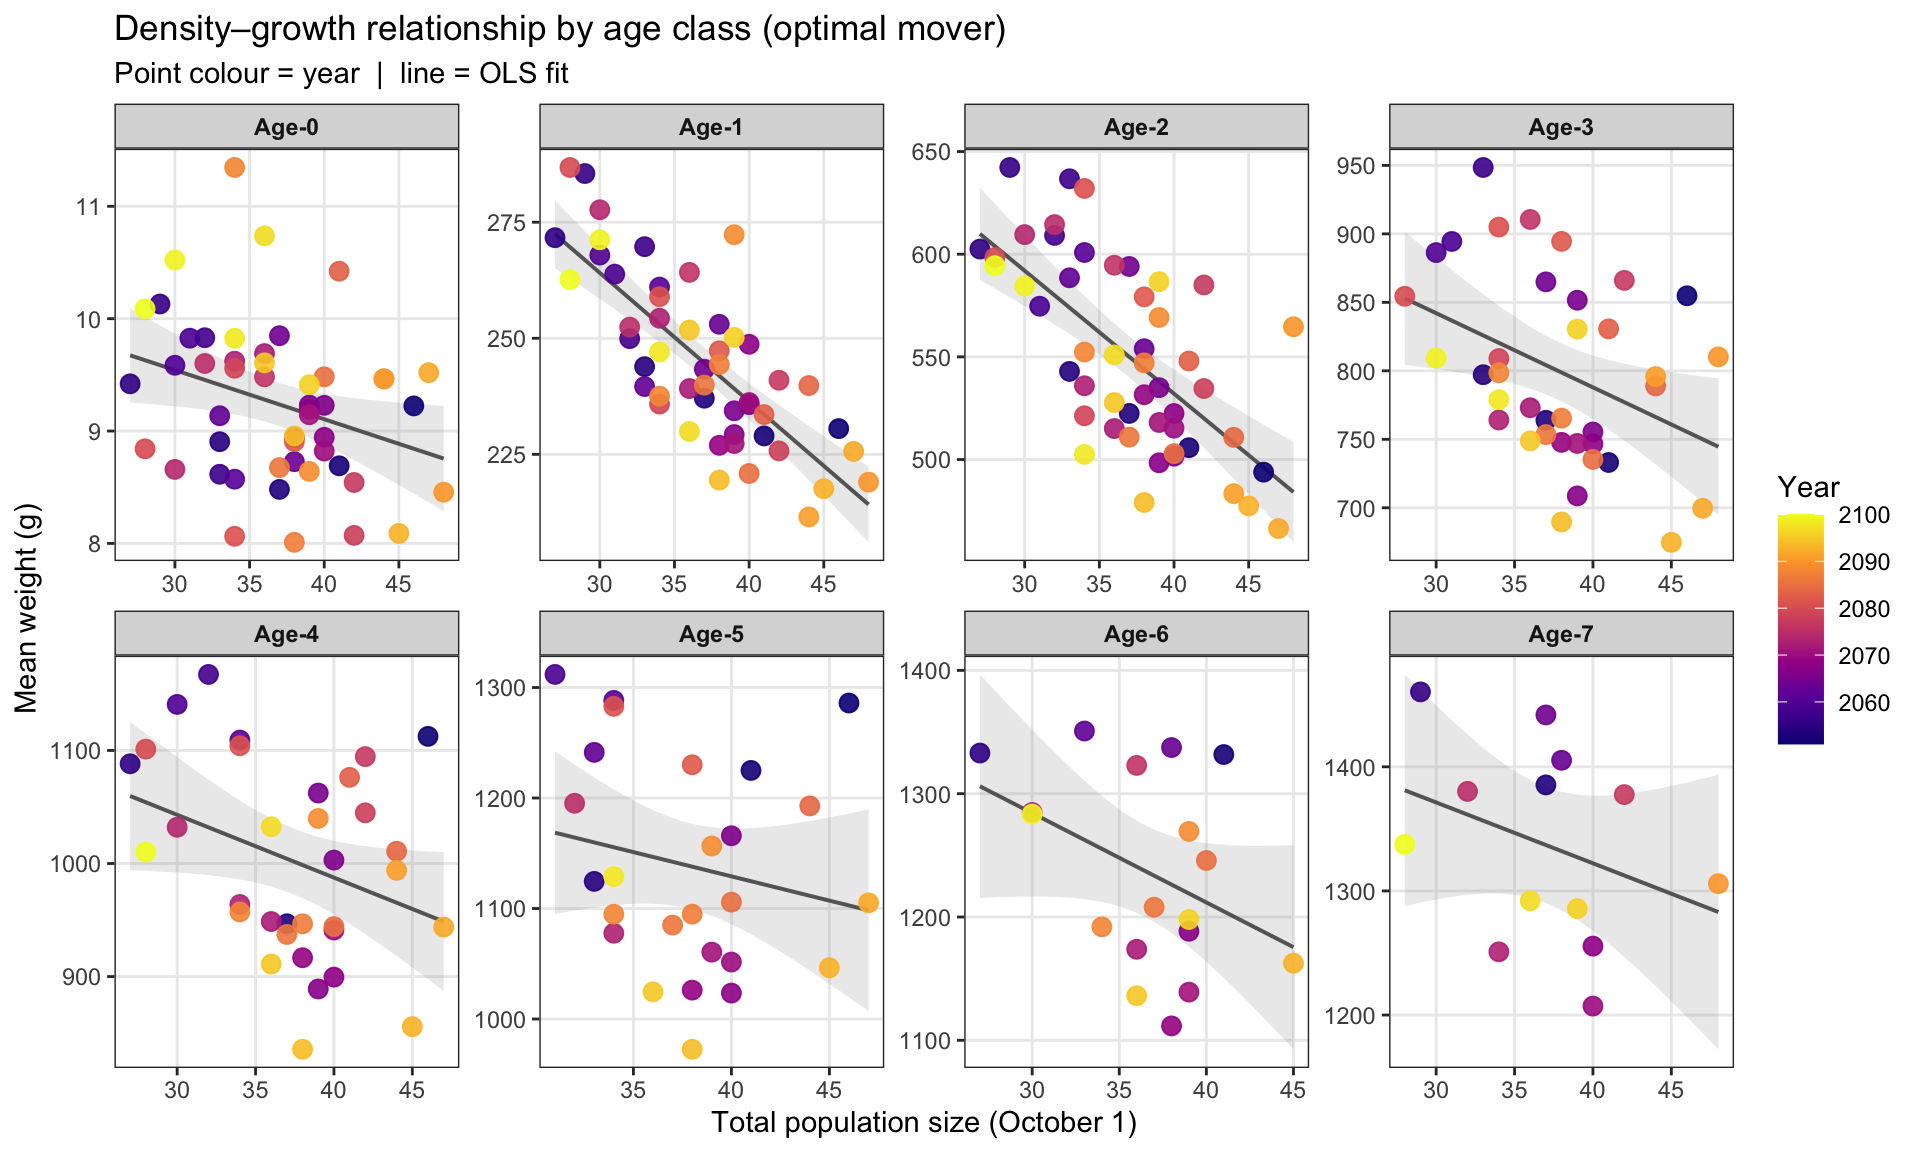
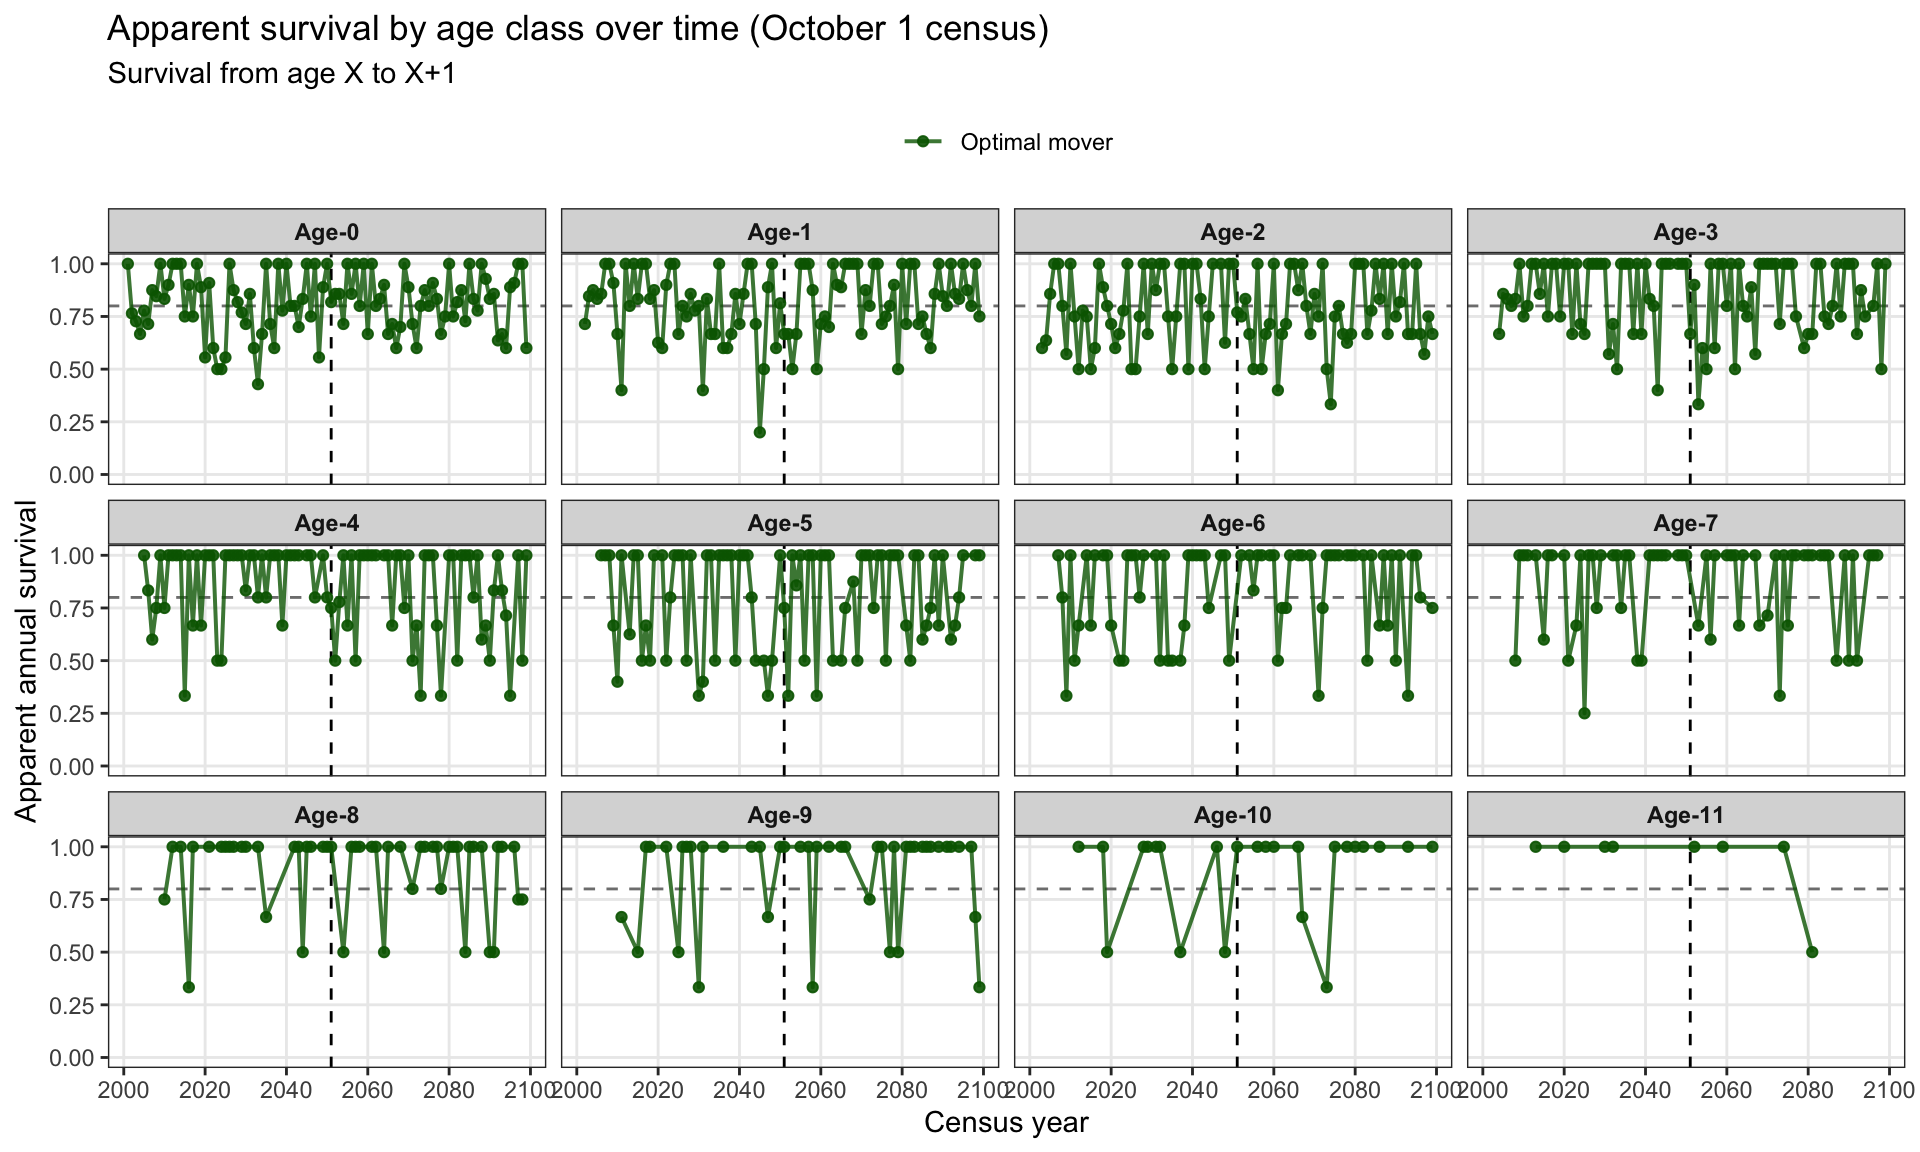
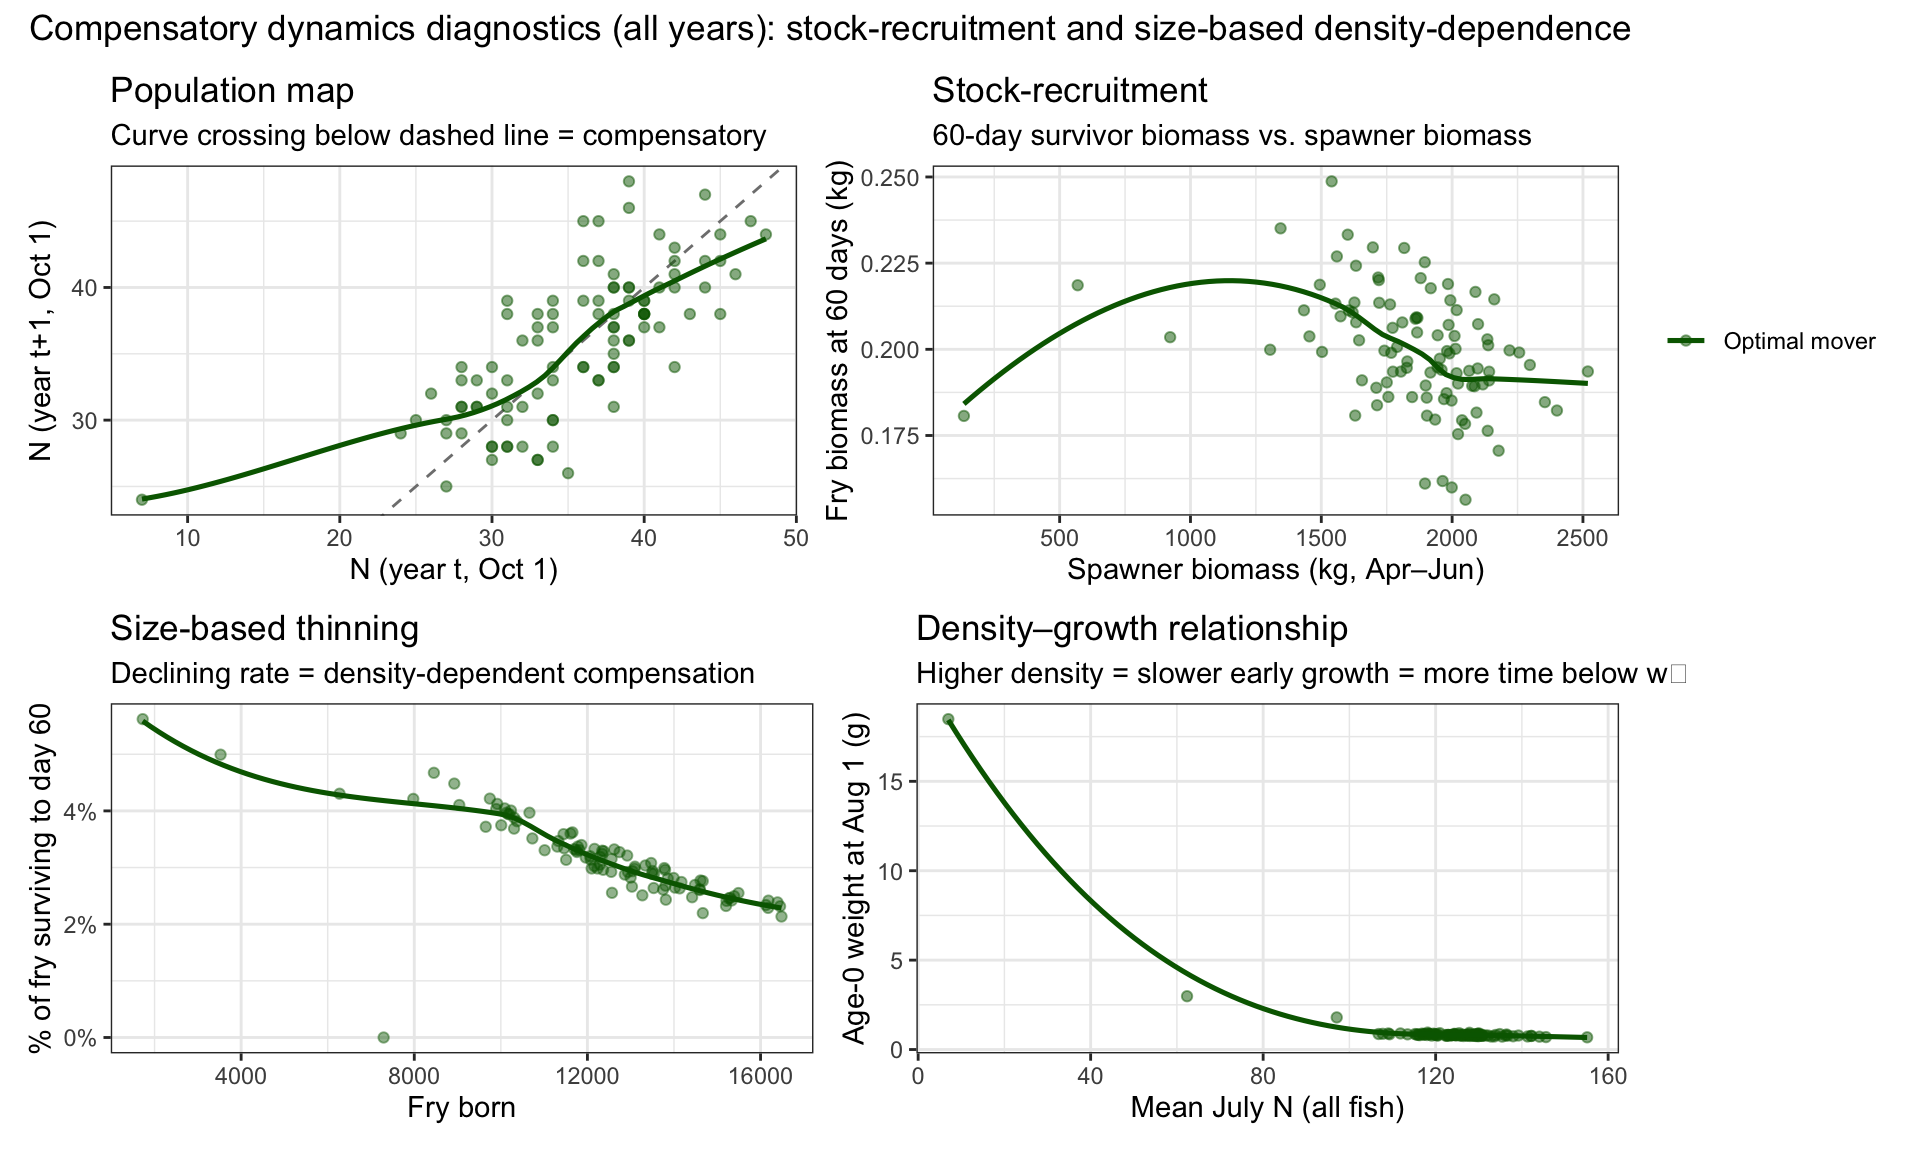
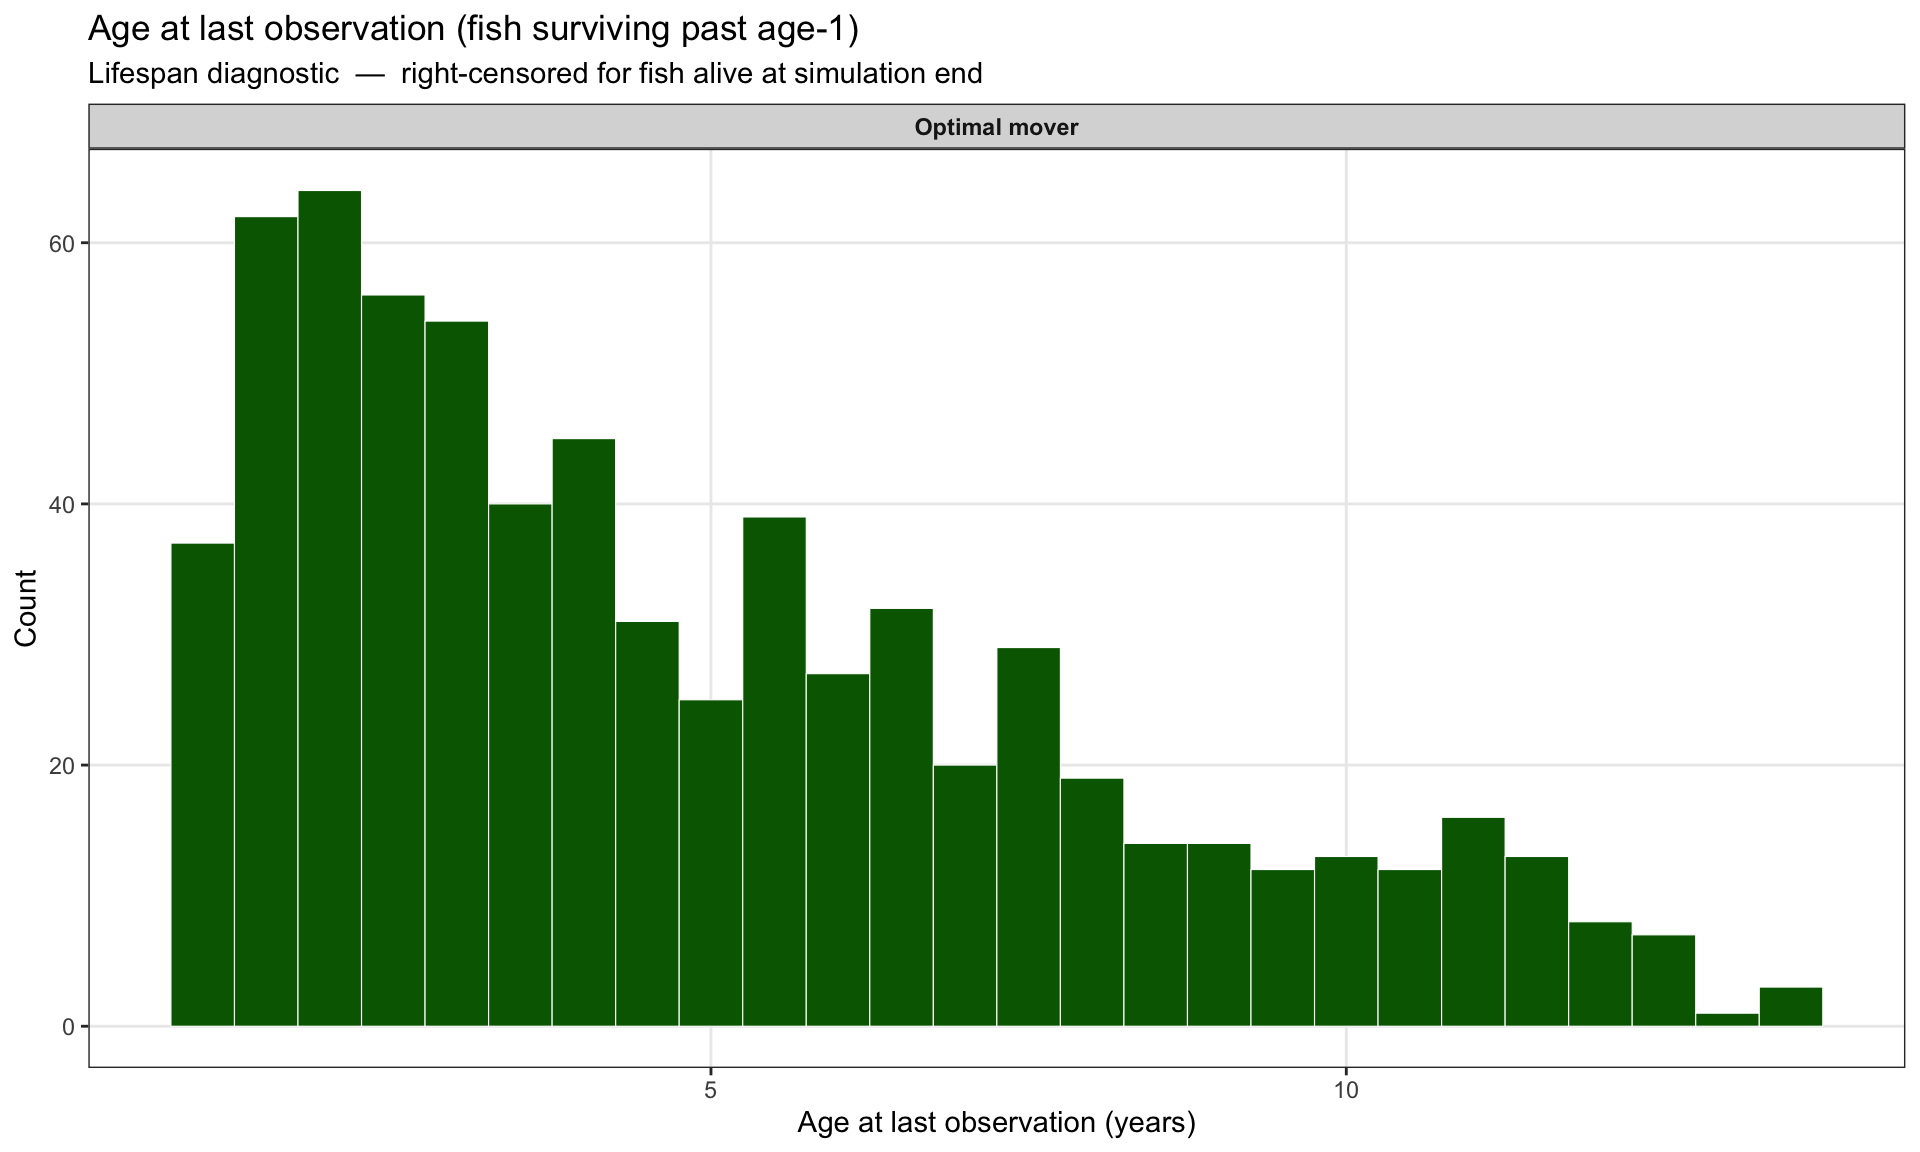
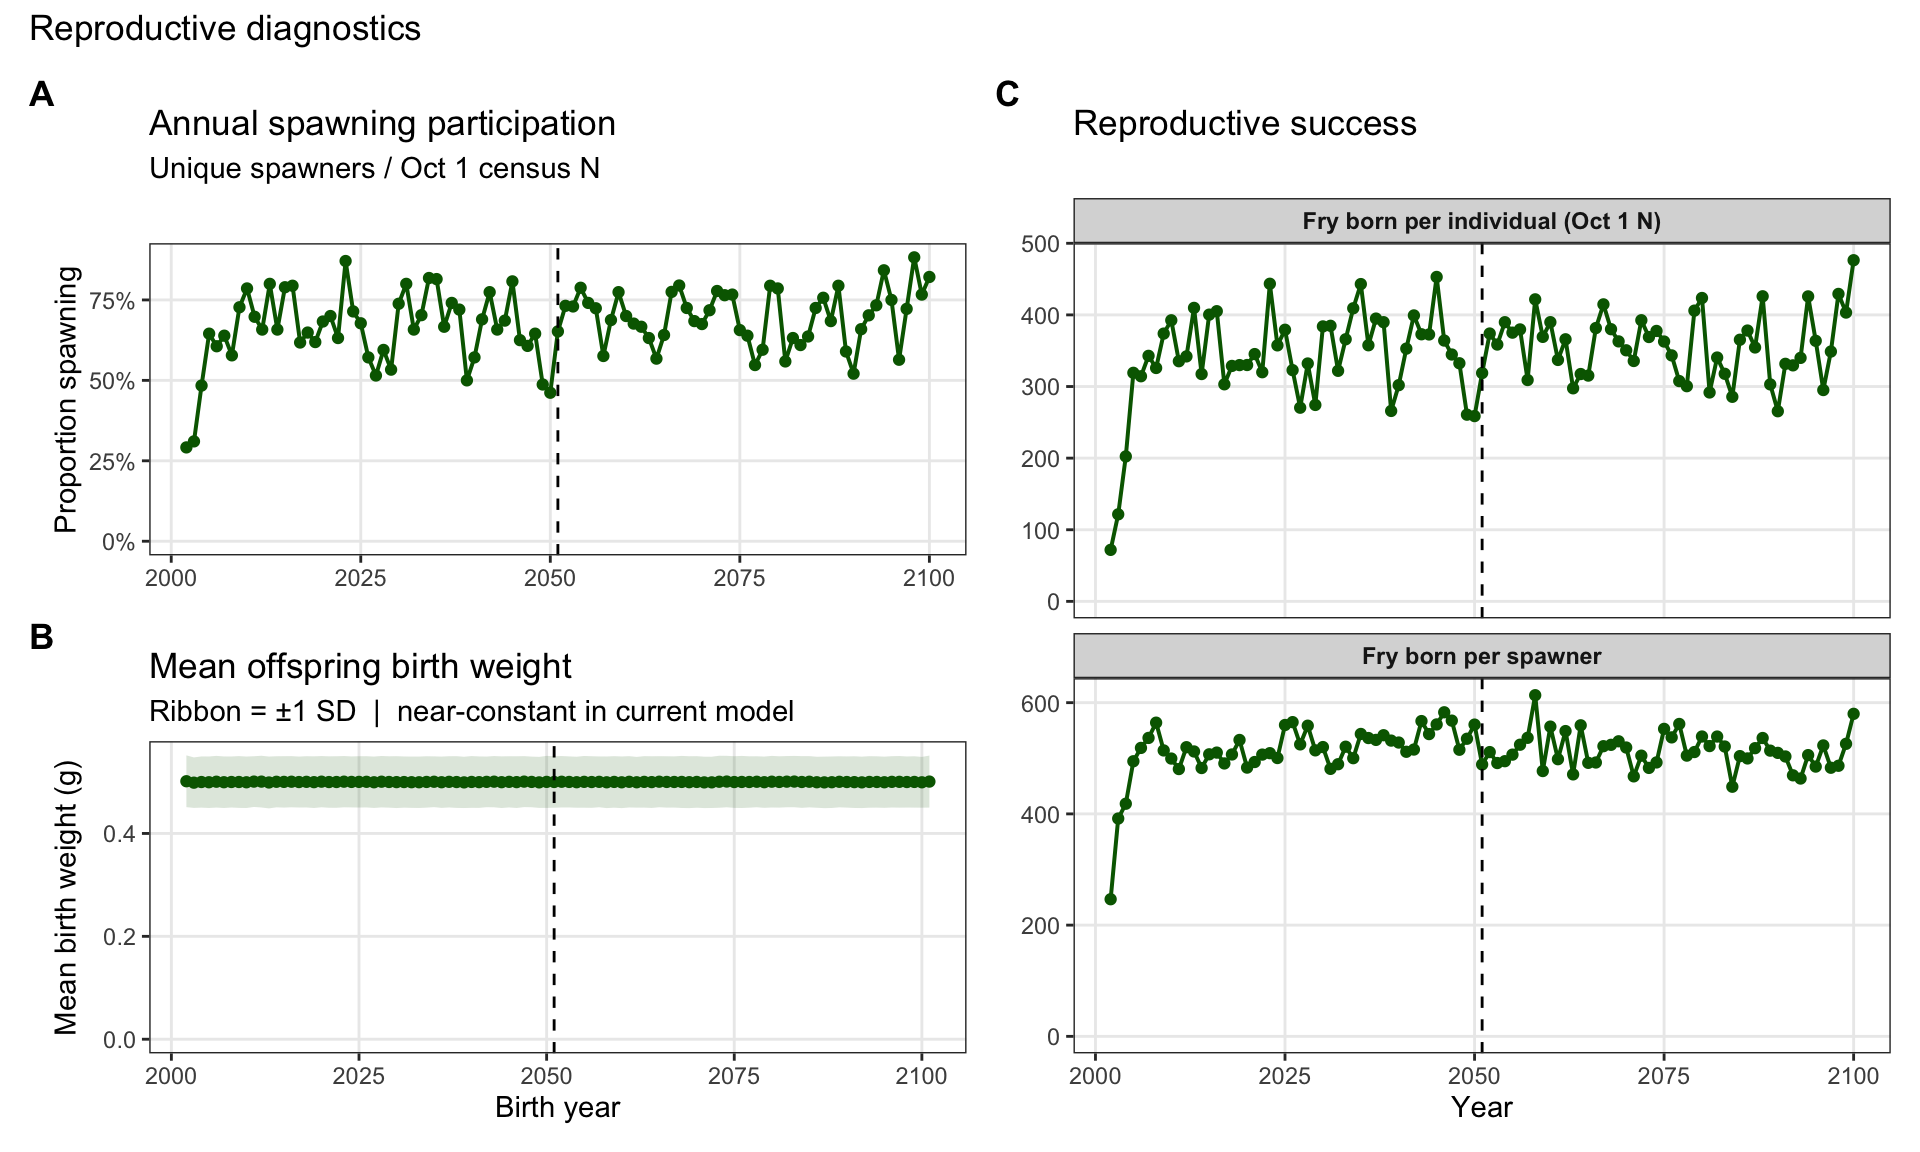
Daily and annual abundance/biomass, age structure, weight-at-age, body-size distributions, survival, lambda, and cohort survivorship.
```{r}
#| fig-width: 10
#| fig-height: 6
plot_population(
  ibm_long       = ibm_long_95null,
  habitat_df     = habitat_df_95null,
  exp_start_date = exp_start_date
)
```
### 75% cold
Daily and annual abundance/biomass, age structure, weight-at-age, body-size distributions, survival, lambda, and cohort survivorship.
```{r}
#| fig-width: 10
#| fig-height: 6
plot_population(
  ibm_long       = ibm_long_75null,
  habitat_df     = habitat_df_75null,
  exp_start_date = exp_start_date
)
```
### 50% cold
Daily and annual abundance/biomass, age structure, weight-at-age, body-size distributions, survival, lambda, and cohort survivorship.
```{r}
#| fig-width: 10
#| fig-height: 6
plot_population(
  ibm_long       = ibm_long_50null,
  habitat_df     = habitat_df_50null,
  exp_start_date = exp_start_date
)
```
### 25% cold
Daily and annual abundance/biomass, age structure, weight-at-age, body-size distributions, survival, lambda, and cohort survivorship.
```{r}
#| fig-width: 10
#| fig-height: 6
plot_population(
  ibm_long       = ibm_long_25null,
  habitat_df     = habitat_df_25null,
  exp_start_date = exp_start_date
)
```
### 5% cold
Daily and annual abundance/biomass, age structure, weight-at-age, body-size distributions, survival, lambda, and cohort survivorship.
```{r}
#| fig-width: 10
#| fig-height: 6
plot_population(
  ibm_long       = ibm_long_05null,
  habitat_df     = habitat_df_05null,
  exp_start_date = exp_start_date
)
```
---
## Cold + Warm, same Pcmax
### 95% cold / 5% warm
Daily and annual abundance/biomass, age structure, weight-at-age, body-size distributions, survival, lambda, and cohort survivorship.
```{r}
#| fig-width: 10
#| fig-height: 6
plot_population(
  ibm_long       = ibm_long_95,
  habitat_df     = habitat_df_95,
  exp_start_date = exp_start_date
)
```
### 75% cold / 25% warm
Daily and annual abundance/biomass, age structure, weight-at-age, body-size distributions, survival, lambda, and cohort survivorship.
```{r}
#| fig-width: 10
#| fig-height: 6
plot_population(
  ibm_long       = ibm_long_75,
  habitat_df     = habitat_df_75,
  exp_start_date = exp_start_date
)
```
### 50% cold / 50% warm
Daily and annual abundance/biomass, age structure, weight-at-age, body-size distributions, survival, lambda, and cohort survivorship.
```{r}
#| fig-width: 10
#| fig-height: 6
plot_population(
  ibm_long       = ibm_long_50,
  habitat_df     = habitat_df_50,
  exp_start_date = exp_start_date
)
```
### 25% cold / 75% warm
Daily and annual abundance/biomass, age structure, weight-at-age, body-size distributions, survival, lambda, and cohort survivorship.
```{r}
#| fig-width: 10
#| fig-height: 6
plot_population(
  ibm_long       = ibm_long_25,
  habitat_df     = habitat_df_25,
  exp_start_date = exp_start_date
)
```
### 5% cold / 95% warm
Daily and annual abundance/biomass, age structure, weight-at-age, body-size distributions, survival, lambda, and cohort survivorship.
```{r}
#| fig-width: 10
#| fig-height: 6
plot_population(
  ibm_long       = ibm_long_05,
  habitat_df     = habitat_df_05,
  exp_start_date = exp_start_date
)
```
---
## Cold + Warm, high Pcmax in warm (0.6)
### 95% cold / 5% warm
Daily and annual abundance/biomass, age structure, weight-at-age, body-size distributions, survival, lambda, and cohort survivorship.
```{r}
#| fig-width: 10
#| fig-height: 6
plot_population(
  ibm_long       = ibm_long_95_highpcm,
  habitat_df     = habitat_df_95_highpcm,
  exp_start_date = exp_start_date
)
```
### 75% cold / 25% warm
Daily and annual abundance/biomass, age structure, weight-at-age, body-size distributions, survival, lambda, and cohort survivorship.
```{r}
#| fig-width: 10
#| fig-height: 6
plot_population(
  ibm_long       = ibm_long_75_highpcm,
  habitat_df     = habitat_df_75_highpcm,
  exp_start_date = exp_start_date
)
```
### 50% cold / 50% warm
Daily and annual abundance/biomass, age structure, weight-at-age, body-size distributions, survival, lambda, and cohort survivorship.
```{r}
#| fig-width: 10
#| fig-height: 6
plot_population(
  ibm_long       = ibm_long_50_highpcm,
  habitat_df     = habitat_df_50_highpcm,
  exp_start_date = exp_start_date
)
```
### 25% cold / 75% warm
Daily and annual abundance/biomass, age structure, weight-at-age, body-size distributions, survival, lambda, and cohort survivorship.
```{r}
#| fig-width: 10
#| fig-height: 6
plot_population(
  ibm_long       = ibm_long_25_highpcm,
  habitat_df     = habitat_df_25_highpcm,
  exp_start_date = exp_start_date
)
```
### 5% cold / 95% warm
Daily and annual abundance/biomass, age structure, weight-at-age, body-size distributions, survival, lambda, and cohort survivorship.
```{r}
#| fig-width: 10
#| fig-height: 6
plot_population(
  ibm_long       = ibm_long_05_highpcm,
  habitat_df     = habitat_df_05_highpcm,
  exp_start_date = exp_start_date
)
```
---