---
title: "Warm Habitat Contribution"
---
```{r, include = FALSE, cache = FALSE}
library(tidyverse)
library(lubridate)
library(ggpubr)
library(egg)
library(RColorBrewer)
library(ggridges)
library(patchwork)
library(scales)
library(ggrepel)
source("Functions.R")
source("PlotResults.R")
source("ScenarioDefs.R")
```
**Purpose:** Compare the relative importance of warm habitat across simulation runs.
**Questions:**
- How does the relative importance of seasonally warm habiat (i.e., proportional contribution to annual biomass accrual) change as the availability of perennially cold habitat shrinks?
- *What are the mechanisms driving shifts in relative imporance?* **To Do**
## Setup
Load each result .rds object and bind directly into a list. Using a helper function ensures each `res` object is freed from memory as soon as `ibm_long` is extracted, avoiding duplicate references that would force R to copy the data frames.
```{r}
#| cache: false
# Extract params from one file (small object)
res            <- readRDS("results/TempOffset_ColdWarm_05percold_highPwarm.rds")
sim_params     <- res$params
exp_start_date <- sim_params$mindate + years(sim_params$nyears_burnin)
rm(res)

# Helper: read one scenario, extract ibm_long, and free res before returning
load_scen <- function(path, pc, ht, pcmax_cold, pcmax_warm) {
  res <- readRDS(path)
  list(df = res$ibm_long, pc = pc, ht = ht, pcmax_cold = pcmax_cold, pcmax_warm = pcmax_warm)
}

ibm_list_mech <- list(
  load_scen("results/TempOffset_ColdOnly_95percold.rds",             0.95, "Cold only",           0.5, NA_real_),
  load_scen("results/TempOffset_ColdWarm_95percold.rds",             0.95, "Cold + Warm",          0.5, 0.5),
  load_scen("results/TempOffset_ColdWarm_95percold_highPwarm.rds",   0.95, "Cold + Warm (high P)", 0.5, 0.6),
  load_scen("results/TempOffset_ColdOnly_75percold.rds",             0.75, "Cold only",           0.5, NA_real_),
  load_scen("results/TempOffset_ColdWarm_75percold.rds",             0.75, "Cold + Warm",          0.5, 0.5),
  load_scen("results/TempOffset_ColdWarm_75percold_highPwarm.rds",   0.75, "Cold + Warm (high P)", 0.5, 0.6),
  load_scen("results/TempOffset_ColdOnly_50percold.rds",             0.50, "Cold only",           0.5, NA_real_),
  load_scen("results/TempOffset_ColdWarm_50percold.rds",             0.50, "Cold + Warm",          0.5, 0.5),
  load_scen("results/TempOffset_ColdWarm_50percold_highPwarm.rds",   0.50, "Cold + Warm (high P)", 0.5, 0.6),
  load_scen("results/TempOffset_ColdOnly_25percold.rds",             0.25, "Cold only",           0.5, NA_real_),
  load_scen("results/TempOffset_ColdWarm_25percold.rds",             0.25, "Cold + Warm",          0.5, 0.5),
  load_scen("results/TempOffset_ColdWarm_25percold_highPwarm.rds",   0.25, "Cold + Warm (high P)", 0.5, 0.6),
  load_scen("results/TempOffset_ColdOnly_05percold.rds",             0.05, "Cold only",           0.5, NA_real_),
  load_scen("results/TempOffset_ColdWarm_05percold.rds",             0.05, "Cold + Warm",          0.5, 0.5),
  load_scen("results/TempOffset_ColdWarm_05percold_highPwarm.rds",   0.05, "Cold + Warm (high P)", 0.5, 0.6)
)
```
Summarize within each scenario before combining to avoid loading all fifteen full data frames into memory simultaneously. The Oct 1 census data (1 row per fish per year) and the patch-level growth totals (1 row per year × patch) are the only data structures that need to be combined across scenarios.
```{r}
#| cache: false
# ── Scenario metadata ─────────────────────────────────────────────────────────
scen_meta <- tibble(
  scen_key  = c("95", "75", "50", "25", "05"),
  label     = c("95% cold", "75% cold", "50% cold", "25% cold", "5% cold"),
  prop_cold = c(0.95, 0.75, 0.50, 0.25, 0.05)
)

scen_pal <- setNames(
  hcl.colors(5, "Zissou 1"),
  scen_meta$label
)

# Linetype and shape palettes for habitat availability
hab_cols  <- c("Cold only" = "#6BAED6",  "Cold + Warm" = "#FC8D59",   "Cold + Warm (high P)" = "#B30000")
hab_lty   <- c("Cold only" = "solid" ,   "Cold + Warm" = "solid",     "Cold + Warm (high P)" = "solid")
hab_shape <- c("Cold only" = 16,         "Cold + Warm" = 16,          "Cold + Warm (high P)" = 16)

# Helper: derive scen_key string from numeric prop_cold
pc_to_key <- function(pc) sprintf("%02d", round(pc * 100))

# Helper: extract Oct 1 experimental-period rows from one ibm_long
# Filtering before bind_rows() keeps only ~1/365th of each data frame.
# extract_oct1_exp <- function(ibm_long, scen_key) {
#   ibm_long |>
#     filter(date >= exp_start_date,
#            month(date) == 10, day(date) == 1,
#            survived == 1) |>
#     mutate(scen_key  = scen_key,
#            year      = year(date),
#            age_class = floor(age))
# }

# Helper: compute per-year biomass accrual by patch (experimental period only).
# Summarises to n_years × 2 rows per scenario before combining.
compute_patch_growth <- function(ibm_long, scen_key) {
  ibm_long |>
    filter(date >= exp_start_date, !is.na(ggd)) |>
    mutate(daily_growth_g = weight * ggd, year = year(date)) |>
    group_by(year, patch) |>
    summarise(total_g = sum(daily_growth_g, na.rm = TRUE), .groups = "drop") |>
    mutate(scen_key = scen_key)
}

# ── Oct 1 census: experimental period, all hab types, all scenarios ───────────
# exp_oct1 <- purrr::map_dfr(ibm_list_mech, function(scen) {
#   extract_oct1_exp(scen$df, pc_to_key(scen$pc)) |>
#     mutate(hab_type = scen$ht)
# }) |>
#   left_join(scen_meta, by = "scen_key") |>
#   mutate(
#     label    = factor(label,    levels = scen_meta$label),
#     hab_type = factor(hab_type, levels = c("Cold only", "Cold + Warm", "Cold + Warm (high P)"))
#   )

# ── Annual biomass accrual by patch, all hab types, all scenarios ─────────────
patch_growth <- purrr::map_dfr(ibm_list_mech, function(scen) {
  compute_patch_growth(scen$df, pc_to_key(scen$pc)) |>
    mutate(hab_type = scen$ht)
}) |>
  left_join(scen_meta, by = "scen_key") |>
  mutate(
    label    = factor(label,    levels = scen_meta$label),
    hab_type = factor(hab_type, levels = c("Cold only", "Cold + Warm", "Cold + Warm (high P)"))
  )

# ── Annual population totals per scenario × hab_type × year ──────────────────
# exp_pop_yr <- exp_oct1 |>
#   group_by(hab_type, label, prop_cold, year) |>
#   summarise(n = n(), biomass_kg = sum(weight) / 1000, .groups = "drop")
```
## Changing relative importance
### Mean contribution
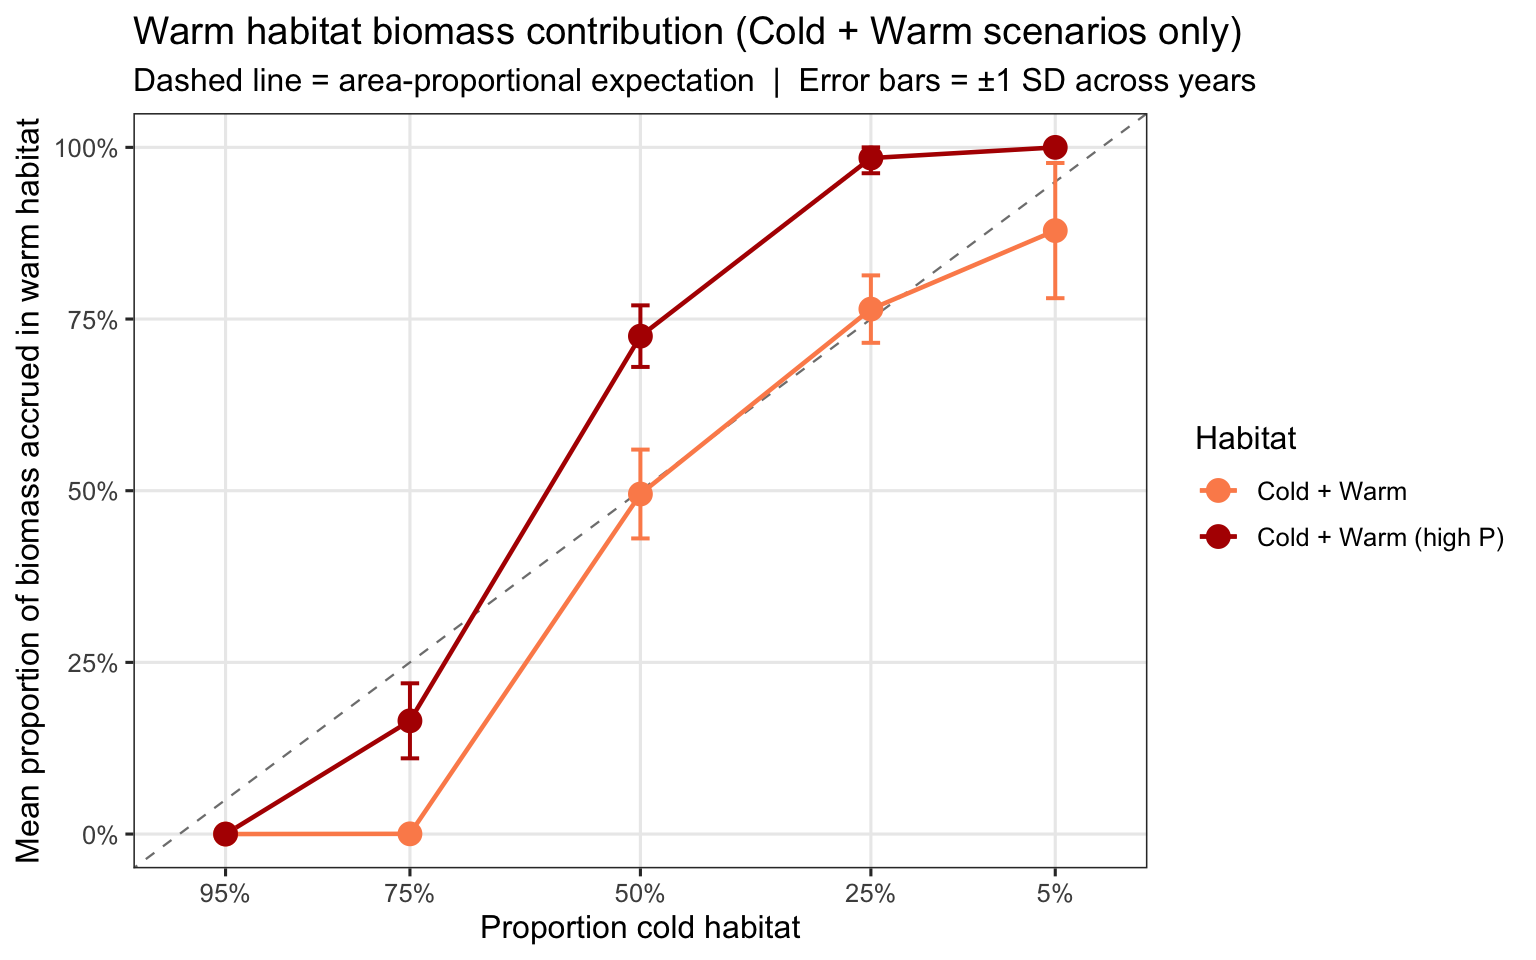
Mean (± SD across experimental years) proportion of annual population-level biomass accrued in warm habitat, as a function of cold vs. warm habitat availability. Biomass accrual computed across all strategies as the sum of daily growth (weight × ggd) in each patch.
```{r}
#| fig-width: 8
#| fig-height: 5
# Cold-only (null) scenarios have no warm patch, so their warm contribution is
# 0 by definition and is not shown here.
warm_share_scen <- patch_growth |>
  filter(hab_type %in% c("Cold + Warm", "Cold + Warm (high P)")) |>
  pivot_wider(names_from = patch, values_from = total_g, values_fill = 0) |>
  mutate(
    pos_warm   = pmax(warm, 0),
    pos_cold   = pmax(cold, 0),
    f_warm_pos = if_else(pos_warm + pos_cold > 0,
                         pos_warm / (pos_warm + pos_cold),
                         NA_real_)
  ) |>
  group_by(hab_type, label, prop_cold) |>
  summarise(
    mean_f_warm = mean(f_warm_pos, na.rm = TRUE),
    sd_f_warm   = sd(f_warm_pos,   na.rm = TRUE),
    .groups     = "drop"
  )

ggplot(warm_share_scen, aes(x = prop_cold, y = mean_f_warm, color = hab_type, group = hab_type)) +
  # Area-proportional expectation: f_warm = 1 - prop_cold
  geom_abline(slope = 1, intercept = 1, linetype = "dashed",
              color = "grey50", linewidth = 0.4) +
  geom_errorbar(
    aes(ymin = pmax(0, mean_f_warm - sd_f_warm),
        ymax = pmin(1, mean_f_warm + sd_f_warm)),
    width = 0.02, linewidth = 0.7
  ) +
  geom_line(linewidth = 0.8) +
  geom_point(size = 4, shape = 16) +
  # scale_shape_manual(  values = hab_shape,  name = "Habitat") +
  scale_color_manual(values = hab_cols, name = "Habitat") +
  scale_x_continuous(
    breaks = scen_meta$prop_cold,
    labels = scales::label_percent(accuracy = 1),
    limits = c(0, 1),
    transform = "reverse"
  ) +
  scale_y_continuous(labels = scales::label_percent(accuracy = 1),
                     limits = c(0, 1)) +
  labs(
    x        = "Proportion cold habitat",
    y        = "Mean proportion of biomass accrued in warm habitat",
    title    = "Warm habitat biomass contribution (Cold + Warm scenarios only)",
    subtitle = "Dashed line = area-proportional expectation  |  Error bars = \u00b11 SD across years"
  ) +
  theme_bw(base_size = 12) +
  theme(panel.grid.minor = element_blank(), legend.position = "right")
```
### Seasonal contribution
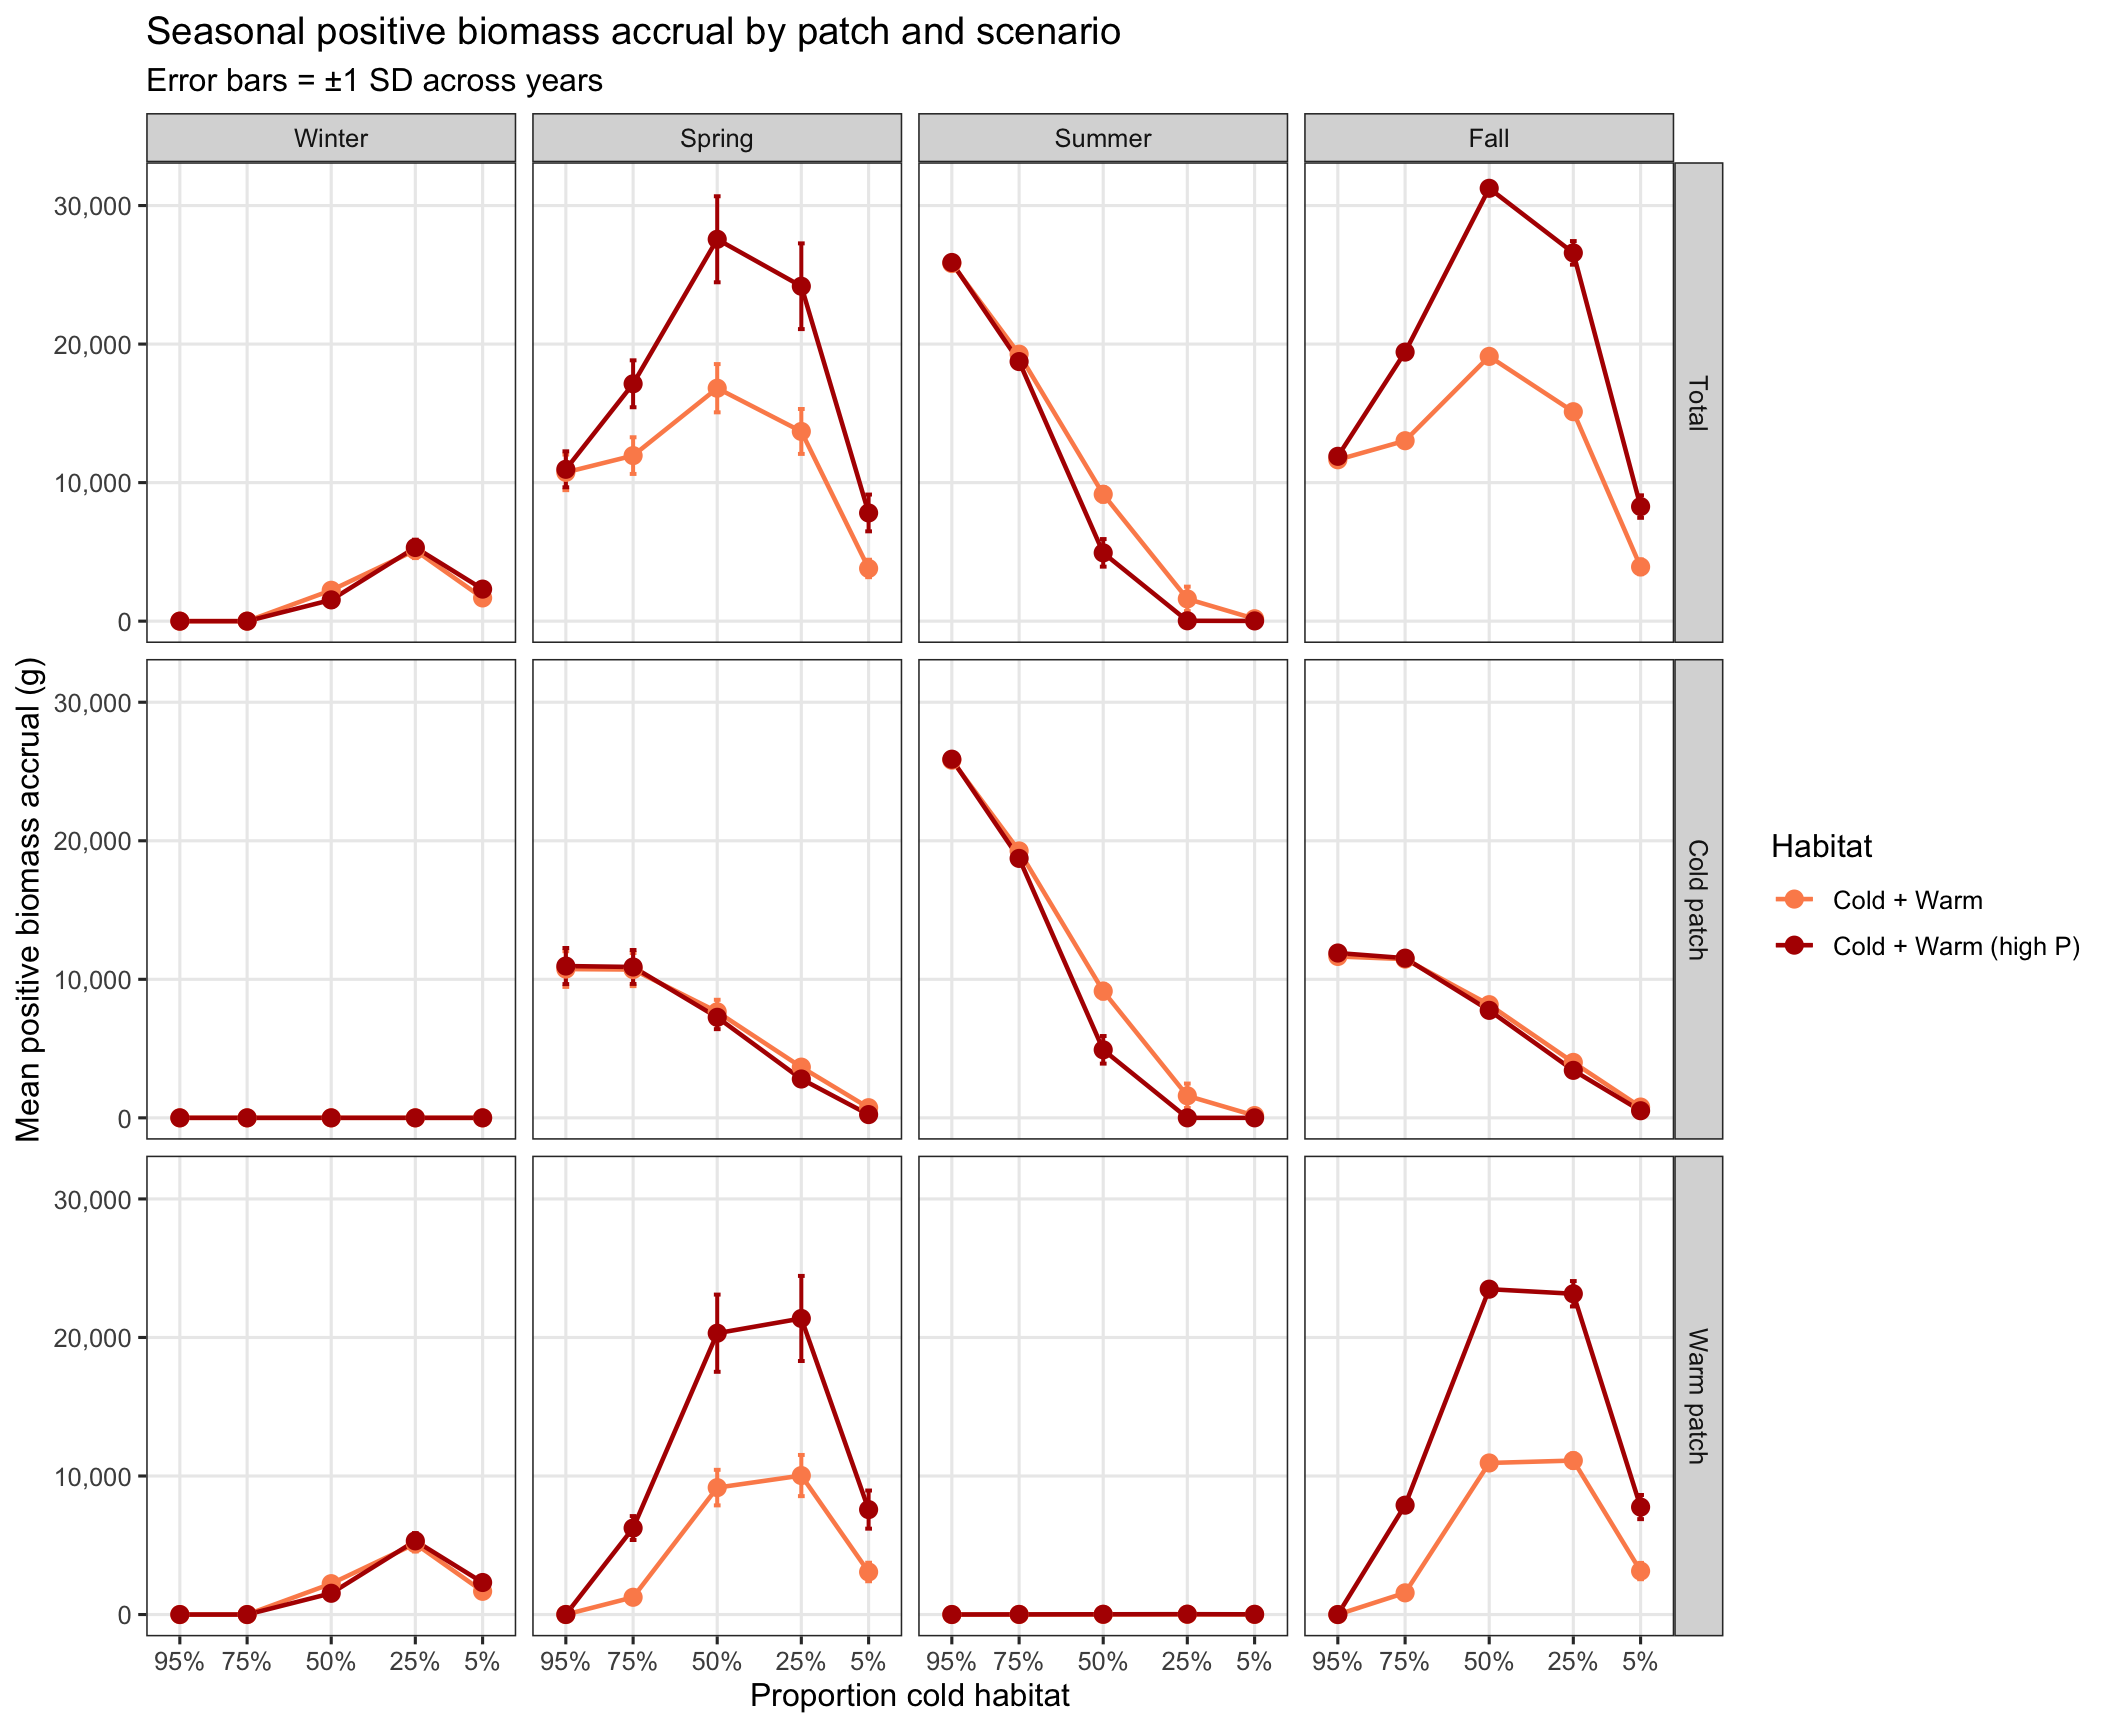
Mean positive biomass accrual per season, broken down by patch (total, cold, warm), showing absolute growth magnitude across cold habitat availability scenarios.
```{r}
#| fig-width: 11
#| fig-height: 9
compute_patch_growth_seasonal <- function(ibm_long, scen_key) {
  ibm_long |>
    filter(date >= exp_start_date, !is.na(ggd)) |>
    mutate(
      daily_growth_g = weight * ggd,
      year   = year(date),
      month  = month(date),
      season = case_when(
        month %in% c(12, 1, 2)  ~ "Winter",
        month %in% c(3, 4, 5)   ~ "Spring",
        month %in% c(6, 7, 8)   ~ "Summer",
        month %in% c(9, 10, 11) ~ "Fall"
      ),
      season = factor(season, levels = c("Winter", "Spring", "Summer", "Fall"))
    ) |>
    group_by(year, season, patch) |>
    summarise(total_g = sum(daily_growth_g, na.rm = TRUE), .groups = "drop") |>
    mutate(scen_key = scen_key)
}

patch_growth_seasonal <- purrr::map_dfr(
  ibm_list_mech[sapply(ibm_list_mech, \(s) s$ht != "Cold only")],
  function(scen) {
    compute_patch_growth_seasonal(scen$df, pc_to_key(scen$pc)) |>
      mutate(hab_type = scen$ht)
  }
) |>
  left_join(scen_meta, by = "scen_key") |>
  mutate(
    label    = factor(label,    levels = scen_meta$label),
    hab_type = factor(hab_type, levels = c("Cold + Warm", "Cold + Warm (high P)", "Cold only"))
  )

per_patch <- patch_growth_seasonal |>
  filter(hab_type %in% c("Cold + Warm", "Cold + Warm (high P)")) |>
  mutate(pos_g = pmax(total_g, 0)) |>
  select(hab_type, year, season, patch, pos_g, label, prop_cold)

season_raw <- bind_rows(
  per_patch |>
    group_by(hab_type, year, season, label, prop_cold) |>
    summarise(pos_g = sum(pos_g, na.rm = TRUE), .groups = "drop") |>
    mutate(patch_label = "Total"),
  per_patch |> mutate(patch_label = case_when(
    patch == "cold" ~ "Cold patch",
    patch == "warm" ~ "Warm patch"
  ))
) |>
  mutate(patch_label = factor(patch_label,
                              levels = c("Total", "Cold patch", "Warm patch"))) |>
  group_by(hab_type, label, prop_cold, season, patch_label) |>
  summarise(
    mean_pos_g = mean(pos_g, na.rm = TRUE),
    sd_pos_g   = sd(pos_g,   na.rm = TRUE),
    .groups = "drop"
  )

ggplot(season_raw, aes(x = prop_cold, y = mean_pos_g, color = hab_type, group = hab_type)) +
  geom_errorbar(
    aes(ymin = pmax(0, mean_pos_g - sd_pos_g),
        ymax = mean_pos_g + sd_pos_g),
    width = 0.02, linewidth = 0.7
  ) +
  geom_line(linewidth = 0.8) +
  geom_point(size = 3, shape = 16) +
  # scale_shape_manual(values = hab_shape,  name = "Habitat") +
  scale_color_manual(values = hab_cols, name = "Habitat") +
  scale_x_continuous(
    breaks = scen_meta$prop_cold,
    labels = scales::label_percent(accuracy = 1),
    limits = c(0, 1),
    transform = "reverse"
  ) +
  scale_y_continuous(labels = scales::label_comma()) +
  facet_grid(patch_label ~ season) +
  labs(
    x        = "Proportion cold habitat",
    y        = "Mean positive biomass accrual (g)",
    title    = "Seasonal positive biomass accrual by patch and scenario",
    subtitle = "Error bars = \u00b11 SD across years"
  ) +
  theme_bw(base_size = 12) +
  theme(panel.grid.minor = element_blank(), legend.position = "right")
```
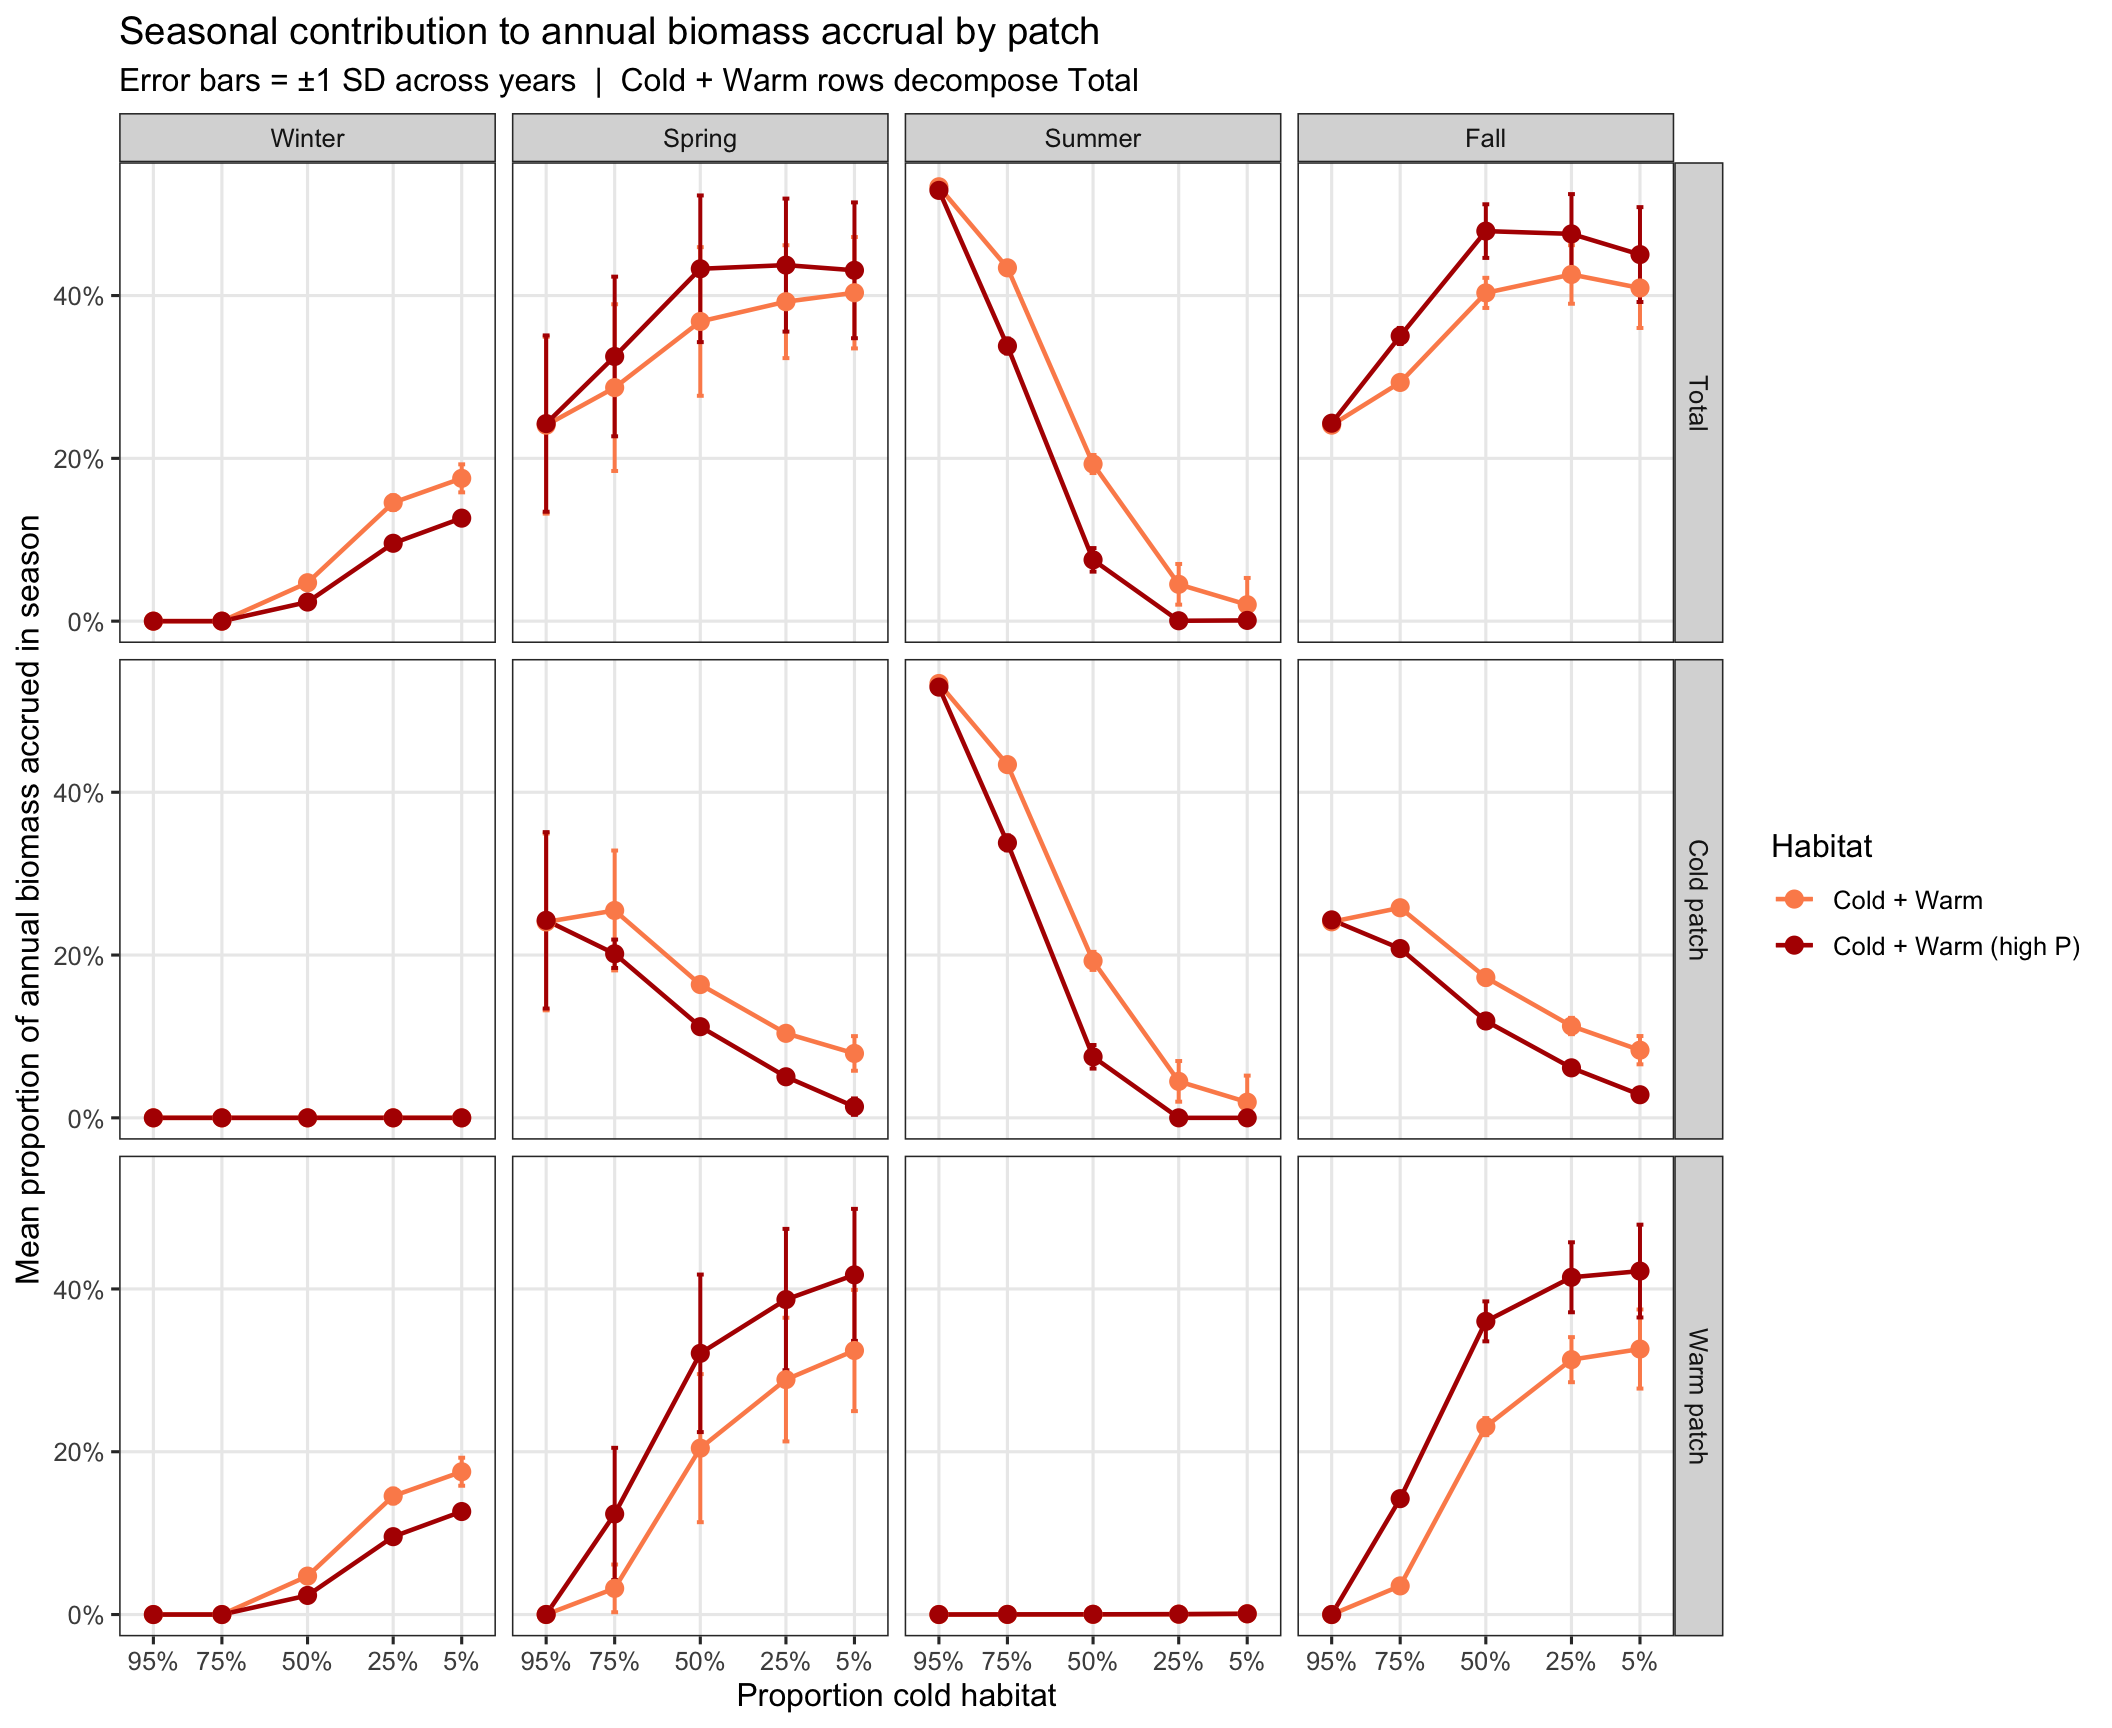
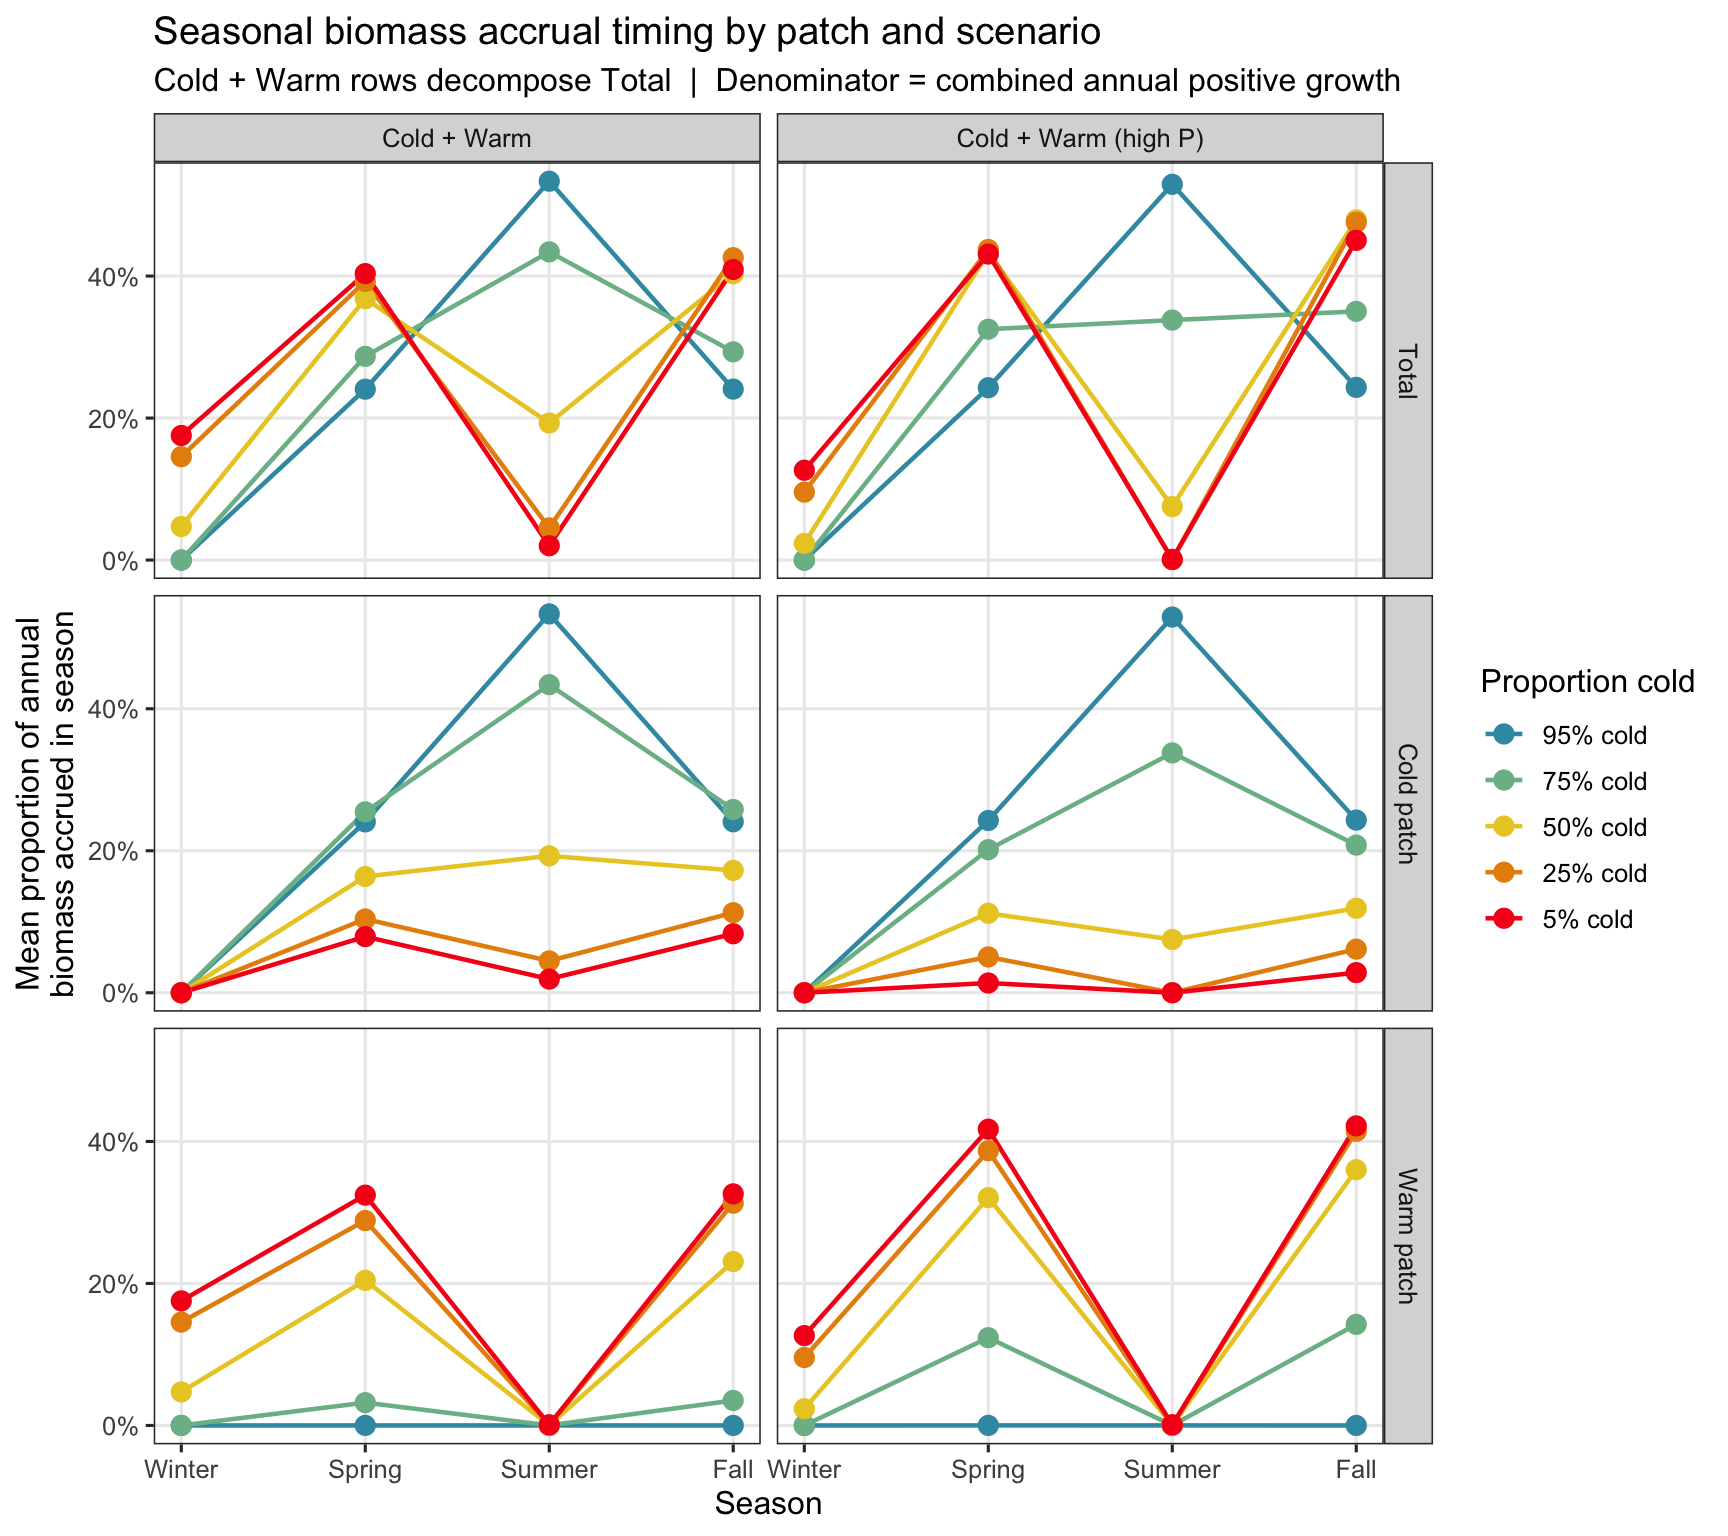
Each season's positive biomass accrual as a proportion of total annual positive growth (both patches combined), broken down by patch. The denominator is always the combined annual total, so the cold and warm patch rows decompose the total row and together sum to 100%.
```{r}
#| fig-width: 11
#| fig-height: 9
# Annual total positive growth (both patches, all seasons) — the shared denominator
annual_total <- patch_growth_seasonal |>
  filter(hab_type %in% c("Cold + Warm", "Cold + Warm (high P)")) |>
  mutate(pos_g = pmax(total_g, 0)) |>
  group_by(hab_type, year, label, prop_cold) |>
  summarise(annual_pos_g = sum(pos_g, na.rm = TRUE), .groups = "drop")

per_patch_season <- patch_growth_seasonal |>
  filter(hab_type %in% c("Cold + Warm", "Cold + Warm (high P)")) |>
  mutate(pos_g = pmax(total_g, 0)) |>
  select(hab_type, year, season, patch, pos_g, label, prop_cold)

season_share_patch <- bind_rows(
  per_patch_season |>
    group_by(hab_type, year, season, label, prop_cold) |>
    summarise(pos_g = sum(pos_g, na.rm = TRUE), .groups = "drop") |>
    mutate(patch_label = "Total"),
  per_patch_season |>
    filter(patch == "cold") |>
    mutate(patch_label = "Cold patch") |>
    select(-patch),
  per_patch_season |>
    filter(patch == "warm") |>
    mutate(patch_label = "Warm patch") |>
    select(-patch)
) |>
  left_join(annual_total, by = c("hab_type", "year", "label", "prop_cold")) |>
  mutate(
    patch_label = factor(patch_label,
                         levels = c("Total", "Cold patch", "Warm patch")),
    f_season    = if_else(annual_pos_g > 0, pos_g / annual_pos_g, NA_real_)
  ) |>
  group_by(hab_type, label, prop_cold, season, patch_label) |>
  summarise(
    mean_f_season = mean(f_season, na.rm = TRUE),
    sd_f_season   = sd(f_season,   na.rm = TRUE),
    .groups = "drop"
  )

# Faceted by season (columns) × patch (rows); prop_cold on x-axis
ggplot(season_share_patch, aes(x = prop_cold, y = mean_f_season, color = hab_type, group = hab_type)) +
  geom_errorbar(
    aes(ymin = pmax(0, mean_f_season - sd_f_season),
        ymax = pmin(1, mean_f_season + sd_f_season)),
    width = 0.02, linewidth = 0.7
  ) +
  geom_line(linewidth = 0.8) +
  geom_point(size = 3, shape = 16) +
  # scale_shape_manual(values = hab_shape,  name = "Habitat") +
  scale_color_manual(values = hab_cols, name = "Habitat") +
  scale_x_continuous(
    breaks = scen_meta$prop_cold,
    labels = scales::label_percent(accuracy = 1),
    limits = c(0, 1),
    transform = "reverse"
  ) +
  scale_y_continuous(labels = scales::label_percent(accuracy = 1)) +
  facet_grid(patch_label ~ season) +
  labs(
    x        = "Proportion cold habitat",
    y        = "Mean proportion of annual biomass accrued in season",
    title    = "Seasonal contribution to annual biomass accrual by patch",
    subtitle = "Error bars = \u00b11 SD across years  |  Cold + Warm rows decompose Total"
  ) +
  theme_bw(base_size = 12) +
  theme(panel.grid.minor = element_blank(), legend.position = "right")
```
```{r}
#| fig-width: 9
#| fig-height: 8
# Season on x-axis, colored by scenario, patch in rows
ggplot(season_share_patch,
       aes(x = as.numeric(season), y = mean_f_season,
           color = label, group = label)) +
  geom_line(linewidth = 0.8) +
  geom_point(size = 3) +
  scale_color_manual(values = scen_pal, name = "Proportion cold") +
  scale_x_continuous(
    breaks = 1:4,
    labels = levels(season_share_patch$season)
  ) +
  scale_y_continuous(labels = scales::label_percent(accuracy = 1)) +
  facet_grid(patch_label ~ hab_type) +
  labs(
    x        = "Season",
    y        = "Mean proportion of annual\nbiomass accrued in season",
    title    = "Seasonal biomass accrual timing by patch and scenario",
    subtitle = "Cold + Warm rows decompose Total  |  Denominator = combined annual positive growth"
  ) +
  theme_bw(base_size = 12) +
  theme(panel.grid.minor = element_blank(), legend.position = "right")
```
**As we lose cold-water habitat and gain warm-water habitat, the growth regime becomes increasingly bi-modal; with an increasing share of annual biomass being accrued in the warm patch in the non-summer seasons (particularly spring and autumn), and a decreasing share of annual biomass being accrued in summer in the cold patch. Moreover, the relative importance of warm habitat to spring and fall biomass accrual increases when maximum consumption rates (P-values) are greater in the warm habitat.**